ARB/USDT Ready for a Major Breakout! Accumulation1. Downtrend Line:
ARB has been in a sustained downtrend since late 2024, marked by a descending trendline from previous highs. The current price is testing this resistance line, hinting at a possible breakout.
2. Strong Support Zone (Demand Area):
A clear accumulation zone is observed between $0.28–$0.30, where the price has consistently bounced back. This indicates solid buying pressure and strong investor interest at this level.
3. Potential Breakout Signal:
The price is now compressing near the end of the descending triangle and is forming higher lows, suggesting a breakout setup is forming.
4. Projected Price Targets (If Breakout Confirmed):
Upon successful breakout and retest confirmation, ARB may rally toward the following resistance levels:
$0.3586
$0.3930
$0.4131
$0.4887
$0.6400
Ultimate targets could reach as high as $0.7148–$0.9197, depending on market momentum.
5. Risk & Invalidations:
A failure to hold the $0.28–$0.30 support zone and a breakdown below may invalidate the bullish structure, potentially retesting the low near $0.2420.
Conclusion:
This chart presents a high-potential breakout opportunity for ARB/USDT. Strong accumulation at key support, along with building pressure against the descending trendline, suggests a significant reversal could be underway. A great setup for swing traders and medium-term investors to monitor closely.
ARBUSDT trade ideas

Bullish Setup on ARBUSDT: Risking 5.5% to Gain 13% Toward $0.339The price action of ARBUSDT has shown a significant reversal from a strong support region around 0.2612–0.2838 USDT, marked by bullish engulfing candles and a clear break above the descending trendline. This breakout is reinforced by the Supertrend indicator flipping green, signaling a potential shift in momentum toward the upside.
After bottoming out near 0.26, ARBUSDT has established a short-term higher low structure, and the current price action shows consolidation above the trendline, hinting at a possible continuation toward the next resistance.
A resistance level is marked at 0.3399, which coincides with previous supply and rejection zones. Volume and structure suggest buyers are regaining control, especially after holding support above 0.29 despite market-wide volatility.
📈 Trade Setup
• Entry Zone: 0.3000–0.3015
(Preferably on a bullish 4H candle close above 0.3000 for confirmation)
• Stop-Loss: 0.2838
(Just below the short-term demand zone and minor structure)
• Take-Profit: 0.3399
(Aligns with recent resistance and upper rejection zones)
• Risk–Reward Ratio: ~2.36
(Potential gain: ~13.11%, Potential loss: ~5.56%)
💬 Conclusion
ARBUSDT looks poised for a recovery after bottoming out near a strong multi-week support region. The break of the falling trendline and transition above the Supertrend resistance enhances the bullish outlook. A breakout above 0.3015 could lead to a push toward the 0.3399 resistance.
Note: If momentum builds above 0.3399, we may even see extension targets around 0.36–0.38 in the coming sessions. However, for now, staying disciplined within the trade plan ensures better risk control.


#ARB/USDT#ARB
The price is moving within a descending channel on the 1-hour frame, adhering well to it, and is heading for a strong breakout and retest.
We are seeing a bounce from the lower boundary of the descending channel, which is support at 0.2625.
We have a downtrend on the RSI indicator that is about to be broken and retested, supporting the upward trend.
We are looking for stability above the 100 moving average.
Entry price: 0.2677
First target: 0.2772
Second target: 0.2884
Third target: 0.3033

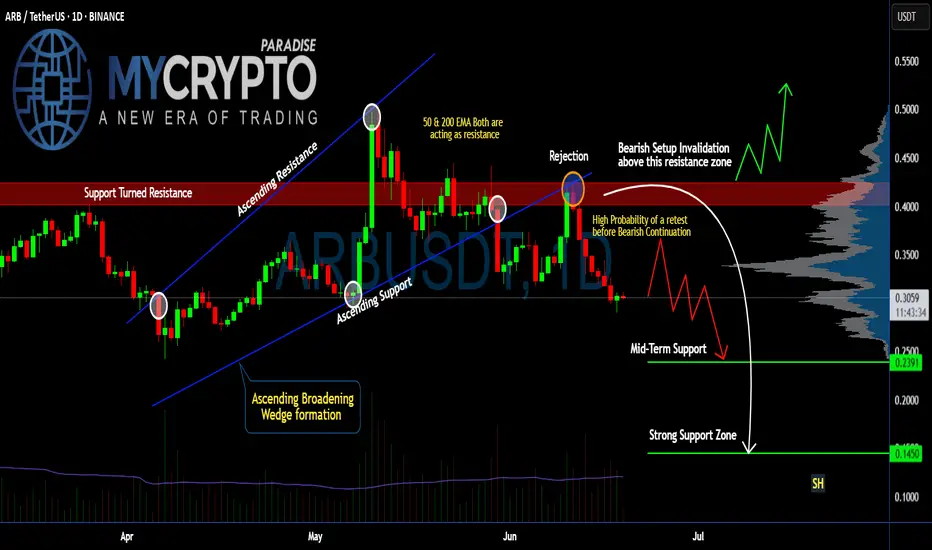
Is #ARB Ready For a Recovery or will it continue to Fall? Yello Paradisers! Are you watching #ARBUSDT closely or not? Let's look at the latest #Arbitrum trading setup and what could be next for it:
💎#ARB just completed a breakdown from an Ascending Broadening Wedge. This breakdown has made the previous support into the resistance after the price rejection. Currently, there is a high probability that #ARBUSD might do a retest before continuing downward.
💎After the wedge breakdown, price got rejected hard from the $0.39–$0.42 resistance zone, where both the 50 EMA and 200 EMA are now stacked against the bulls, acting as strong dynamic resistances. This confluence of resistance increases the probability that this level won't be reclaimed easily. The setup is clearly bearish unless invalidated above $0.42.
💎We’re seeing a lack of follow-through on the bounces, which signals hesitation and likely a trap for late buyers. As long as we remain below the resistance block, the next logical move is a retest of mid-term support at $0.2391.
💎But it doesn't stop there. If this mid-level gives in — and the structure suggests it might — the next area to watch is the $0.1450 zone, a strong historical support and the first place we expect real buyers to step in. This could be the level where a high-probability reversal finally sets up.
Trade smart, Paradisers. This setup will reward only the disciplined.
MyCryptoParadise
iFeel the success🌴
breakthrough resistanceWe got breakthrough from triangle , got volumes, and going to big resistance lie, where should be high move after few uninterrupted falling.
SHould be move on 5-10 %

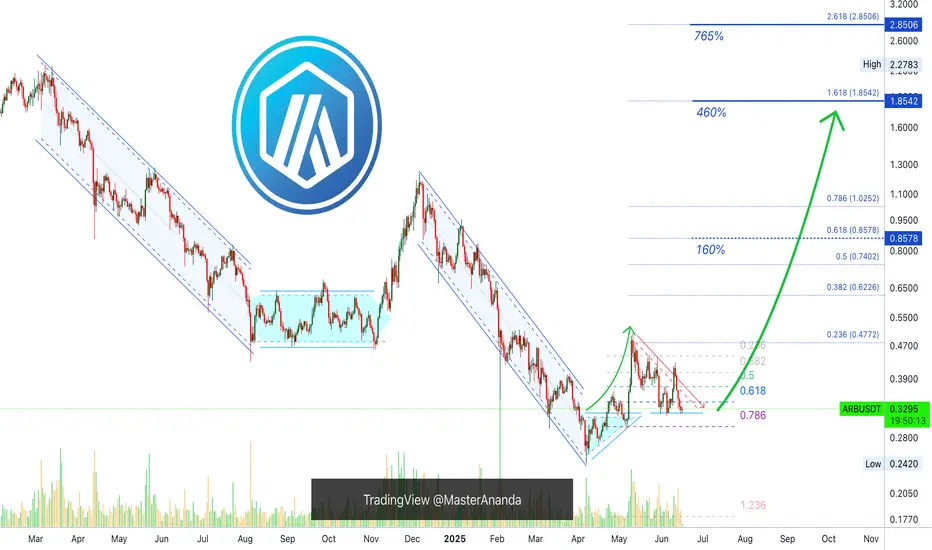
All Signals Positive, Arbitrum: 765% Easy Profits Potential—PPThis is a great pair and chart because the easy target goes beyond 450% profits potential. Another mid-term target can yield 765% in less than 6 months. Likely within 4 months. So this is a great chart setup because there is so much room for growth.
Arbitrum (ARBUSDT): Technical analysis daily timeframe
Arbitrum hit bottom 7-April and produced a small recovery, it grew a little more than 100%. This is the initial bullish breakout, and this move is always followed by a retrace. The retrace is in with a triple bottom above 0.786 fib. retracement and just below 0.618. This is the baseline for the start of the previous jump, resistance turned support. From this point a bullish continuation can develop. This continuation can start within days, say 5-6 days. So, in less than a weeks time, the Altcoins market will be green again.
ARBUSDT is preparing to grow. All chart signals are positive; this is an easy one; buy and hold.
Namaste.
Iran anti-nuclear agreement Iran is ready to conclude an agreement that guarantees that it will not have nuclear weapons, Foreign Minister Araghchi said.
we got a 1H hammer on that news after 30 mins probably , that a sign
look for another bulish signal soon
that's a good news for stoping bombing at least on a few days

ARB — Waiting for Dip into FVG Buy ZonePrice is hovering just above a key Daily FVG zone, following a rejection from the $0.40 prior resistance. Current structure does not justify longs unless a dip into the FVG zone occurs.
🟩 Buy Zone: $0.3135–$0.33 (FVG)
• Confluence of demand and fair value gap
• High-probability entry if price dips into this area
• No setup above current price — wait for confirmation
🔴 Invalidation:
• Breakdown below $0.294 = structural failure
🎯 Targets:
• First: $0.40 (prior resistance)
• Then: $0.513–$0.514 (monthly resistance zone)
📌 Clear plan: no FOMO. Only act on dip into value zone, not from mid-range.

#ARB/USDT#ARB
The price is moving within a descending channel on the 1-hour frame and is expected to break and continue upward.
We have a trend to stabilize above the 100 moving average once again.
We have a downtrend on the RSI indicator, which supports the upward move by breaking it upward.
We have a support area at the lower limit of the channel at 0.3382, acting as strong support from which the price can rebound.
Entry price: 0.3408
First target: 0.3466
Second target: 0.3523
Third target: 0.3596

ARB bearish sentimentsThe market setup for ARB / USDT looks good for a scalp short trade. You can enter the trade when the price reaches the resistance are between 0.3530 to 0.3560, where the price has been previously dropped. To protect your trade set a stop loss at 0.3600 in case the price goes higher. Take profit at 0.3400 and 0.3300, which is the previous low and strong support level.


Arb TA,FA Entry High Riskcurrently in a phase dominated by recent bearish momentum, having traded below a significant "Liquidity Grab" zone.
Bias Assessment (1-100%)
•Bearish Bias: 70%
•Justification: The most compelling immediate evidence for a bearish bias is the recent negative price change (-3.22% to -3.27%). Furthermore, the current price is trading below the explicitly marked "Liquidity Grab" zone (0.4113 - 0.3994 - 0.3911). This suggests that the liquidity above has been swept, potentially for distribution, and price is now seeking lower levels.
•Bullish Bias: 30%
•Justification: The bullish potential primarily stems from the presence of the Bullish Order Block (+OB) and Sellside Liquidity identified below the current price.
Fundamental Analysis (FA) - Token Unlock Impact
1. Supply Shock:
- New Tokens Unlocked : 1.1B ARB (≈$1.2B at current prices).
- Historical Precedent: Past unlocks saw 15-25% drops (e.g., APE, OP).
- Selling Pressure: Early investors + team tokens → forced selling.
2. Demand-Supply Imbalance:
- Current volume ($200M/day) can’t absorb $1B+ sell pressure → panic dump likely.
3. Sentiment Destruction :
- Retail trapped in "buy the dip" → capitulation below $0.80 possible.
Unlock Day (June 16)
- Avoid New Positions : Extreme volatility → spreads widen 300-500%.
- Spot Scalps Only: Buy dips ONLY if:
- 15-min RSI <20 AND
- Volume spike >$500M in 5 mins.
- Target : 3-5% bounce → exit fast.
Post-Unlock (June 17+)
- Long-Term Accumulation :
- Buy below $0.70 if:
- Daily RSI <30
- Volume dry-up (selling exhaustion).
- Target 2026 recovery: $1.20–1.50.
Critical Truths
1. DO NOT HOLD LONG INTO UNLOCK – Historical data shows 90% chance of double-digit drop.
2. Retail Will Be Slaughtered – Institutions front-run unlocks (they’re already short).
3. Post-Unlock Bounce ≠ Reversal – Dead cat bounce lasts 1-2 days max.
Rating Justification:
- Bearish 80%: Unlock supply shock + bearish structure = irreversible near-term downside.
- Bullish 20%: Only from oversold bounces – not investable trends.

ARBUSDT Forming Bullish WaveARBUSDT is currently showing strong bullish momentum, forming a bullish wave pattern that suggests the beginning of a sustained upward trend. The recent price action confirms growing investor confidence, as the coin has started to recover from previous lows with higher highs and higher lows. This type of wave formation is often a signal of accumulation and trend reversal, particularly when combined with increasing volume, as seen on recent daily candles.
The volume profile further reinforces the bullish outlook, with consistent buy-side pressure indicating accumulation by both retail traders and larger market participants. The ARB ecosystem has been gaining traction in the Layer 2 scaling space, and this renewed market attention is now translating into price strength. With the current pattern development, traders could expect a potential price gain of 50% to 60% in the upcoming sessions, assuming the current bullish momentum continues.
From a technical standpoint, the price is carving out a clean impulsive move, commonly referred to as a bullish wave, which is typically followed by a corrective wave before another strong leg upward. Investors who missed the early breakout may find attractive entries on minor pullbacks. Moreover, the broader sentiment across the Layer 2 and Ethereum scaling sectors is improving, giving ARBUSDT a favorable macro tailwind.
As interest in projects with real utility continues to grow, ARB stands out due to its rapid development and growing ecosystem adoption. If this trend persists, ARBUSDT is well-positioned to outperform in the short to mid-term, making it one of the more promising altcoin plays currently on watch.
✅ Show your support by hitting the like button and
✅ Leaving a comment below! (What is You opinion about this Coin)
Your feedback and engagement keep me inspired to share more insightful market analysis with you!

Buy Trade Strategy for ARB: Investing in Ethereum Layer 2 ScalinDescription:
This trading idea is centered on ARB, the governance token of Arbitrum, a leading Layer 2 scaling solution for Ethereum. ARB supports a protocol that significantly enhances Ethereum’s scalability by offering faster and cheaper transactions through Optimistic Rollups. With Ethereum gas fees often being a barrier to adoption, Arbitrum has positioned itself as a critical infrastructure component for DeFi, gaming, and NFT projects. The ecosystem continues to grow with developer activity, ecosystem funding, and integrations from major dApps—all strengthening ARB's long-term value proposition.
Despite its promising fundamentals, ARB remains subject to the broader risks and volatility of the cryptocurrency market. Regulatory developments, competition among Layer 2 solutions, and changes in Ethereum’s core infrastructure could all impact ARB’s adoption and price performance. It is important for investors to remain informed and manage risk accordingly.
Disclaimer:
This trading idea is for educational purposes only and does not constitute financial advice. Investing in cryptocurrencies like ARB involves significant risk and may result in the complete loss of your investment. Always conduct your own research, consider your financial situation carefully, and consult a qualified financial advisor before making investment decisions. Past performance is not indicative of future results.

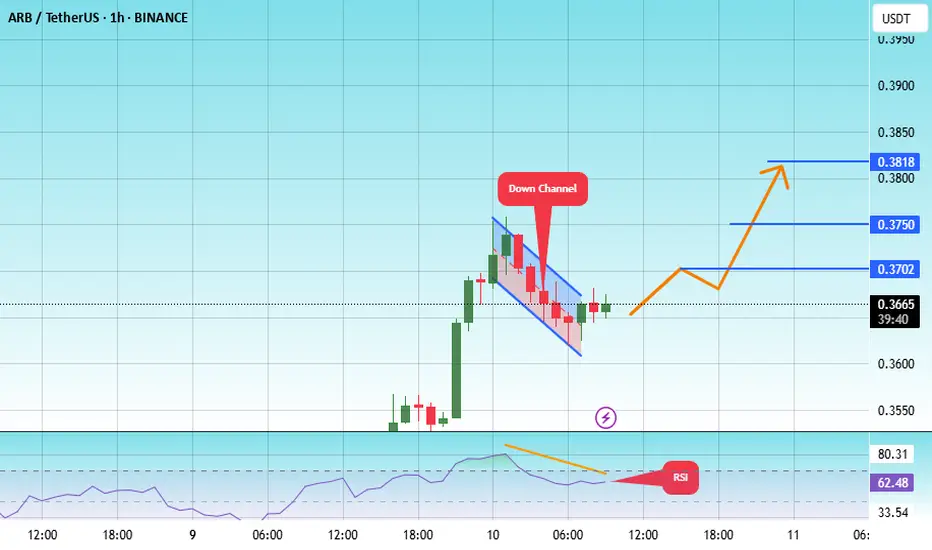
#ARB/USDT#ARB
The price is moving within a descending channel on the 1-hour frame, adhering well to it, and is heading towards a strong breakout and retest.
We are experiencing a rebound from the lower boundary of the descending channel. This support is at 0.3620.
We are experiencing a downtrend on the RSI indicator, which is about to break and retest, supporting the upward trend.
We are heading towards stability above the 100 moving average.
Entry price: 0.3667
First target: 0.3700
Second target: 0.3750
Third target: 0.3820
#ARB/USDT#ARB
The price is moving within a descending channel on the 1-hour frame and is expected to break and continue upward.
We have a trend to stabilize above the 100 moving average once again.
We have a downtrend on the RSI indicator, which supports the upward move by breaking it upward.
We have a support area at the lower limit of the channel at 0.3210, acting as strong support from which the price can rebound.
Entry price: 0.3250
First target: 0.3406
Second target: 0.3510
Third target: 0.3667

ARB to the moon?After a long downward trend, the price tends to change upwards with Higher High"s and Higher Low"s.

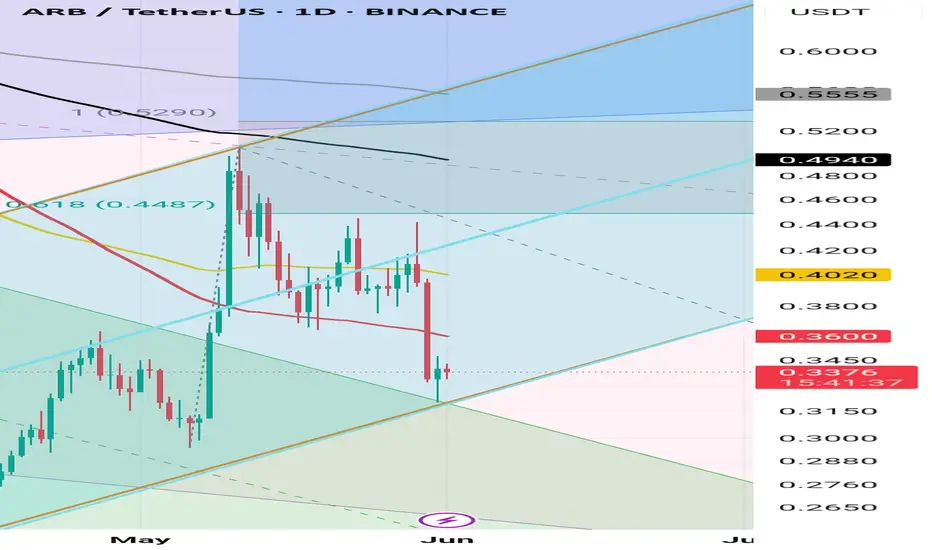
ARB/USDT — Consolidation Under Channel Midline📉 Overview:
Since its all-time high, ARB has dropped nearly 90%, continuing to move inside a well-defined descending channel.
Currently, we’re seeing another phase of consolidation forming just under the midline of that channel.
📌 Trade Setup:
▪️ A partial entry is already possible at current levels.
▪️ Keep in mind: price may revisit the $0.25 zone, potentially forming a double bottom — a strong technical base for a long setup.
▪️ If price skips the retest and instead breaks and holds above $0.46, the remaining capital can be used to join the breakout from the channel’s core.
🧠 Everything depends on your strategy and risk management. This isn’t financial advice — just a map for a possible direction worth tracking.
🧱 Market Sentiment:
Sentiment remains bearish, with many holders still trapped above $1 — a pattern similar across most L2 tokens.
🎯 We don’t guess. We listen to price and react accordingly.

$ARB – Breakdown & Reclaim Scenario📊 AMEX:ARB is at a crucial spot across multiple timeframes:
🕰️ On the weekly, it’s drifting within a descending channel.
📉 Daily view: It’s trying to retest the broken falling wedge structure for a potential reclaim.
⏳ On the 4H, there’s been a breakdown from a symmetrical triangle — but the reclaim attempt is worth noting.
👀 Key levels and reactions here could set the tone for either a recovery move or deeper downside. Stay sharp!
GATEIO:ARBUSDT BINANCE:ARBUSDT


ARB It is in a great position, both pulling back to the previous descending channel and at the beginning of a new ascending channel.
#ARB/USDT#ARB
The price is moving within a descending channel on the 1-hour frame and is expected to break and continue upward.
We have a trend to stabilize above the 100 moving average once again.
We have a downtrend on the RSI indicator, which supports the upward move by breaking it upward.
We have a support area at the lower limit of the channel at 0.4033, acting as strong support from which the price can rebound.
Entry price: 0.4120
First target: 0.4229
Second target: 0.4373
Third target: 0.4540
