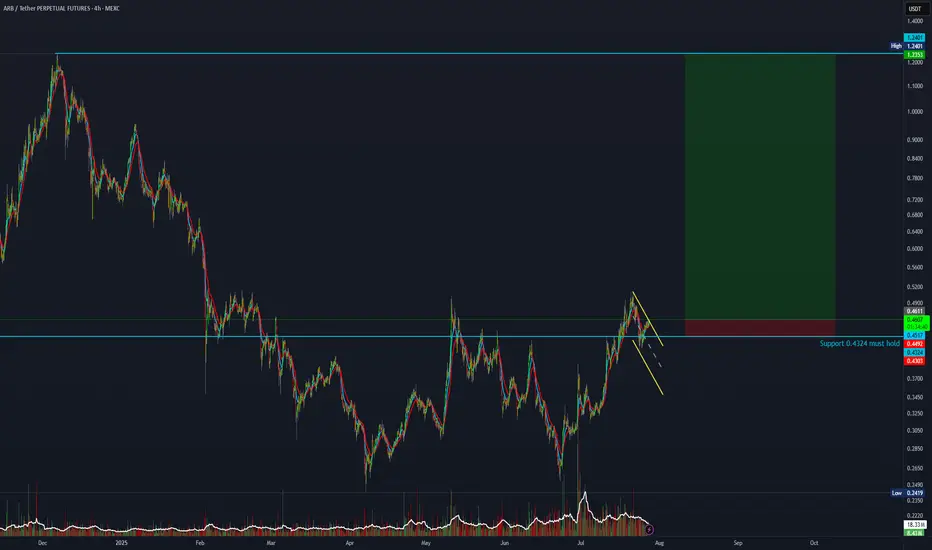
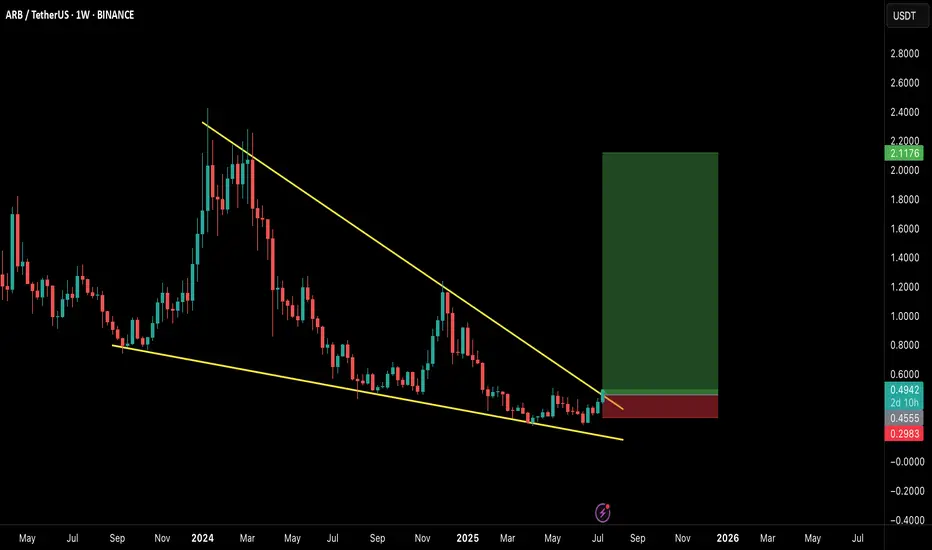
25:1 R:R trade setup on ArbitrumThis is it — a high-risk trade setup with a 25:1 R:R.
Entry: 0.4611
Stop Loss: 0.4303
Target: 1.2300
Not financial advice. Risk only 1% of your portfolio.
Market insights
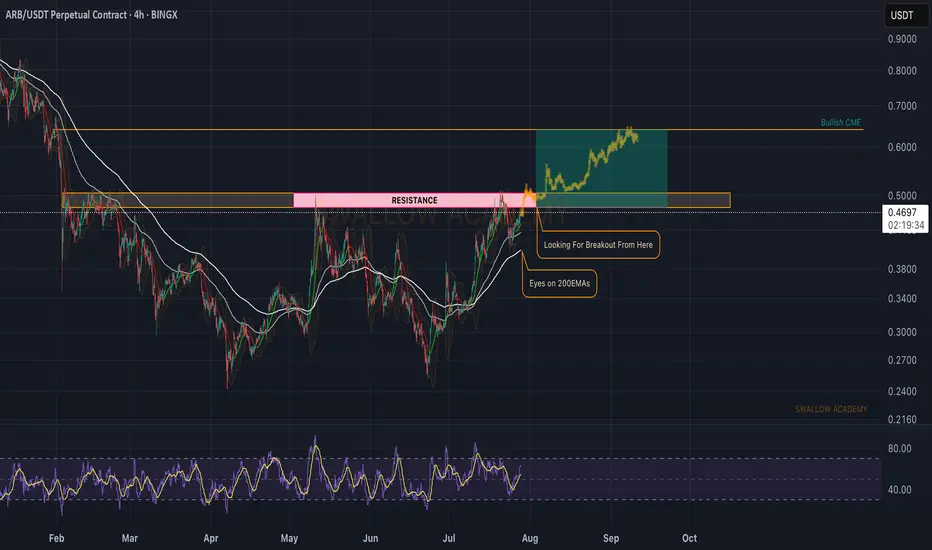
Arbitrum (ARB): Approaching Major Resistance ZoneARB is getting closer and closer to that resistance zone, which we are looking to be broken in order to give us that proper BOS and opportunity for movement to fill that bullish CME gap!
Swallow Academy
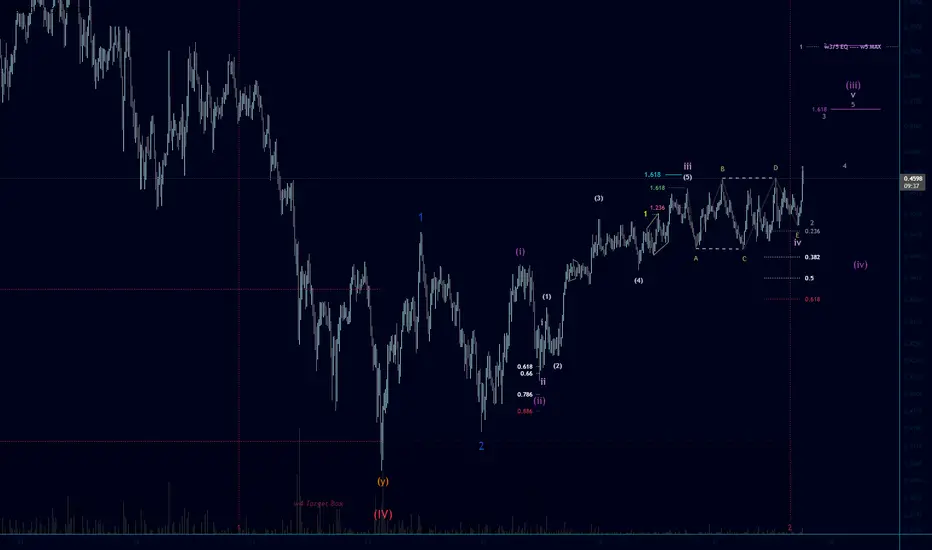
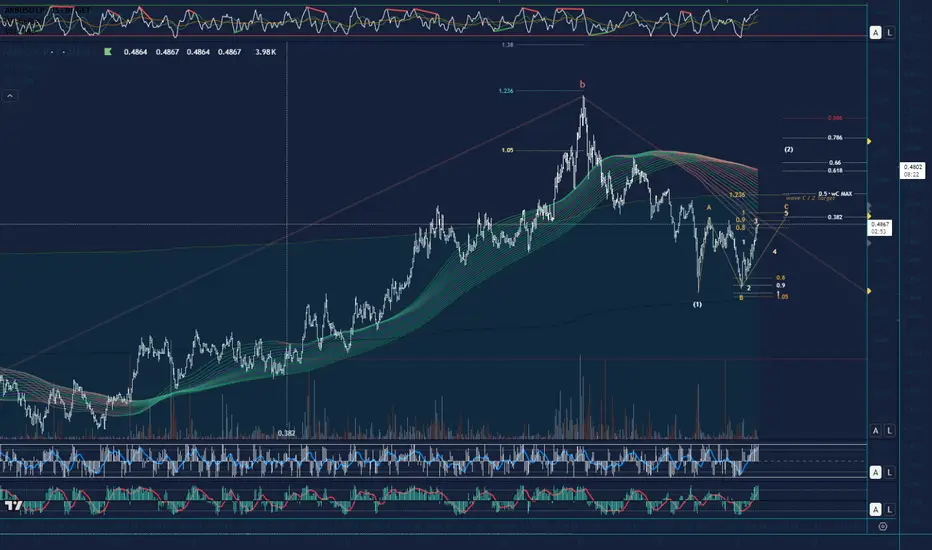
Arbitrum Bullish Elliott Wave Scenario! It seems the wave 4 Expanding Flat correction idea (previous post) played out well with our fib time and price targets! Always a good thing to have the right look in your wave count, fib time and price projections paired with the Elliott Wave rules and guidelines... its a whole other feel to my trading psychology and it gives me more confidence in the end. Breaking to the upside in the first of a few nested wave 3s, so i expect a bullish run up. (Keep in mind we finished red wave 4 just past the 1:1 fib time), if we are in a complex wave 4 still, it could easily extend to the 4 fib time without affecting probabilities. Starting to love this haha. Happy Trading 🌊🧙♂️
Arbitrum (ARB): Bullish Trend | Good Risk:Reward Setup!Arbitrum is hovering near a bullish trend where, despite being close to a bearish CME gap, we are looking for a proper bounce from here.
We are waiting for more bullish signs here and once we see them, we are going to aim to see the EMAs broken, after which we will be going long up until the local high, which is also a major resistance zone on bigger timeframes currently.
Swallow Academy

#ARB/USDT#ARB
The price is moving within a descending channel on the 1-hour frame, adhering well to it, and is on its way to breaking strongly upwards and retesting it.
We have support from the lower boundary of the descending channel, at 0.4550.
We have a downtrend on the RSI indicator that is about to be broken and retested, supporting the upside.
There is a major support area in green at 0.4520, which represents a strong basis for the upside.
Don't forget a simple thing: ease and capital.
When you reach the first target, save some money and then change your stop-loss order to an entry order.
For inquiries, please leave a comment.
We have a trend to hold above the 100 Moving Average.
Entry price: 0.4616
First target: 0.4751
Second target: 0.4923
Third target: 0.5135
Don't forget a simple thing: ease and capital.
When you reach the first target, save some money and then change your stop-loss order to an entry order.
For inquiries, please leave a comment.
Thank you.

#ARB/USDT Arbitrum scalp long to $ 0.5122#ARB
The price is moving within a descending channel on the 1-hour frame, adhering well to it, and is on its way to breaking strongly upwards and retesting it.
We have support from the lower boundary of the descending channel at 0.4270.
We have a downtrend on the RSI indicator that is about to be broken and retested, supporting the upside.
There is a major support area in green at 0.4300, which represents a strong basis for the upside.
Don't forget a simple thing: ease and capital.
When you reach the first target, save some money and then change your stop-loss order to an entry order.
For inquiries, please leave a comment.
We have a trend to hold above the 100 Moving Average.
Entry price: 0.4720
First target: 0.5554
Second target: 0.4982
Third target: 0.5122
Don't forget a simple thing: ease and capital.
When you reach your first target, save some money and then change your stop-loss order to an entry order.
For inquiries, please leave a comment.
Thank you.

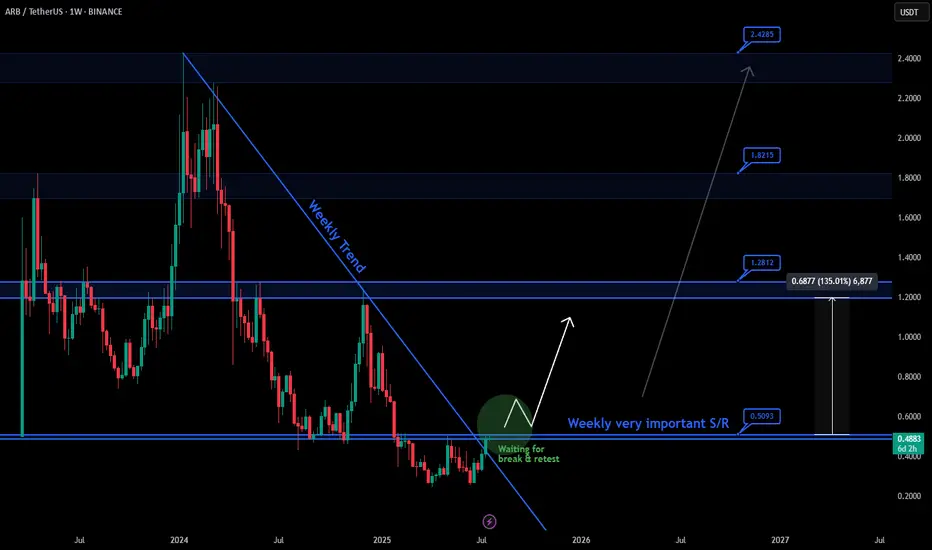
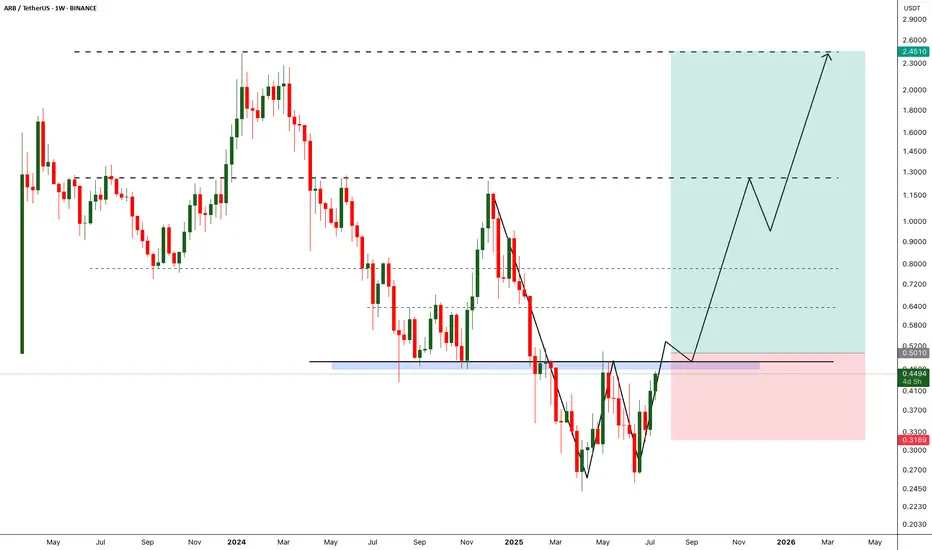
Big Move soon for Arbitrum (ARB) !, EASY 100%On the weekly chart, ARB is facing a clear long-term downtrend line. Currently, price is approaching a very important weekly resistance zone around $0.5, which has been tested multiple times.
✅ A confirmed breakout and retest above $0.5 could open the way for higher targets like 1.2$ and more ...
📌 Summary: Bullish scenario only valid after a clean breakout and successful retest
Update on Arbitrum Expanding FlatZooming in on the 3min TF the Target for completion of wave C of regular flat (White wave 2 retracement) will be 0.4888. Looking to reverse lower at this level to complete the white impulse down for wave C of larger degree Expanding Flat (See earlier post for HTF count)
ARB | Full-analysisHere is the top-down analysis for ARB as requested 🫡
Weekly Timeframe:
There are currently no valid bullish structures on the weekly chart, as AMEX:ARB has put in lower lows.
So we have no clear targets from a weekly perspective at this point.
Daily Chart:
A new bullish sequence was just activated with the break of the recent high at $0.505, targeting the $0.67–0.77 region.
This strongly suggests that the cycle low for AMEX:ARB is likely in.
Every pullback into the B–C correction zone (Fib 0.5–0.667) is a potential long opportunity, and I plan to take it if we revisit that area.
I will place 4 long orders, each with a stop-loss just below the next level.
There is currently nothing interesting happening on the lower timeframes.
--------
Thats the my full Analysis for AMEX:ARB , hope it was helpful if yall have anymore questions feel free to ask, and if you want me to do another analysis for any other pair just comment down below.
Thanks for reading❤️
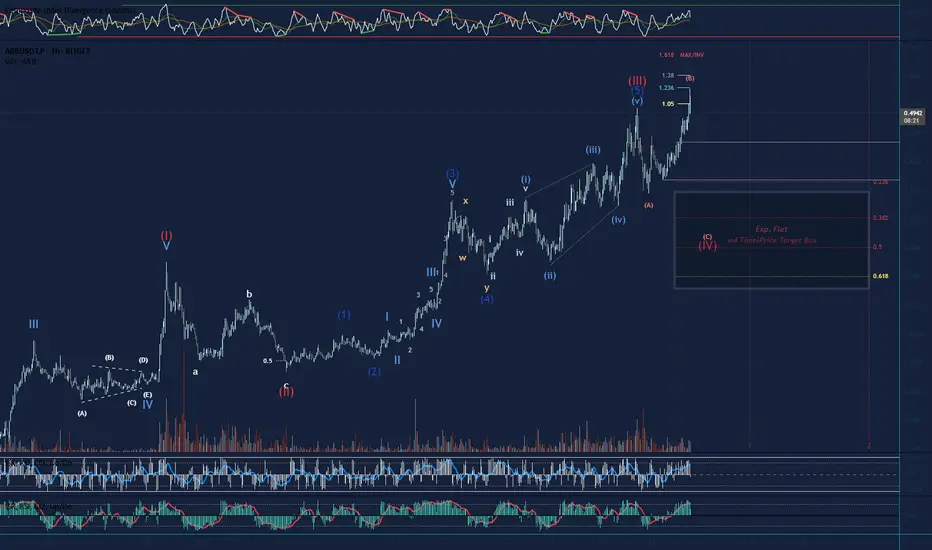
Looking to complete a wave 4 Retracement on Arbitrum Short term outlook is bearish as we are looking to complete an expanding flat to the downside. Wave B neared it invalidation, but reversed down. Lets see if the bears can push it down to the 0.5 Fib Target, soft target is the 0.382 Fib. If volume increases this could be a third up, but we need the wave 4 at the moment, and wave B of the expanding flat is a clear 3 waver so far. Long term we are still bullish with plenty of nested wave 3s to keep us counting to the upside in the future haha. Not Financial Advice
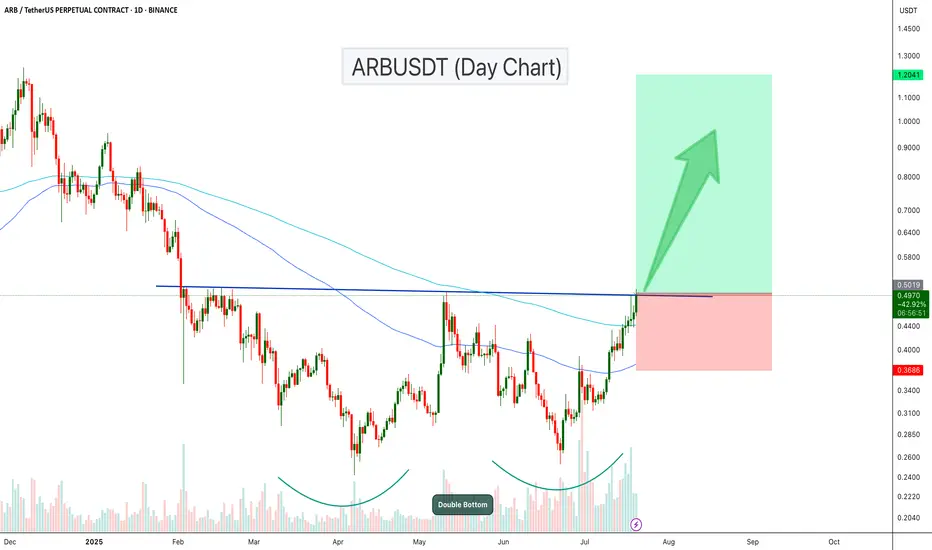
ARBUSDT Breaks Out of Double Bottom!ARB has formed a clear double bottom pattern on the daily chart, signaling a strong reversal structure. After multiple rejections, the price has now broken above the neckline resistance, confirming bullish momentum.
The breakout is also supported by increasing volume and a bullish crossover of the 100 and 200 EMA zones. If the current momentum holds, ARB could reach the target of $0.75- $1.20 level.
Altcoin Season loading?Arbitrum has broken out of the descending wedge, reclaimed the POC and is headed to higher levels. We went long at the breakout and stop loss has been placed at break even.
Not financial advice, do what’s best for you

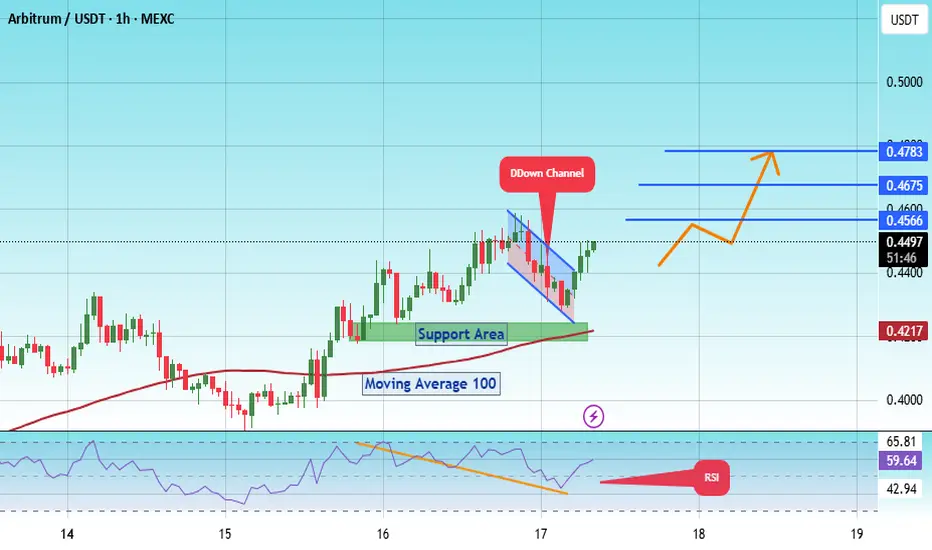
#ARB/USDT Arbitrum scalp long to $ 0.4783#ARB
The price is moving within a descending channel on the 1-hour frame, adhering well to it, and is poised to break it strongly upwards and retest it.
We have 0.4254 from the lower boundary of the descending channel. This support is at 0.0001500.
We have a downtrend on the RSI indicator that is about to be broken and retested, supporting the upward move.
There is a key support area in green at 0.4170, which represents a strong basis for the upward move.
Don't forget one simple thing: ease and capital.
When you reach the first target, save some money and then change your stop-loss order to an entry order.
For inquiries, please leave a comment.
We have a trend of stability above the Moving Average 100.
Entry price: 0.4484
First target: 0.4566
Second target: 0.4675
Third target: 0.4783
Don't forget one simple thing: ease and capital.
When you reach the first target, save some money and then change your stop-loss order to an entry order.
For inquiries, please leave a comment.
Thank you.
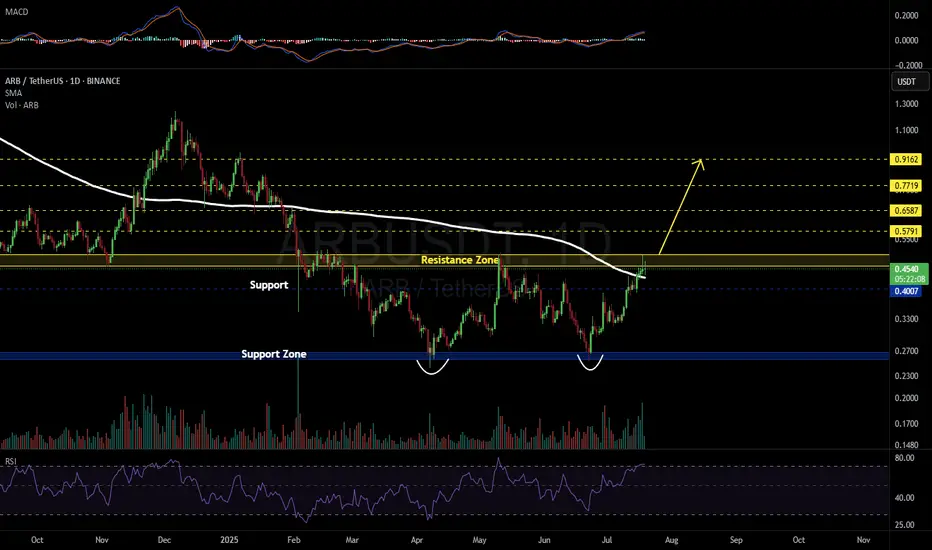
ARBUSDT 1D#ARB has formed a Double Bottom Pattern on the daily chart. This is a bullish pattern, and the price is currently moving above the daily SMA200. However, based on the RSI and other indicators, a pullback toward the support level at $0.4007 is possible. In any case, in the event of a breakout above the resistance zone, the targets are:
🎯 $0.5791
🎯 $0.6587
🎯 $0.7719
🎯 $0.9162
⚠️ Always use a tight stop-loss and apply proper risk management.
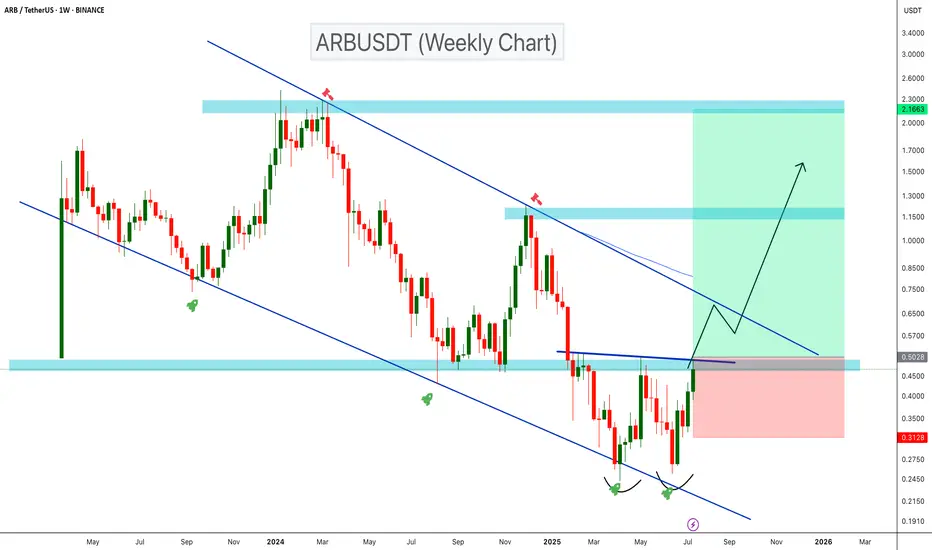
ARBUSDT Double Bottom Signals Bullish Reversal!ARBUSDT is showing a bullish reversal setup on the weekly timeframe after trading within a descending channel for over a year. A clear double bottom has formed near the channel’s lower support, and the price is now breaking above key resistance around $0.50. If this breakout holds, a move toward the upper resistance of the channel and potentially reach the ATH end of this bull run.
Cheers
Hexa
ARB/USDT – Weekly Breakout Setup!Hey Traders!
If you’re finding value in this analysis, smash that 👍 and hit Follow for high-accuracy trade setups that actually deliver!
Massive Falling Wedge Breakout in Play!
ARB just confirmed a breakout from a long-term falling wedge pattern on the weekly timeframe, which has historically been one of the most reliable bullish reversal structures in technical analysis.
🧠 Why this setup matters:
The falling wedge has been forming for over a year, indicating long-term accumulation and compression.
Price has clearly broken above the descending resistance, suggesting a potential shift in momentum.
The structure resembles previous explosive moves, and this could just be the start of a multi-month rally.
🟢 Trade Setup:
Entry: CMP ($0.49) & accumulate on any dips
Targets:
🎯 $0.85
🎯 $1.30
🎯 $2.10+ (Full wedge target)
Stop-loss: 🔴 Close below $0.30
Timeframe: Mid to long term (6–12 weeks or more)
🚀 Bullish Signals:
Weekly breakout candle with strong volume (confirmation pending close).
Market-wide sentiment is gradually turning, and ARB may become one of the leaders.
📌 Final Thoughts:
This is a high-conviction swing setup with a strong reward-to-risk ratio. Keep an eye on weekly close confirmation and market sentiment for better entries.
💬 Let me know your thoughts or if you’re riding this setup too!
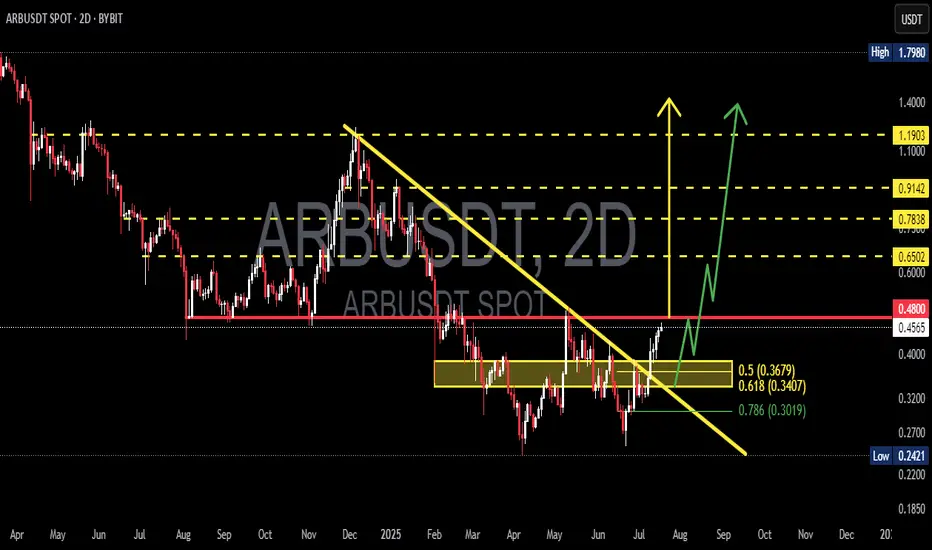
ARBUSDT Ready to Fly? Strong BreakoutARBUSDT has just completed one of its most critical technical phases in recent months — a clean breakout from a medium-term descending trendline that has been suppressing price since December 2024.
📌 Pattern and Price Structure Analysis:
🔹 Descending Trendline Breakout:
After months of downward pressure, ARBUSDT has finally broken above a long-standing trendline. This isn't just another breakout — it's a strong structural signal indicating a potential trend reversal.
🔹 Well-Defined Accumulation Zone:
A solid consolidation base formed between $0.30 - $0.37, highlighted in yellow, serving as a key demand zone. This area aligns perfectly with the Fibonacci retracement levels:
0.5 = $0.3679
0.618 = $0.3407
0.786 = $0.3019
This confluence of support suggests smart money accumulation before the breakout.
📈 Bullish Scenario (High Probability):
If price holds above the recent breakout zone ($0.45–$0.48), the bullish structure remains intact and a multi-level rally may unfold.
🎯 Bullish Targets:
1. First Target: $0.6502 — immediate horizontal resistance.
2. Key Target: $0.7838 — major resistance and previous rejection level.
3. Psychological Level: $0.9142 — pre-breakdown price zone.
4. Maximum Extension: $1.1903 — a potential target if a macro bullish wave develops.
📌 Look for higher lows (HL) and higher highs (HH) structure to confirm sustained bullish momentum.
📉 Bearish Scenario (If Breakout Fails):
A drop back below $0.45 would weaken the bullish outlook.
If the price slips below $0.3679 and loses the 0.618 Fib level at $0.3407, expect a deeper retracement toward:
$0.3019 (0.786 Fib level)
$0.2421 (previous macro low and key support)
🚨 Failure to hold the breakout level could trigger a bull trap, especially if accompanied by declining volume.
🧠 Additional Technical Notes:
Volume increased during the breakout, adding reliability to the move.
Potential formation of an inverse head and shoulders pattern within the base (still early but worth watching).
Momentum indicators like RSI and MACD (not shown) are likely to support the bullish breakout — watch for divergence confirmation.
🧭 Conclusion:
ARBUSDT stands at a critical juncture. The breakout from a long-standing downtrend coupled with a strong accumulation structure gives bulls a tactical edge. However, it must hold above key levels to sustain the momentum.
Smart traders may consider strategic entries on minor retracements while keeping risk in check below the golden pocket zone.
#ARBUSDT #CryptoBreakout #AltcoinReversal #TechnicalAnalysis
#BullishSetup #TrendlineBreakout #FibonacciLevels #CryptoTrading
#Altseason #CryptoSignals
#ARB/USDT Arbitrum scalp long to $ 0.4451#ARB
The price is moving within a descending channel on the 15-minute frame and is expected to break and continue upward.
We have a trend to stabilize above the 100 Moving Average once again.
We have a bearish trend on the RSI indicator, supporting the upward break.
We have a support area at the lower boundary of the channel at 0.4070, acting as strong support from which the price can rebound.
We have a major support area in green that pushed the price upward at 0.3970.
Entry price: 0.4160.
First target: 0.4300.
Second target: 0.4407.
Third target: 0.4451.
To manage risk, don't forget stop loss and capital management.
When you reach the first target, save some profits and then change the stop order to an entry order.
For inquiries, please comment.
Thank you.

ARB - Breakout will break the market- Arbitrum is one of the fundamentally strong token on ETH L2.
- After back to back crashes finally we are seeing some reversal from the bottom
- A breakout from the local resistance would push the arb price further, we need to wait till the breakout to enter the trade.
Entry Price: 0.5010 (after breakout)
StopLoss: 0.3169
TP1: 0.6300
TP2: 0.7698
TP3: 1.2297
TP4: 1.7566
TP5: 2.3943
Max Leverage: 5x
Don't forget to keep stoploss
Cheers
GreenCrypto
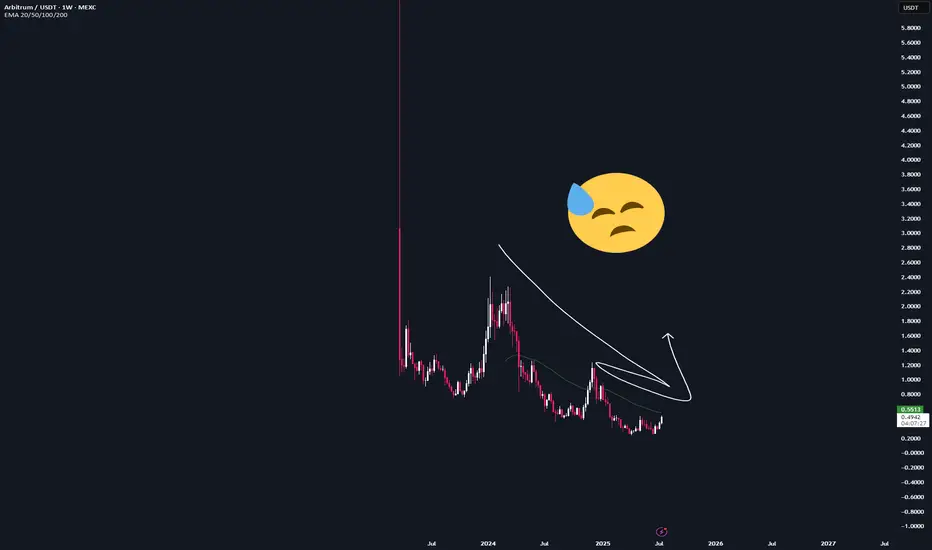
ARB (Arbitrum) Analysis – July 15, 2025After its listing on Binance, ARB has never revisited such low price levels.
Reaching the $0.25 zone has sparked a wave of new investors, confirmed by recent on-chain data.
It also seems that the correction pattern has completed, placing ARB in a strong position for a potential rebound.
📌 While a more conservative entry could be around $0.35,
this current level also offers strong justification for initiating a position.
🎯 Target: $0.90
🔼 That’s a potential upside of approximately 160%.
With proper risk management, this setup stands out as one of the more compelling opportunities in the current market.

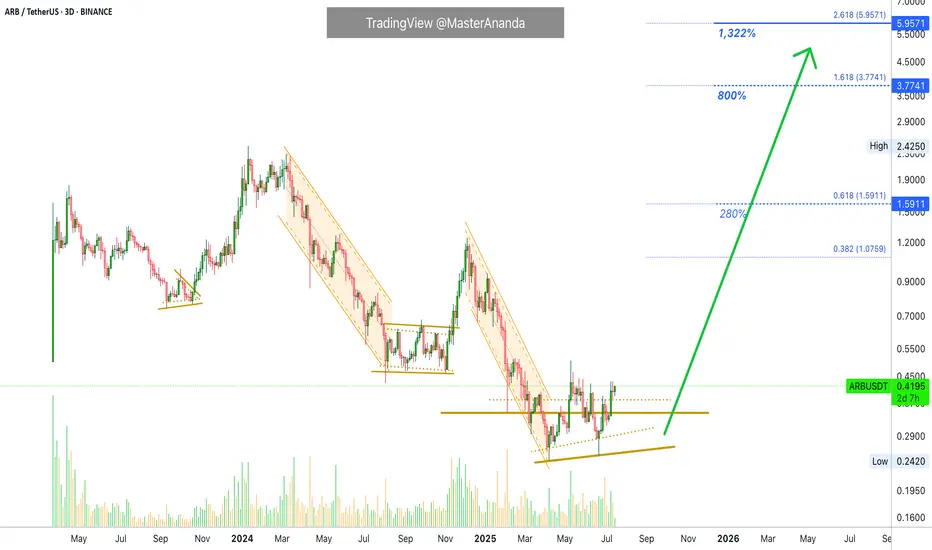
Arbitrum 1,322% Profits Potential · Easy · Crypto is Going Up!This will be intense, truly intense. Arbitrum will perform one of the strongest bullish waves in the entire market. Just one red session and we are back up, back green and ready to move. It will be huge.
This is a big project and yet, we have a standard, easy target, around 1,322%. Such huge potential for growth and there is no doubt now, 100% certainty; you can bet your house on it. We are going up.
When the market goes down, it is unforgiving, it gives no break. It goes down and down and down long-term.
When the market goes up, it is unforgiving, it gives no break. It goes up and up and up, many times higher and much more stronger than any previous bearish wave.
So the market is biased in favor of going up. Just as new all-time lows can be hit on a crash, new all-time highs will be hit during a major bullish impulse. Mark my words.
We are not talking about just "another bullish wave." Not just an "advance." We are talking about the strongest, biggest, longest, exciting and highly profitable bullish phase the Cryptocurrency market has yet to offer. We are talking about exceptional exponential growth. We are talking about a bull market like nothing you've seen before.
Get ready because Crypto is going up.
Namaste.
ARBArbitrum
Arbitrum is an EVM-compatible optimistic rollup blockchain platform built on top of Ethereum.
Everything is clear on the chart.
I wish everyone abundant profits.
Like and follow
for more.

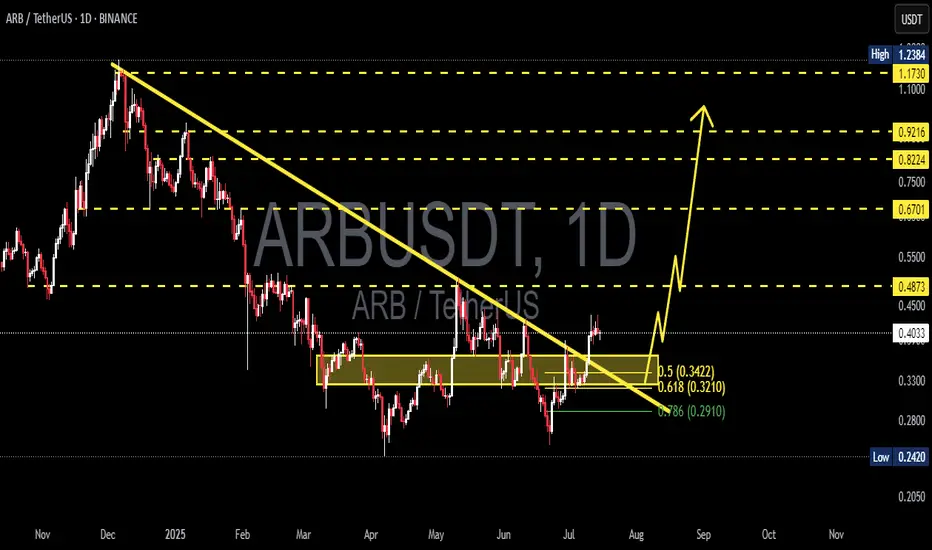
ARB/USDT Breaks Downtrend – Major Bullish Reversal in Play!📊 Technical Analysis (Daily Timeframe)
ARB has officially broken out of a long-standing descending trendline that has defined its downtrend since late 2024. This breakout, supported by strong demand at key Fibonacci levels, could be the start of a major bullish reversal.
🧠 Key Chart Patterns & Structure:
🔸 Descending Triangle Breakout
Originally viewed as bearish, this triangle has instead resolved to the upside — a rare but powerful bullish reversal signal when paired with growing volume and price compression near the breakout.
🔸 Fib Retracement Bounce
Price rebounded precisely from the 0.618 (0.3210) and 0.786 (0.2910) levels, confirming these zones as strong accumulation and liquidity areas.
🔸 Break & Retest Zone at 0.3422 – 0.3210
This golden zone will be key for confirming the breakout. A successful retest here sets the stage for the next leg up.
🔸 Bullish Price Structure Formation
A potential higher low and higher high formation is beginning, which would fully confirm the shift from bearish to bullish market structure.
🟢 Bullish Scenario (High Probability)
If the breakout is validated with a successful retest of the zone:
✅ Short-term Targets:
0.4873 — First major resistance
0.6701 — Mid-range zone with historical confluence
🚀 Mid to Long-Term Targets:
0.8224
0.9216
1.1730
1.2384 — Full recovery back to former highs
🔼 These zones align with Fibonacci extensions and historical resistance areas. Bull momentum can accelerate quickly due to short covering and new buyers entering.
🔴 Bearish Scenario (Invalidation Level)
If price fails to hold above 0.3210, the bullish setup is invalidated short-term:
Breakdown could revisit 0.2910 (Fib 0.786 support)
Below that: full retrace to the December–March demand base at 0.2420
🛑 Key Invalidation Level: Break below 0.3210 with strong selling pressure.
📌 Strategic Summary
ARB has broken its macro downtrend, signaling the start of a new phase.
Holding above the golden pocket zone (0.3210–0.3422) is critical for continuation.
Targets above 0.9–1.2 are realistic if the market sustains its momentum.
Monitor volume and RSI for further confirmation of bullish strength.
🔍 Traders Note:
This setup reflects an ideal blend of trend reversal, Fibonacci support, and breakout confirmation — a textbook setup for swing and positional traders aiming for medium-term upside.
#ARB #ARBUSDT #BreakoutAlert #CryptoTA #TrendReversal #BullishSetup #TechnicalAnalysis #CryptoTrading #FibonacciLevels #DescendingTriangle #AltcoinBreakoutl