Price Entered Range — Move Toward Upper Boundary ExpectedPrice has entered a clearly defined trading range (corridor). The lower boundary of this range is acting as strong support, where buyers are consistently stepping in.
As long as price holds above this support zone, the market structure favors a move toward the upper boundary of the range.
🔼 Bullish scenario:
– Holding above the lower range support
– Continuation toward the top of the corridor
– Long target: 🎯 $0.08
The lower boundary remains a key invalidation level. A breakdown below support would invalidate the bullish range scenario, but while price stays inside the corridor, upward continuation is the higher-probability outcome.
Market insights

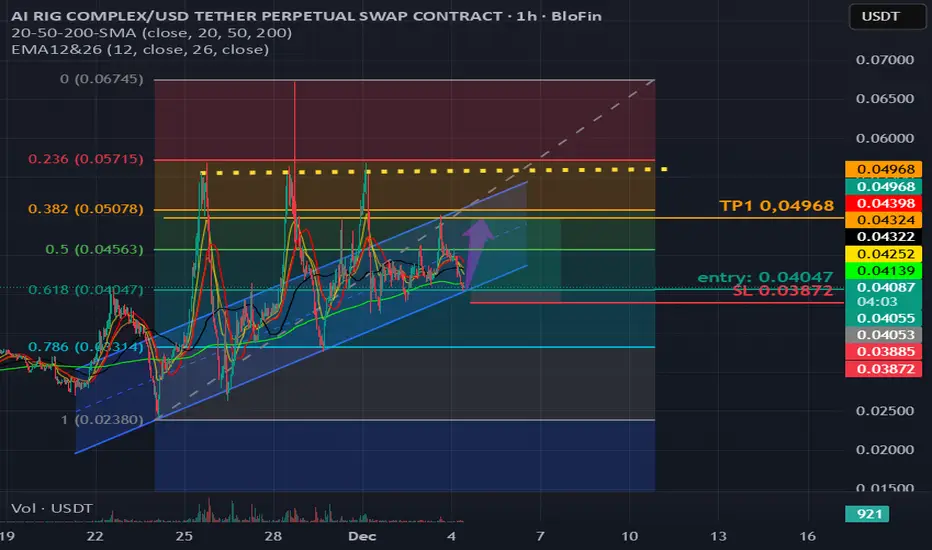
ARC/USDT on 1 hour timeframe upwards potentialThe price is hovering just above the 0.618 Fibonacci retracement level (0.04047), which is often seen as a strong support zone in bullish setups
Entry: 0.04047
Stop Loss (SL): 0.03872 (below support zone)
Take Profit (TP1): 0.04968 (near 0.382 retracement)
Risk/Reward Ratio: Favorable, assuming bounce from 0.618 level
This setup suggests a bullish reversal expectation, with a tight stop and a target near the next resistance
Arc Correction - ShortAttempting a Short here at Resistance targeting the POC across these recent swings.


ARC Buy/Long Insight (4H)The ARC structure has gained strong bullish momentum after the main CH, and continuous bullish BOS can be seen on the chart.
After the liquidity sweep, the price has moved upward again. By tracking the structure, it becomes clear that the price is aiming to reach the higher-timeframe supply zones, and we are looking for buy/long positions at the origin zones.
The entry zone, stop, and targets are marked on the chart.
Do not enter the position without capital management and stop setting
Comment if you have any questions
thank you

ARCUSDT Trading Idea.Likely a reversal to the downside.
📍Probable Entries
📌 $0.23947
📌 $0.15754
📈 The preferred position should be a short position.
Trade safe and smart
ARC BOTTOMED OUTPrice more than 90% down in past few months but technicals showing bullish reversal now. Use Proper risk management as it's highly risky

ARCUSDT.PTESTING D WATERS ON NEW TECHNIQUE……
Been too long away from D market but A skill can never leave THEE when YOU sync In….

ARC - READY TO MOON ?? Im still holding LSE:ARC and it's likely to explode soon; here's why:
📈Multi month wedge
📈Strong buy volume (weekly) |accumulation]
📈Bullish pennant
Moonshot incoming soon?

ARCUSDT - Bullish Breakout Confirmed ARC has been trading in a well-defined descending channel for several weeks, forming a consistent downtrend. However, the price has now broken out of the channel resistance, signaling a potential bullish reversal.
Descending Channel Breakout: ARC has clearly broken above the channel’s upper trendline, indicating a shift in market structure from bearish to bullish.
Resistance Zone Flipped: The price broke through a recent horizontal resistance zone.
EMA: ARC is now trading above both the 50 EMA and 100 EMA,

$ARC - Long SetupBITGET:ARCUSDT | 1D
We can risk on cmp but leave something for dca if it dips a bit around .060 to .056
If we can hold .060 to .056, we can target .068 (initial) to .16 (final)
Stoploss just below .05 to .047
Targets:
.068 - .076
.090 - .106
.132 - .162

Retest long on $ARCA speculative play as honestly i think this coin is worthless.
Have been observing this coin for quite some time after shorting it from 20c, it did found a bottom and now after moving up and breaking out, its time to make a TA play and long the retest of the breakout.

ARCUSDT LONG IDEAhi all. when we look at the arcusdt chart, we can see that price dropped hard in the last two weeks. it seems that price trying to recover. EMA breakout on 1h chart almost happened. also price seems accumulating in the box.i expect price at least touches 50 EMA on 4h timeframe chart. so we can setup long position ;
entry : 0.06366
stop : 0.05895
target: 0.07500 (50 EMA on 4h timeframe)

#ARCUSDT is showing signs of reversal📉 Short BYBIT:ARCUSDT.P from $0.06780
🛡 Stop loss $0.07117
🕒 1H Timeframe
⚡️ Overview:
➡️ The main POC (Point of Control) is at 0.05873, indicating the area with the highest trading volume.
➡️ The 0.07117 level acts as strong resistance where the price previously reversed.
➡️ The chart shows a potential topping structure followed by a decline.
➡️ Volume concentration between $0.065 and $0.06210 suggests key zones for potential profit-taking.
🎯 TP Targets:
💎 TP 1: $0.06510
💎 TP 2: $0.06210
💎 TP 3: $0.06050
📢 Watch the key levels and enter after confirmation!
📢 The price has already started to move down — downside momentum remains strong.
📢 The TP levels are near a previous consolidation zone, allowing quick target execution.
BYBIT:ARCUSDT.P is showing signs of reversal — considering shorts with clear downside targets!

Potential Head and Shoulders Pattern on ARCSOL/USDTTimeframe: 1H | Exchange: MEXC
Date: March 23, 2025
Hey traders! 👋
Spotted a possible Head and Shoulders pattern forming on ARCSOL/USDT. 👀
Left Shoulder: Around 0.0503
Head: Bottomed out at 0.0415
Right Shoulder: Currently forming near 0.0471
This pattern is typically a bearish reversal signal, especially after an uptrend — which we’ve seen over the past few days. If price breaks below the neckline (around the 0.047 region), we could see further downside. 📉
🧩 Supporting indicators:
Momentum indicators are cooling off
Stochastic RSI is showing potential for a downtrend continuation
Bearish divergence on oscillators
Volume declining on the right shoulder — a classic sign 👌
🚨 Key levels to watch:
Neckline support: ~0.047
Breakout target (if confirmed): ~0.038–0.040 zone
Invalidation: Break above 0.055 with strong volume
Not financial advice — just sharing what I see. Stay sharp and manage risk! 🛡️
What’s your take? Comment below! 💬
#ARCSOL #USDT #CryptoTrading #HeadAndShoulders #ChartAnalysis #TechnicalAnalysis #CryptoTA #TradingView

Inverse Head & Shoulders Pattern on ARCSOL/USDTChart Timeframe: 1H | Exchange: MEXC
📅 March 23, 2025
This setup is looking textbook bullish! A clean Inverse Head and Shoulders has printed, backed by volume and momentum confluence.
📐 Pattern Anatomy:
Left Shoulder: ~$0.0503
Head (Major Low): ~$0.0415
Right Shoulder: ~$0.0471
Neckline Breakout Zone: ~$0.055
Measured Target: $0.098 USDT
✅ Pattern Confirmations:
Broke downtrend with bullish divergence
Volume spike on neckline test
Laguerre + Cipher confirming upward momentum
Bullish market structure shift post right shoulder
Falling wedge breakout led into head formation — added confluence 🔥
💥 Next Steps:
Watch for support confirmation at $0.055 — a retest with bounce would be ideal before targeting the full move to $0.098.
🎯 Potential Trade Setup (not financial advice):
Entry: Break & retest of neckline
TP: $0.098
SL: Below right shoulder ~$0.0465
This is a powerful reversal signal after a prolonged downtrend — eyes on volume and momentum follow-through.
What do you think? Is this the start of a major shift for $ARCSOL?
👇 Drop your analysis in the comments!
#ARCSOL #InverseHeadAndShoulders #CryptoBreakout #AltcoinSeason #TA #CryptoCharts #TradingView #ReversalSetup

ARC ANALYSIS🔮 #ARC Analysis
💲💲 #ARC is trading in a Symmetrical Triangle Pattern. If the price of #ARC breaks and sustain the higher price then will see a pump. Also there is an strong support zone. We may see a retest towards the support zone first and then a reversal📈
⁉️ What to do?
- We have marked crucial levels in the chart . We can trade according to the chart and make some profits. 🚀
#ARC #Cryptocurrency #Support #Resistance #DYOR

ARC/USDT - Elliott Wave Completion and ABC Correction ExpectedThe ARC/USDT perpetual contract on Binance has completed a classic 5-wave Elliott impulse pattern, peaking at wave (5). Based on Elliott Wave Theory, a corrective ABC pattern is expected, with wave A initiating a decline.
Entry: Short position near wave (5) peak
Target: Wave C completion zone around 0.056
Stop Loss: Above recent high near 0.0817
The retracement aligns with Fibonacci levels and prior support zones, suggesting a potential pullback before further trend continuation. Manage risk accordingly.

Bullish pattern signalThere is a short-term bullish pattern forming, indicating a potential profit target of 2% upon reaching it. It's important to closely monitor the liquidity in the market, as fluctuations could impact price movement significantly. Keep an eye on trading volumes and support levels to gauge the strength of this bullish signal.
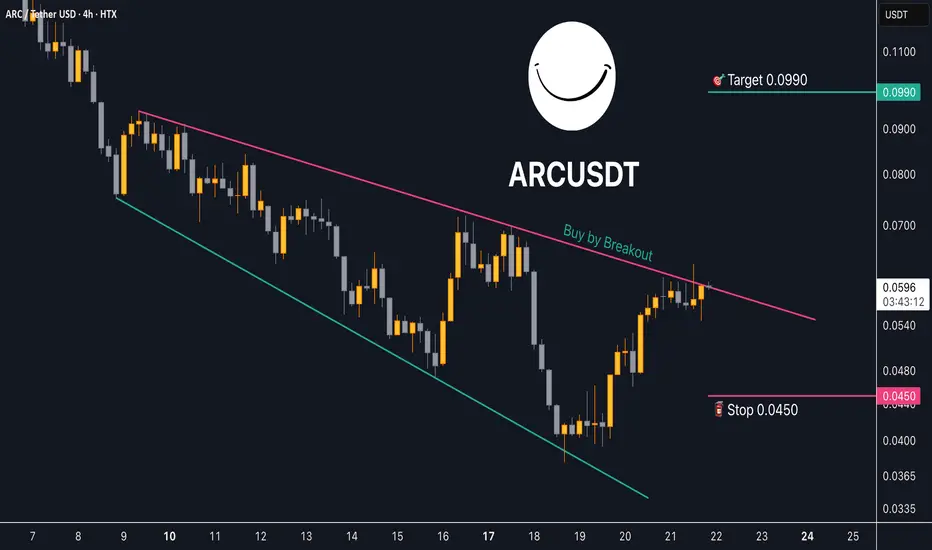
Trading opportunity for AI Rig Complex ARCUSDTBased on technical factors there is a Buy position in :
📊 ARCUSDT
🔵 Buy Now
🪫Stop loss 0.0450
🔋Target 0.0990
📏 R/R 2,7
💸RISK : 1%
We hope it is profitable for you ❤️
Please support our activity with your likes👍 and comments📝
Trading opportunity for ARCUSDTBased on technical factors there is a Buy position in :
📊 ARCUSDT
🔵 Buy Now
🪫Stop loss 0.0310
🔋Target 0.0600
📏 R/R 1,8
💸RISK : 1%
We hope it is profitable for you ❤️
Please support our activity with your likes👍 and comments📝

Nothing fancy bidding supp/demand zone Got front runned 2 times on this so lets see
trade chances are likely to hit sl cuz of this massive move down on both arcsol and following btc
lets see

Bullish Opportunity in ARC (Binance Futures)1. We have structure of the parent model 22
2. We have a run on buyside within the H1 discount lows
3. We have buyside to attack
