Arkm possible bull market targets.Possible bull market targets and invalidation level. It is obvious that prices have been moving within this channel so far.
* The purpose of my graphic drawings is purely educational.
* What i write here is not an investment advice. Please do your own research before investing in any asset.
* Neve

High Risk, High Reward altcoinCaught the low on the daily, beautiful reaction to the upside with plenty of room to rip. Possible end of the altcoin bear market, I think this altcoin is primed for a massive run.

#ARKM/USDT#ARKM
The price is moving within a descending channel on the 1-hour frame, adhering well to it, and is heading for a strong breakout and retest.
We are seeing a bounce from the lower boundary of the descending channel, which is support at 0.612.
We have a downtrend on the RSI indicator that is ab

ARKMUSDT 1D#ARKM has formed an inverse head & shoulders pattern on the daily chart. In case of a breakout above the neckline and the daily EMA100, a 2x bullish rally is expected. Targets are:
🎯 $0.796
🎯 $0.892
🎯 $1.028
🎯 $1.201
⚠️ Use a tight stop-loss.

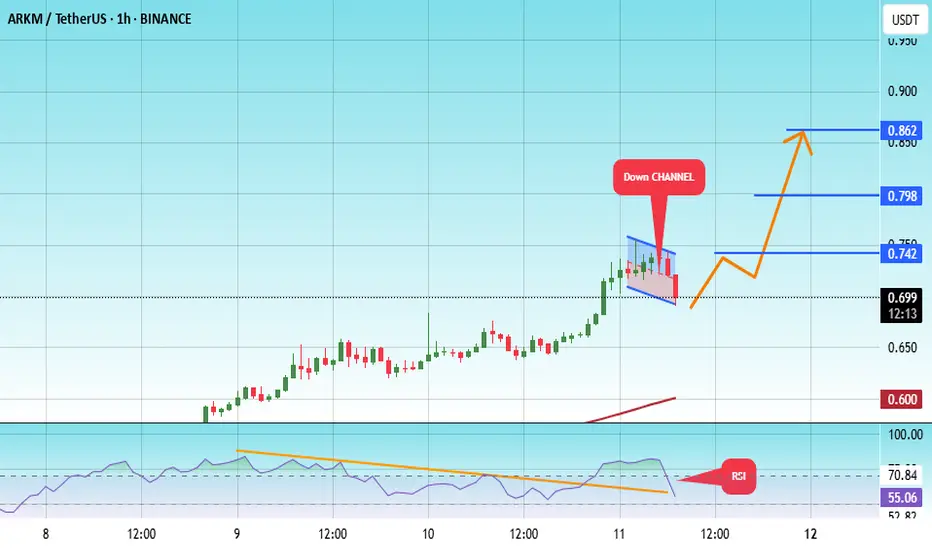
#ARKM/USDT#ARKM
The price is moving within a descending channel on the 1-hour frame, adhering well to it, and is heading for a strong breakout and retest.
We are seeing a bounce from the lower boundary of the descending channel, which is support at 0.690.
We have a downtrend on the RSI indicator that is abo
Arkm near term.Possible near term scenarios.
* The purpose of my graphic drawings is purely educational.
* What i write here is not an investment advice. Please do your own research before investing in any asset.
* Never take my personal opinions as investment advice, you may lose your money.

ARKMUSDT | Long Setup | Potential Squeeze | (May 2025)ARKMUSDT | Long Setup | Potential Squeeze on High OI | (May 2025)
1️⃣ Insight Summary:
ARKM is showing signs of potential overleveraged positions building up. While this isn't a high-conviction trade, it could turn into a short squeeze play if key levels hold and open interest continues to rise.
2

ARKM Testing Key Resistance – What’s Next?🔥 ARKM Resistance Alert
📊 ARKM is currently testing a crucial resistance level around $0.74—price action here is key! 🚨
🎯 Watch for a potential breakout or rejection at this level to determine the next move.
⚠️ This is a critical zone—pay attention to how price reacts.
👀 Keep ARKM on your radar—

ARKM potentials pump 50%Successfully breakout this resistant line with a short -term target of at least +10%

Manipulative shitcoin Arkmibb.co
Nice work from GSR market maker)
2,2m arkm tokens was sold in 3 minutes)
While every shitcoin and noname memes trying to grow,this "top on-chain garbage" is manipulating,lmao
Chek transactions on Arkham Intel)
Its everything will be in X)
And now everything becoms clear,why arkm looks

See all ideas
Summarizing what the indicators are suggesting.
Oscillators
Neutral
SellBuy
Strong sellStrong buy
Strong sellSellNeutralBuyStrong buy
Oscillators
Neutral
SellBuy
Strong sellStrong buy
Strong sellSellNeutralBuyStrong buy
Summary
Neutral
SellBuy
Strong sellStrong buy
Strong sellSellNeutralBuyStrong buy
Summary
Neutral
SellBuy
Strong sellStrong buy
Strong sellSellNeutralBuyStrong buy
Summary
Neutral
SellBuy
Strong sellStrong buy
Strong sellSellNeutralBuyStrong buy
Moving Averages
Neutral
SellBuy
Strong sellStrong buy
Strong sellSellNeutralBuyStrong buy
Moving Averages
Neutral
SellBuy
Strong sellStrong buy
Strong sellSellNeutralBuyStrong buy
Displays a symbol's price movements over previous years to identify recurring trends.