ARUSDT Gearing Up for a Powerful Wave 3 LaunhARUSDT has completed its corrective phase via a well defined ending diagonal, followed by a strong impulsive move completing wave 1. Price recently tested a significant supply zone, leading to a sharp retracement toward $4.48, aligning with the previous bottom structure.
This zone is projected to f

#AR/USDT Gearing Up for a Powerful Wave 3 Launh#AR
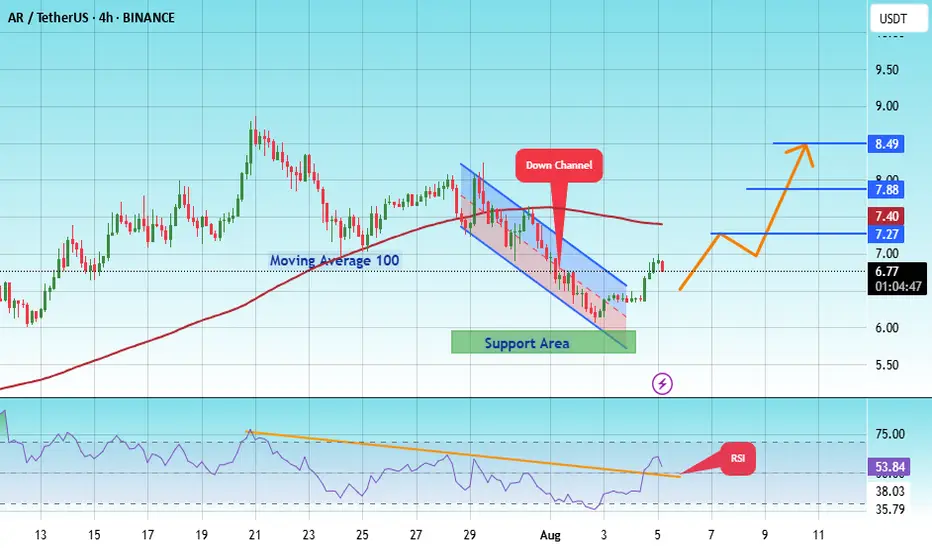
The price is moving within an ascending channel on the 1-hour frame, adhering well to it, and is on its way to breaking strongly upwards and retesting it.
We have support from the lower boundary of the ascending channel, at 5.50.
We have a downtrend on the RSI that is about to break and retes
AR SHORT SET UPMost Probable Sniper Trade Setup for AR/USDT (4H)
Analysis as of current 4H chart provided — Objective, Unbiased, Based on Structure & Momentum
🔍 Trend Context
Macro Bias (4H): Bullish recovery after a strong retracement.
VIDYA Trend Bands: Price reclaimed below-band zone, pushing into mid-band re

ARUSDT: Crypto Summer Game PlanBINANCE:ARUSDT
RWA + AI coin, two narratives that will be hot
Not inflationary, 99% supply circulating
People really use it for permanent storage
Main CEX liquidity is very thin in AR -> possible God candles like in previous history
Possible supply shock at late stage
Main risk is c

ARusdtThis currency is in a good position, has good liquidity, and can move towards the desired targets. The short-term targets are $10 and $16, and the long-term target is $20.

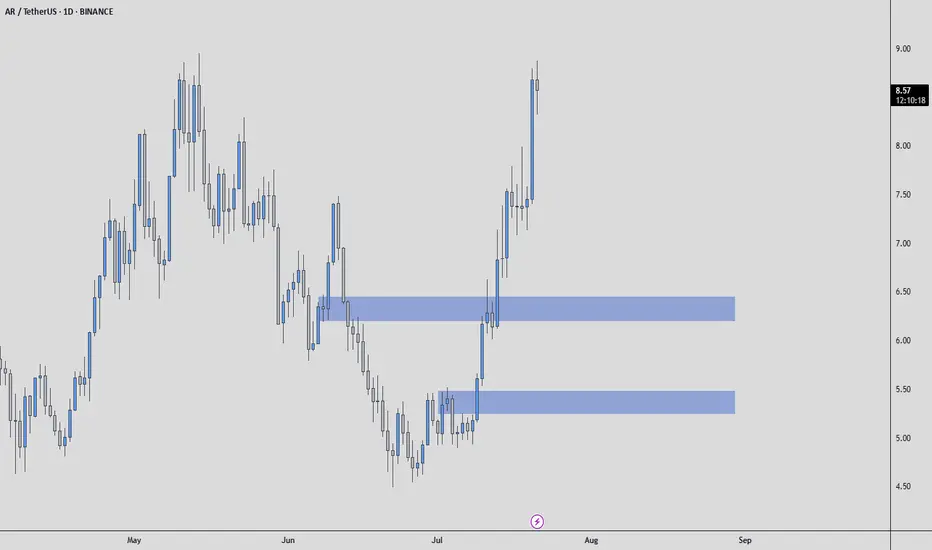
ARUSDT Mid-Term AnalysisIt made a nice rise, but I’m waiting for price in the blue boxes I’ve marked.
I won’t chase it at high prices.
If price comes to my levels, I’ll watch for:
✅ Footprint absorption
✅ CDV support
✅ Structure reclaim
If these align, I’ll consider a trade with clear risk. If not, I’m fine staying out
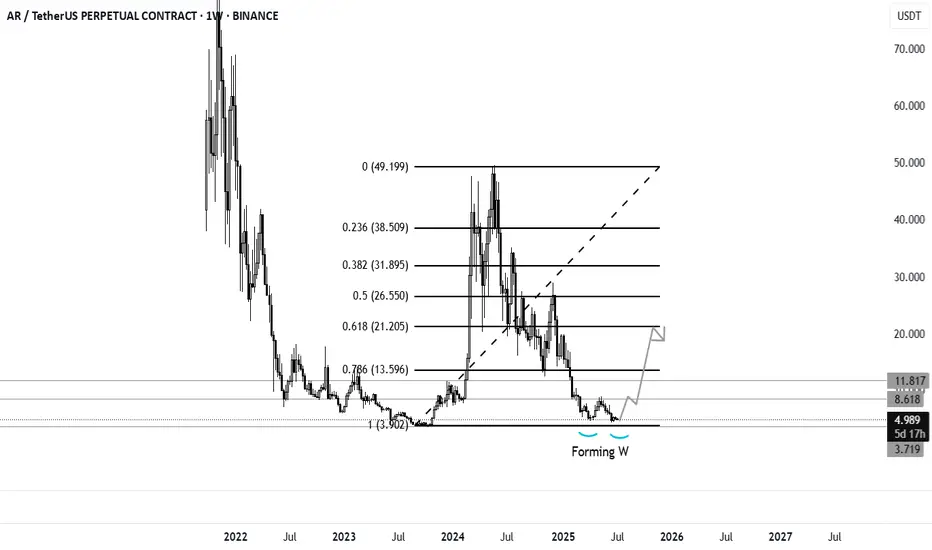
AR forming W. Good news for long term till OCTSimilar to my ARKM analysis both charts are very much similar. AR will be growing till OCT 2025.
Keep it simple and long term.
ARUSDT Forming Descending ChannelARUSDT is showing a promising setup as it begins to break out of a clear descending channel pattern on the daily timeframe. The current chart indicates strong potential for a bullish reversal, with price action approaching key breakout levels supported by healthy trading volume. This technical forma

Guys don't joke, this is about to explode don't hunt -10%Guys don't try to catch lows, its ripe to explode literally any second.
People are aware coin will survive no matter the FUD.
People are aware this is primed for 500$-600$ price peakings.

AR Looks Bullish (1D)The AR symbol appears to be completing a double corrective pattern | the first part being a plapyonic diametric and the second part a flat. The green zone represents a demand area that could potentially push the price upward. Note that this type of setup is generally safer for spot trading, while fu

See all ideas
Summarizing what the indicators are suggesting.
Oscillators
Neutral
SellBuy
Strong sellStrong buy
Strong sellSellNeutralBuyStrong buy
Oscillators
Neutral
SellBuy
Strong sellStrong buy
Strong sellSellNeutralBuyStrong buy
Summary
Neutral
SellBuy
Strong sellStrong buy
Strong sellSellNeutralBuyStrong buy
Summary
Neutral
SellBuy
Strong sellStrong buy
Strong sellSellNeutralBuyStrong buy
Summary
Neutral
SellBuy
Strong sellStrong buy
Strong sellSellNeutralBuyStrong buy
Moving Averages
Neutral
SellBuy
Strong sellStrong buy
Strong sellSellNeutralBuyStrong buy
Moving Averages
Neutral
SellBuy
Strong sellStrong buy
Strong sellSellNeutralBuyStrong buy
Displays a symbol's price movements over previous years to identify recurring trends.