ARUSDT Gearing Up for a Powerful Wave 3 LaunhARUSDT has completed its corrective phase via a well defined ending diagonal, followed by a strong impulsive move completing wave 1. Price recently tested a significant supply zone, leading to a sharp retracement toward $4.48, aligning with the previous bottom structure.
This zone is projected to form the immediate base, and our plan is to accumulate within this range, targeting the anticipated wave iii, historically known as the strongest and most extended move in the Elliott Wave sequence.
The entry plan and potential targets are clearly outlined on the chart. Feel free to share your view.
ARUSDT.P trade ideas

#AR/USDT Gearing Up for a Powerful Wave 3 Launh#AR
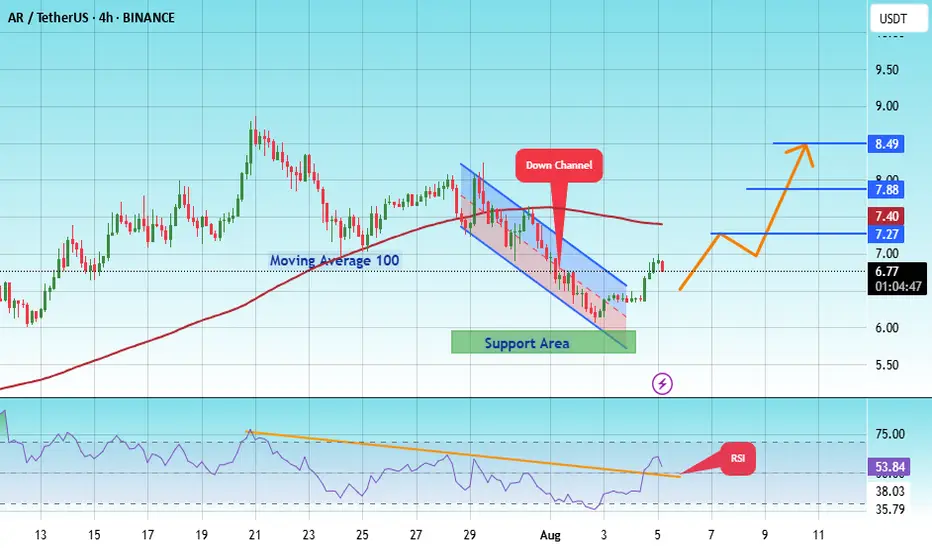
The price is moving within an ascending channel on the 1-hour frame, adhering well to it, and is on its way to breaking strongly upwards and retesting it.
We have support from the lower boundary of the ascending channel, at 5.50.
We have a downtrend on the RSI that is about to break and retest, supporting the upside.
There is a major support area in green at 5.90, which represents a strong basis for the upside.
Don't forget a simple thing: ease and capital.
When you reach the first target, save some money and then change your stop-loss order to an entry order.
For inquiries, please leave a comment.
We have a trend to hold above the 100 Moving Average.
Entry price: 6.80.
First target: 7.27.
Second target: 7.88.
Third target: 8.50.
Don't forget a simple thing: ease and capital.
When you reach your first target, save some money and then change your stop-loss order to an entry order.
For inquiries, please leave a comment.
Thank you.
AR SHORT SET UPMost Probable Sniper Trade Setup for AR/USDT (4H)
Analysis as of current 4H chart provided — Objective, Unbiased, Based on Structure & Momentum
🔍 Trend Context
Macro Bias (4H): Bullish recovery after a strong retracement.
VIDYA Trend Bands: Price reclaimed below-band zone, pushing into mid-band region, signaling potential mean reversion.
Fib Pullback: Price bounced around the 50% zone of last impulse.
Volume Delta Cluster: Noted bearish cluster at ~8.20–8.50, showing previous aggressive selling; currently being retested.
📉 Bearish Setup – Most Probable Trade
(Short-biased mean-rejection trade from supply zone)
Sniper Entry Zone:
🔺 $8.12–$8.30
(Upper bound of local supply zone + previous delta volume resistance)
Stop Loss:
🔻 $8.57
(Above local wick high / invalidation zone with previous selling momentum)
TP1 Range:
✅ $7.45–$7.20
(Mid-band reversion + minor support cluster and last bullish fair value gap area)
TP2 Range (Extended):
✅ $6.80–$6.60
(Deep liquidity zone + fib golden pocket & consolidation shelf)
Estimated Duration:
⏱ 1.5–3 days for TP1
⏱ 4–5 days for TP2 (if breakdown continues with momentum)
🎯 Confluence Factors:
Stoch RSI is overbought on 4H and starting to curve down → early signal for weakness.
Price retesting prior sell zone with visible volume node (~$8.20–8.40).
Broad structure shows lower highs forming post 9.00 rejection — potential for short-term pullback even within macro bullish context.
⚠️ Alternative Scenario (Invalidation & Flip Long):
If price closes a 4H candle above $8.60 with momentum and volume >3M delta, setup flips to bullish breakout with targets at $9.10 → $9.80.
✅ Summary:
Most Probable Setup: Bearish mean-rejection short
Entry: $8.12–8.30
SL: $8.57
TP1: $7.45–7.20
TP2: $6.80–6.60
Confidence: High (based on overbought + structure + prior supply re-test)
Let me know if you want this adapted to your 12x leverage sniper compounding model.

ARusdtThis currency is in a good position, has good liquidity, and can move towards the desired targets. The short-term targets are $10 and $16, and the long-term target is $20.

ARUSDT: Crypto Summer Game PlanBINANCE:ARUSDT
RWA + AI coin, two narratives that will be hot
Not inflationary, 99% supply circulating
People really use it for permanent storage
Main CEX liquidity is very thin in AR -> possible God candles like in previous history
Possible supply shock at late stage
Main risk is community governance and hacks. Otherwise in case of altseason this should meet the marked targets. Preferable accumulation zone is <5 USD, most probably not available anymore.

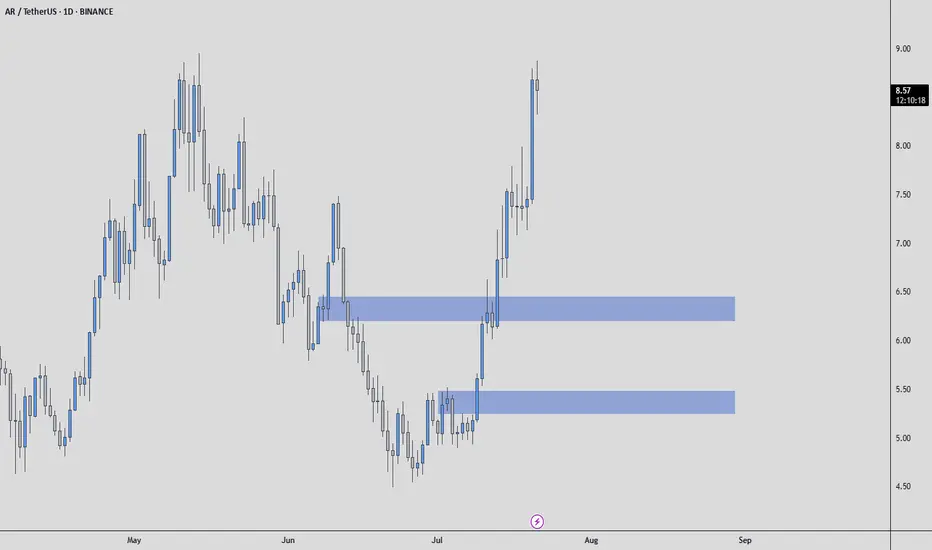
ARUSDT Mid-Term AnalysisIt made a nice rise, but I’m waiting for price in the blue boxes I’ve marked.
I won’t chase it at high prices.
If price comes to my levels, I’ll watch for:
✅ Footprint absorption
✅ CDV support
✅ Structure reclaim
If these align, I’ll consider a trade with clear risk. If not, I’m fine staying out.
Patience over chasing. The right price, or no trade.
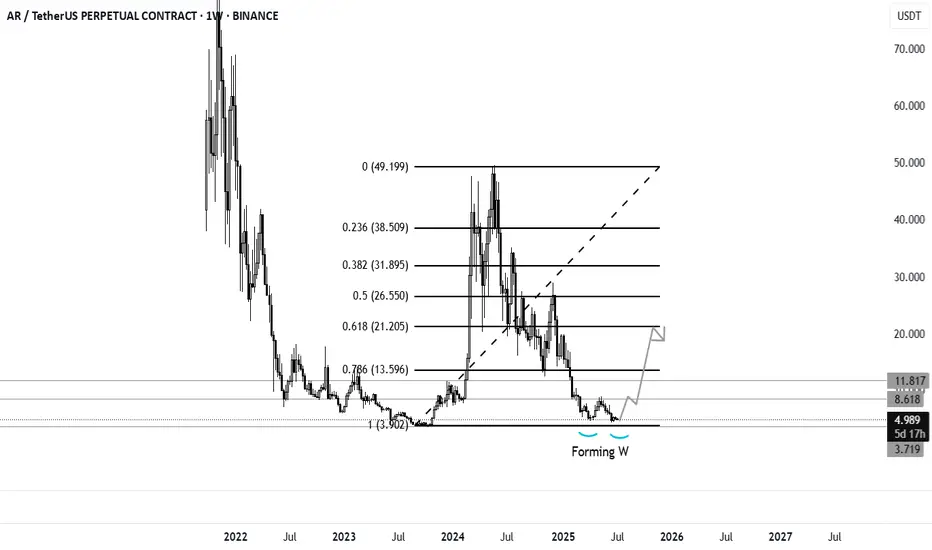
AR forming W. Good news for long term till OCTSimilar to my ARKM analysis both charts are very much similar. AR will be growing till OCT 2025.
Keep it simple and long term.
ARUSDT Forming Descending ChannelARUSDT is showing a promising setup as it begins to break out of a clear descending channel pattern on the daily timeframe. The current chart indicates strong potential for a bullish reversal, with price action approaching key breakout levels supported by healthy trading volume. This technical formation suggests that buyers are starting to regain control after an extended correction, making ARUSDT one to watch closely for the next big move.
With a projected gain of around 90% to 100%+, the risk-to-reward ratio for ARUSDT looks highly favorable. This setup aligns well with broader market sentiment, where investors are rotating back into altcoins that show strong recovery potential. As ARUSDT pushes against the upper trendline of its channel, confirmation of a breakout could lead to a powerful rally that targets previous highs, giving traders a clear upside objective.
In addition to the technical pattern, the volume profile for ARUSDT remains supportive, indicating growing investor interest and participation. This surge in trading activity often precedes sustained moves, as more market participants add to positions once key resistance levels flip to support. The combination of strong volume and a bullish channel breakout is a classic setup for momentum traders.
Overall, ARUSDT stands out as a well-positioned crypto pair for traders looking to capture a mid-term trend reversal. Keeping an eye on breakout confirmation and subsequent retests will be key for maximizing profit potential. With momentum building, this pair could deliver significant returns in the coming weeks if market conditions stay supportive.
✅ Show your support by hitting the like button and
✅ Leaving a comment below! (What is You opinion about this Coin)
Your feedback and engagement keep me inspired to share more insightful market analysis with you!

Guys don't joke, this is about to explode don't hunt -10%Guys don't try to catch lows, its ripe to explode literally any second.
People are aware coin will survive no matter the FUD.
People are aware this is primed for 500$-600$ price peakings.

AR Looks Bullish (1D)The AR symbol appears to be completing a double corrective pattern | the first part being a plapyonic diametric and the second part a flat. The green zone represents a demand area that could potentially push the price upward. Note that this type of setup is generally safer for spot trading, while futures trading would require more precise entry levels.
Targets are marked on the chart.
A daily candle closing below the invalidation level will invalidate this analysis.
For risk management, please don't forget stop loss and capital management
Comment if you have any questions
Thank You

Arweave—Bullish Bias Confirmed (Altcoins Bull Market As Promise)Three weeks ago I told you a very strong bullish wave was approaching the altcoins market. It is here, confirmed. The rest is just too easy...
Tell me... Can you see this?
Tell me you can see this. I know you can.
Tell me you can see the end of a correction, the bearish wave.
On the 5th of June the market was supposed to move up. It started up and went up for five days. 11-June produced a major crash rather than a bullish continuation... Surprise! but the market never moves straight down, this was the final leg down; the bottom is in, we can change trend now.
Technically speaking, the 7-April bottom-low holds. We have a double-bottom situation.
The low in April led to growth. This time around we have a slightly lower low with a bullish signal coming from the last candle that closed, a reversal candle. We also have a bullish chart pattern and marketwide action; it is very early of course. I am always early because I look 24-7 at the charts.
We have first a bottom and then a double-bottom after a little more than two months. This is it. Bear volume continues to drop and has been dropping since late 2024. This means that the bearish force has been exhausted, fully exhausted. Even the latest low yesterday has lower volume than the previous lows.
This is it. The bullish bias is now fully confirmed.
We won't have to wait long. It will be clear based on price action.
Thanks a lot for your continued support.
Namaste.

ARUSDT 5D AnalysisAR ~ 5D Analysis
#AR This is the lowest support for now. Buy back from here with a short term target of at least 15%++ from this support.

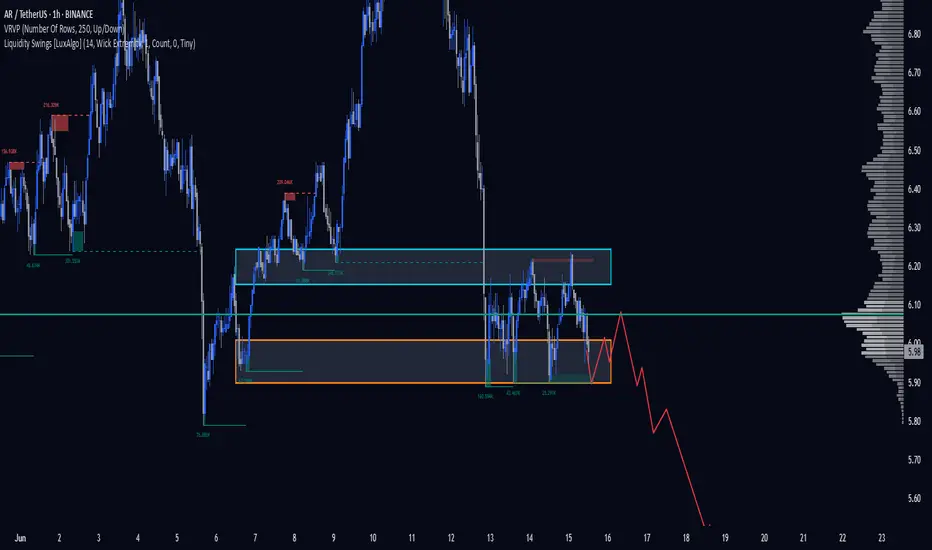
AR 1H. $5.90 Is the Last Line of Defense. 06/15/25BINANCE:ARUSDT If we fail to hold the $5.90 level, this asset could crash hard — potentially entering a deeper downtrend.
DYOR.
AR - Super Bullish LONG SET-UPBINANCE:ARUSDT
2️⃣ 𝐀𝐑/𝐔𝐒𝐃𝐓
AR is flirting with a trendline breakout after a long downtrend. A clean move above could ignite a rally toward $16, eyeing a sharp 123% upside. Setup looks primed

AR/USDTAR/USDT analysis on the hourly time frame. The analysis is based on trend analysis, support and resistance. The expected outcome is an upward trend.


ARUSDT 1D AnalysisAR ~ 1D Analysis
#AR Buy on retest of this support block with short term target of at least 10%+ from here.

But that is exactly what you need to start long of your life. Entry:
Futures:
2.90$ Long 50x
3.60$ Long 5x
4$ Long 2x
Spot entry:
3$
4$
5$
Target 80$,100$,300$,600$

AR USDT Looking Bullish
Possible Entrr IN GREEN ORDER BLOCK
USE PLEASE MAXIMUM 10% FROM YOUR CAPITALS
LEVERAGE 20X
MUST USE TP AND SL !

#AR/USDT#AR
The price is moving within a descending channel on the 1-hour frame and is expected to break and continue upward.
We have a trend to stabilize above the 100 moving average once again.
We have a downtrend on the RSI indicator that supports the upward move with a breakout.
We have a support area at the lower boundary of the channel at 7.00, which acts as strong support from which the price can rebound.
Entry price: 7.14
First target: 7.30
Second target: 7.60
Third target: 8.00

Arweave ready for take-off?AR has yet to leave the station. With a nice volume gap above, it is possible to get some follow-through to the upside. Momentum is almost overbought, and the trend is in the bullish control zone.
Full TA: Link in the Bio

AR/USDT : FREE SIGNALHello friends✌
You see that after the price growth we had, we entered a correction, which provided us with a good opportunity to buy📈
We have identified the buying levels and targets for you to buy...
Don't forget capital management, friends.
*Trade safely with us*

AR Trade Setup – Watching for Market Structure ShiftAR is showing early signs of strength after defending the $5 key level a crucial support that bulls needed to hold. Now, the focus is on a potential shift in market structure around $6, which could lead to a strong upside move.
📍 Entry Zone:
Enter around $6 after confirmation (e.g., reclaim with strong volume or bullish candle close)
🎯 Take Profit Targets:
🥇 $12
🥈 $16
🥉 $22
🛑 Stop Loss:
Below $5
