Breaker Block 15mins TFARUSDT BYBIT
On a 15 mins timeframe I confirmed a short movement when I saw a breaker block form and also a break of structure, which ever comes first is a win......meanwhile on a 4hrs timeframe I saw a falling wedge formation , so on a long run I'm expecting a strong buy.
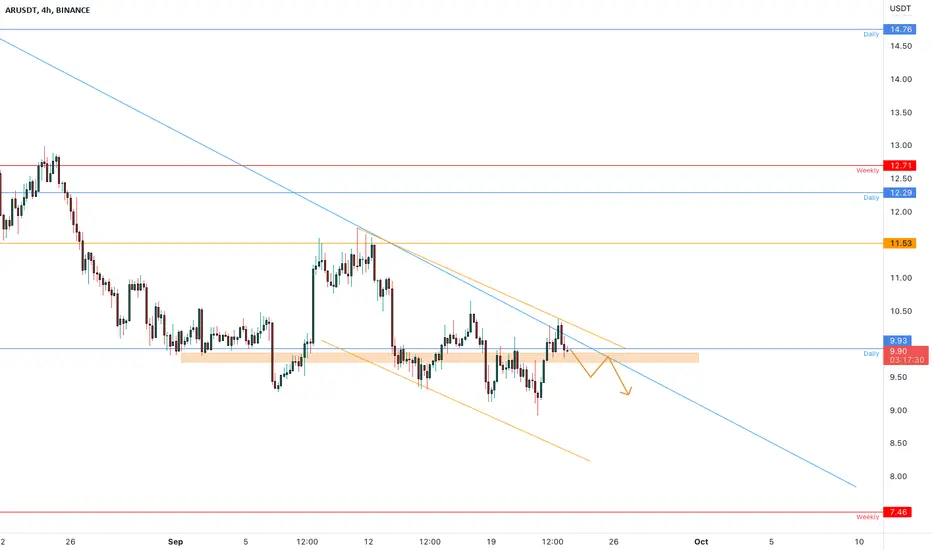
ARUSDT.P trade ideas

Breaker Block 15 TFARUSDT BYBIT
On a 15 mins timeframe I confirmed a short movement when I saw the breaker block and also a break of structure, which ever one comes first is a win.....meanwhile on a 4hrs timeframe I saw a falling wedge, on a long term I'm expecting a strong buy pressure

AR/USDT 4h Falling WedgeArweave forms on the 4h chart falling wedge pattern. If we will breakout and retest our previous resistance as new support. I will expect a bullish move

ARUSDT 1W LONG ANALYSISHi, friends. Nice to meet you
Let me share my view on ARUSDTPERP this time
ARUSDT had to rise after breaking through a downward wedge, but it failed to rise due to the economic recession and unfavorable conditions.
Since SUPPORT LINE is a place that continues to protect it, I believe that it will be able to earn profits where it can expect a rebound through split purchases

ARUSDT is testing the supportThe price is testing the dynamic resistance on the daily timeframe and the static support on the 4h timeframe.
the market is creating lower high and lower lows.
How to approach it?
IF the price is going to lose the support and retest it as new resistance, According to Plancton's strategy , we can set a nice order
–––––
Keep in mind.
🟣 Purple structure -> Monthly structure.
🔴 Red structure -> Weekly structure.
🔵 Blue structure -> Daily structure.
🟡 Yellow structure -> 4h structure.
⚫️ black structure -> <= 1h structure.
–––––
Follow the Shrimp 🦐
ARUSDT (Daily) - Bearish breakoutHi Traders
ARUSDT (Daily Timeframe)
The market is in a downtrend and we are waiting for an entry signal to go SHORT below the 8.90 support level. Only the upward break of 10.40 would cancel the bearish scenario.
Trade details
Entry: 8.90
Stop loss: 10.40
Take profit 1: 8.00
Take profit 2: 7.20
Score: 6
Strategy: Bearish breakout

AR UPSIDE POTENTIALRecommended to open a small position here to avoid any macro economic effect on the (probably) good analysis


Long AR/USDTWe have a constant volume, bullish divergence and falling wedge. My first target is 10.10 wit X10 Leverage

AR USDT SHORT SWING | ARUSDT | SHORT @ 15 - 14 | TP @ 13, 12, 11, 10, 9 | SL @ 17 | PATTERN = BULLISH SIGNAL REVERSED | BINANCE |
This is a longer term swing trade, expect to pan out in days/weeks. PNF chart shows bullish signal reversed trend on hourly. Cipher on daily shows bearish dot
Swing trade idea. Kindly follow targets and stop loss. Will update with new targets once all 5 are achieved. Mostly trading with PNF charts, MACD, RSI, Stoch, BPI, Cipher, MA/EMA, Support/Resistance on hourly timeframes and higher time frames
BINANCE:ARUSDT BINANCE:ARUSD KUCOIN:ARUSDT BYBIT:ARUSDT BINANCE:ARUSDTPERP

ARUSDT | SETUPARUSDT has broken above the falling trendline . The price is trading above the falling resistance. .
If the price is successfully managed to hold the support level we have an excellent upside target. However, break below support will give strength to bears.

AR TRADE 1
ARWEAVE finished its downtrend, and now on a accumulation period.
as it hit my support zone, my bias is to find for a breakout(BOS)
a retest on a 1HR, confirm and entry on 15mins TF for a possible entry.

ARUSDT | WATCHOUT LEVELARUSDT has broken above the falling wedge . The price is trading at an important level. The same zone has 0.236 fib level and horizontal resistance too. where a breakout or break below can happen.
If the price is successfully managed to break above the level we have an excellent upside target. However, rejection from resistance will give strength to bears.

AR/USDT 4hArweave forms on the 4h chart falling wedge pattern.If we will break out and retest our previous resistance as new support. I will expect a bullish move

[ARUSDTPERP 2022.09.07] Good opportunity for long positionBINANCE:ARUSDTPERP
Arweave is a storage network built on a decentralized network structure called “blockweave technology”. Arweave is not strictly a blockchain, but a graph structure that links each block to two prior blocks. Arweave is developing an underlying network to host "the permaweb" — a permanent, decentralized web with a number of community-driven applications and platforms.
Optionally open long positions starting at 8.32, 7.535 is the best position and 5.815 is the extreme position.

Arweave (AR) formed bullish Butterfly for upto 112% pump
Hi dear friends, hope you are well and welcome to the new trade setup of Arweave (AR) coin with US Dollar pair.
Previously in AR with USD pair, we caught a nice pump:
Now on a 4-hr time frame AR has formed a bullish Butterfly pattern.
Note: Above idea is for educational purpose only. It is advised to diversify and strictly follow the stop loss, and don't get stuck with trade

Hidden Bullish DivergenceAnother theory that makes AR super bullish is HIdden Bullish Divergence in the 1D time frame. Also, the RSI is oversold and is most likely to bounce.

Supper BullishAR is very strong right now and also one of the most fundamental strong cryptos. The path will most likely follow as per the chart. In the 1D time frame, it broke the descending triangle also. The next major resistance is around 13Usdt.

2-12-Archive for learningUnder 4h support line but before closing 4h candle and after breaking last 15m support line.
It was stop order before sleeping!
Very risky.

$AR Triple bottom confirmed.. Go LONG...We can see a triple bottom for $AR on the 1hr timeframe, look for an entry and long...
Hope you find this idea useful. LIke, Share and Comment...


AR - Rocket ready to launch🚀Take a look at this beautiful setup!
⭐️ Market looks bullish
⭐️ Domination looks bearish
⭐️ Trendline is 13 days long
⭐️ We have volume at bottom, someone is holding the price
⭐️ Enter on 4th approach after trap
⭐️ Over VWAP
⭐️ 30 ATR
Will enter when price slowly squeezes to the trendline on 5m timeframe, the base will form and the tape will get faster.
Fix profit by parts:
1% - 1/3
2% - 1/3, stoploss to breakeven
What's left, hold to the maximum
What do you think of this idea? What is your opinion? Share it in the comments📄🖌
If you like the idea, please give it a like. This is the best "Thank you!" for the author 😊

AR, reach near support.The following content is machine translation:
In the 1-hour chart, this drop formed support near 11.6, and it failed to fall below it many times, and now it has reached the support near 11.6.
The indicator macd is dead forked, and the RSI indicator fell to a neutral 50.
Summary: Pay attention to the support near 11.6, effectively fall below the short short, stabilize and rebound short.
