Market insights

ARUSDT long - $16.45 to $17.80ARUSDT - Binance
Arweave
Long : 5x/10x
Enter : $16.45
Stop loss : $15.70
Target 1 : $16.82
Target 2 : $17.20
Target 3 : $17.50
Target 4 : $17.80
Target risk : $18
Support levels seem to be stronger than the Resistances BTC will provide bullish trends
up to atleast around $32 000 so that assure me of AR going LONG breaking even up to $18.

🆓Arweave (AR) May-17 #AR $AR
The buying power of AR has gradually increased again after conquering the $14 zone, we can start accumulating AR around this $14 zone and wait for another rally to the $19 zone, this is a very strong resistance area. strength that we need to pay attention to
📈RED PLAN
♻️Condition : If 1-Day closes ABOVE 14$ zone
🔴Buy : 15 - 14
🔴Sell : 17 - 19 - 22
📉BLUE PLAN
♻️Condition : If 1-Day closes BELOW 14$ zone
🔵Sell : 14
🔵Buy : 12 - 10
❓Details
📈Red Arrow : Main Direction as RED PLAN
📉Blue Arrow : Back-Up Direction as BLUE PLAN
🟩Green zone : Support zone as BUY section
🟥Red zone : Resistance zone as SELL section

What is going on with AR :)Hey Guys, AR pumped and now I`m short it! That`s it!
NO FINANCIAL ADVICE | DYOR | HAPPY TRADING

#Ar #Ar / #Spot
❇️Buy zone 1 : 12.09
❇️❇️Buy zone 2 : 10.23~9.88
🛑Don't risk more than 3% of capital.


#Ar / #UsdtTrigger : 15.23 (M15)
________________________
_____________________
_________________
_____________
__________
______
___
_


Nearly thereArweave has a little bit more to go to reach the bottom - somewhere near 8 dollars. Would be a good time now to start buying a little bit here and there.
AR - Scalp short. Follow it before it's too late!We can take short either on breaking two levels that are lower or when price makes false breakout of local high. Be aware about btc strip.
⭐️ BTC bearish
⭐️ Trend is bearish
⭐️ Volume at top
⭐️ Good levels nearby
⭐️ Doing last pullback to kill bears
⭐️ 161 ATR
Will enter when price squeezes to the level on lower timeframes, the base will form and the strip will get faster.
Fix profit by parts:
1% - 1/3
2% - 1/3, stoploss to breakeven
What's left, hold to the maximum
What do you think of this idea? What is your opinion? Share it in the comments📄🖌
If you like the idea, please give it a like. This is the best "Thank you!" for the author 😊
P.S. Always do your own analysis before a trade. Put a stop loss. Fix profit in parts. Withdraw profits in fiat and reward yourself and your loved ones

arweave 4hrs scaleuptrend be sure that is started but maybe from here at about 16$ or the lower zone about 11 to 12 $ ... but it is very great to invest in ar at these zone for middle rang trend and time of investing

AR, the daily chart 5 wave fell.The following content is machine translation:
On the weekly chart, it started to pull back after the 3-wave rise last year.
Judging from the callback, there is a 5-wave downtrend.
Wave 5 is currently in progress.
Continue to bearish, look down at around 17.

ARUSDT Retest completedNice to meet you, everyone
I'm an alt trader
I am a South Korean soldier
I'm analyzing and recommending things that are similar to my personality among many alt coins

ARUSDT downward wedgeNice to meet you, everyone
I'm an alt trader
I'm analyzing and recommending things that are similar to my personality among many alt coins
High possibility of retesting after breaking through the downward wedge

AR, double bottom support.The following content is machine translation:
4 hours, there are short and many opportunities.
Supported again near the front support at 27.5.
A short-term double bottom is formed.
Currently rebounding.
The operation is short-term bullish, and the stop loss is 27.4.

AR\USDTTouching an 8-hour timeframe resistor.
There is also a daily resistance that has caused a FAKE BREAKOUT in the previous encounter.
Breaking the trend line by ERC candle.
The above reasons have led to an uptrend and an ENGOLF in daily time has stabilized it.
It is also possible to create a pullback, which is why I set STOP LOSS below the 8-hour resistance.
---
From a classical point of view, head and shoulders pattern has attracted my attention
--
When tp1 is passed, I check the situation and apply capital management, and I also trail my sl on the entry point.

AR breakingoutAR breakout of a falling wedge took a beautiful support and now making bullish pennant as confirmation to continue the bullish trend.
Entry can be at pullback @ 32.3 or @ 35

ARWEAVE/USDT Nice possible re-entry (or DCA) at the $26 range
Points of coincidence:
- lost support at a significant level ($30-32 range)
- price moving towards the trend line (diagonal support) and anchored VWAP
- MFI is oversold
Failing support at the diagonal (S1) invalidates this trade.
No financial or investment advice.

ARUSDT🟩#AR/USDT (Spot)
🟡E:Market
🔴SL:28.0000
✅Targets:
🟢TP1:35.1667
🟢TP2:37.5305
🟢TP3:39.5932
🟢TP4:41.3147

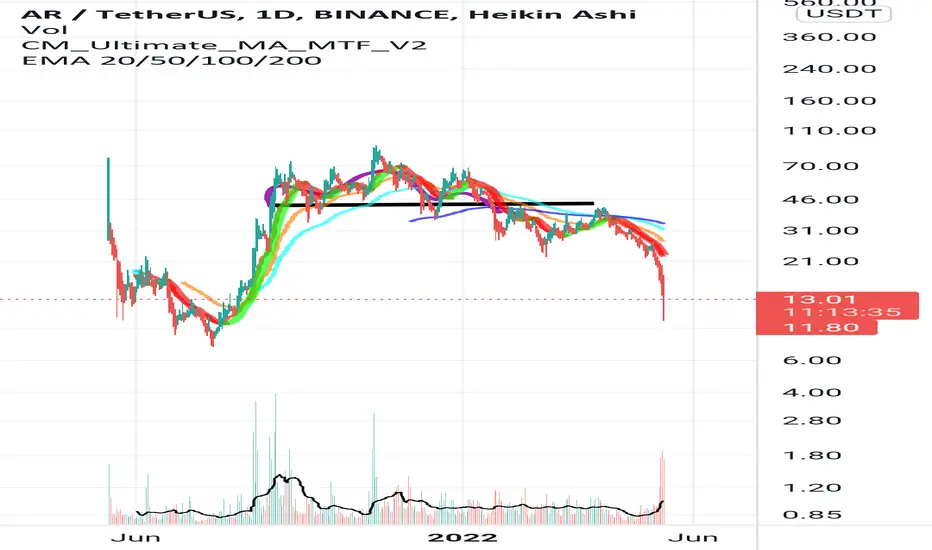
ARUSDTHello my friends , in my idea ARUSDT showing the reversal pattern but there is last chance to got recovery if break the redline expect to see 70$ for a long term , if not expect to dumping from right shoulder !
NOT FINANCIAL ADVICE

ARUSDT-SHORTBased on technical factors there is a short position in :
📊 ARUSDT Arweave
🔴 Short Now 33.57
🧯 Stop loss 37.10
🏹 Target 1 32.00
🏹 Target 2 29.60
🏹 Target 3 26.80
🏹 Target 4 22.22
💸Capital : 1%
We hope it is profitable for you ❤️
Please support our activity with your likes👍 and comments📝

ARUSDT - SETUPARUSDT price is trying hard to break that overhead resistance which was rejected previously. Now we are expecting bulls are warming up to gain good momentum and will break this and surge the price more upward. Buy on dips will be a wise move!

