AR bullish patternthere is a similar patterns in NOT and AR so there is a demand zone at the bottom of the rising spike and there is lots of blocked orders there then the market made a reaction to them and made another rise so it can be a sign of rising until the roof of the market (ath) which will give us over 200 % profit !
Market insights

AR update#AR has a nice pattern with volume demand pattern which means that the market made a big rise and then it has still some volume below after taking them the rising can happen !
my last analysis on #AR 👇👇👇

TradeCityPro | AR : Resistance Levels and Potential for Recovery👋 Welcome to TradeCityPro!
In this analysis, I want to review the AR coin for you. This coin specializes in data storage on the blockchain and has its own dedicated blockchain for this purpose.
📅 On the daily timeframe, after the price reached the resistance at 48.01, it entered a correction phase, dropping to 16.99 and even reaching 13.03. Along this decline, a descending trendline was formed. After buying volume entered the market and the trigger at 20.09 was broken, this trendline was also breached, and the price began to rise.
📈 Currently, after reaching the resistance at 28.85, the price underwent a deep correction, dropping in a single candle back to the area of 20.09. This type of correction is natural in a market with a sharp trend, and most of the time, prices quickly recover from such corrections.
🔑 However, looking at the charts of many altcoins, it is difficult to conclude that we are in a sharply bullish trend. For example, AR itself. The reference to this trend pertains to the overall market trend, with Bitcoin leading the market. Observing Bitcoin's chart shows a very strong bullish trend, and the behavior of altcoins tends to follow Bitcoin's.
✨ In the 45.20 zone, there is critical support on the RSI. As long as the RSI remains above this area and the price stays above the 20.09 zone, the momentum will remain bullish. If the RSI and price drop below these levels, the market momentum will reset.
🔽 For further corrections, the next support levels are 16.99, 13.03, and 10.92, respectively. However, if the price stabilizes above the 28.85 area, it could move toward targets of 37.06 and 48.01.
🚀 The 48.01 resistance is one of the strongest resistances for this coin. If it manages to break this level, the next target will be the resistance at 86.39, which is near the ATH.
📝 Final Thoughts
This analysis reflects our opinions and is not financial advice.
Share your thoughts in the comments, and don’t forget to share this analysis with your friends! ❤️

Bombay currency...Hello dears
This currency is from the Solana ecosystem, which has not started its main growth, so we checked it for you.
The price after the pump. Placed in a channel for about 290 days.
Now it has formed a pattern which shows that it wants to start its growth and you can buy it step by step as we have specified the purchase limits for you.
Friends, be sure to observe capital management.
Be successful and profitable

ARUSDTmy entry on this trade idea is taken from a point of interest below an inducement (X).. I extended my stoploss area to cover for the whole swing as price can target the liquidity there before going as I anticipate.. just a trade idea, not financial advise
Entry; $24.79
Take Profit; $27.70
Stop Loss; $23.87

AR/USDTBeautifull setup. Will take profit on red lines as price move up. Entered here a few days ago. Price still low if you want to enter. Support is at 15.36. Im not trading with a SL here. Will bring my SL in once I have another higher high on the daily timeframe. Will trail SL as we go up below previous structure swing low. Enjoy!

AR/USDT potential 160%++Accumulate under $9 - $17.5
Targets Points
TP 1 : $23.5
TP 2 : $29
TP 3 : $34
TP 4 : $39
TP 5 : $23

Arweave is so bullish60 dollar is a target
In wave 3
Dont forget its not a advice
Its a road map of AR project

ARUSDT LONG IDEAAR has broken dynamic and static resistance and it can go to the moon.
entry:27.97
tp1:34.27
tp2:46.3
sl:24.01
With no leverage.

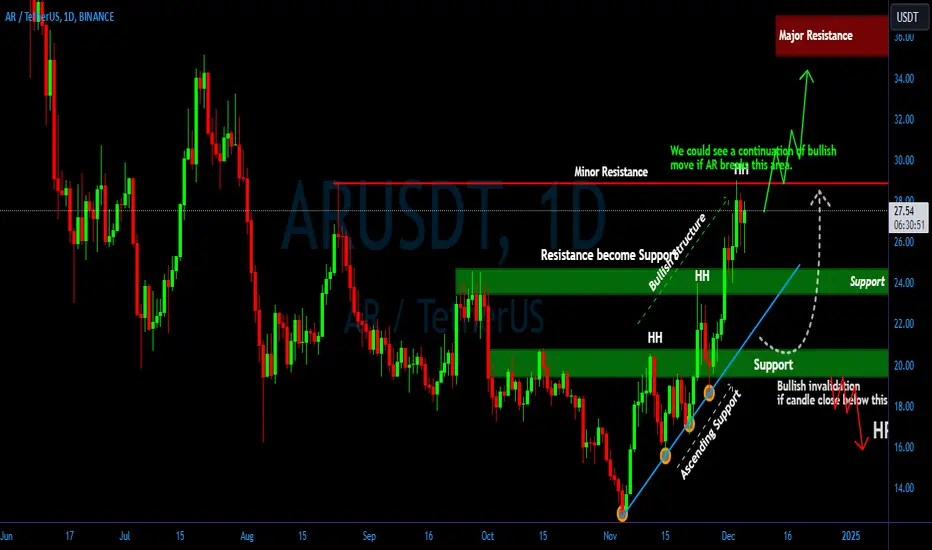
ARUSDT Will the Bulls Take Control or Are We Heading for a Deep?Yello, Paradisers! Is #ARUSDT about to break free and soar, or are we staring at a potential drop to key support zones? Let’s dive in and unpack this critical setup.
💎Currently, #AR is respecting its support level, showing signs of a potential bullish continuation. if it successfully breaks the minor resistance at $28.85. Should this breakout occur, we anticipate a mid-term bullish movement, with the highest probability of the price reaching our target at the major resistance zone.
💎However, if AR fails to break the minor resistance, the price may consolidate in a sideways range between $24.60 and $23.00, as it seeks to decide its next move.
💎If AR breaks down below the support, the price could retrace significantly, potentially testing the **second support area at $20.70 - $19.40. Historically, this support zone has held strong multiple times, offering buyers a solid re-entry point. Should the price revisit this area, we expect a similar reaction.
💎However, bullish invalidation occurs if the price closes below $19.40. In such a case, AR could continue its downward trend, exposing the market to further dips.
Stay alert and remember, disciplined trading is the only way to navigate uncertain markets. Always plan your trades carefully, wait for confirmations, and protect your capital. Let’s stay smart and focused, Paradisers!
MyCryptoParadise
iFeel the success🌴
#AR/USDT#AR
The price is moving in a descending channel on the 4-hour frame and is holding it tightly and is about to break out to the upside
We have a bounce from the lower limit of the channel at 17.70
We have a bearish trend for the RSI that is about to break out, which supports the upside
We have a trend to stabilize above the 100 moving average
Entry price 18.40
First target 20.50
Second target 22.22
Third target 24.95

AR Long Spot Trade (Resistance Consolidation Opportunity)Market Context:
AR has moved into a critical resistance zone, where price consolidation could occur before the next upward leg. This presents an opportunity to position for potential breakout gains.
Trade Details:
Entry Zone: Ladder between $23.00 and $27.00.
Take Profit Targets:
First target: $40.00 - $45.00
Second target: $70.00 - $80.00
Stop Loss: Set a deeper stop loss just below $20.00.
This trade anticipates consolidation within the resistance area, with a setup aimed at capturing substantial upside momentum.

Arweave is bullishAR has broken the downtrend
Entry 19.00 Target 29.00 Stop 11.00
BINANCE:ARUSDT
Arweave is a decentralized storage network

AR/USDT CMP 21.1 Breakout given Looks goodAR/USDT CMP 21.1 Breakout given Looks good
Targets expecting 28/35/49
Bull run in Alts is about to come strong and hard this time.

ARUSDT 1D Arweave (AR) is a storage platform based on the Proof of Access protocol, that creates a permanent scalable data warehouse , keep an eye on it 🚀👀

$ARnot sure if there is any point posting this but update to my earlier post
think the time is now if anyone fancies
3.7% risk from here target $47 for the first move or thereabouts
1 hour rsi just needs to turn uo which it should do as long as we reclaim the 200 so lets see what we get in 47mins and clear that small cluster of resistance above
position yourselves .. IF not already;)

AR Breaking out its resistance zone forming a bullish patternAR Breaking out its resistance zone forming a bullish pattern. Targets expected to be 29/35 in the near term above that 49🚀🚀
#ARUSDT #BTC #ETH #CRYPTO

AR/USDT AnalysisAR/USDT Analysis
This analysis aligns with the bullish breakout scenario, but market conditions should be monitored closely to adapt to any sudden changes. Risk management is crucial for optimizing trade outcomes.
Target Levels:
Target 1 (T1): $39.97
Target 2 (T2): $54.27
Target 3 (T3): $68.04

ARUSDT With low risk after a breakout and price consolidation above the breakout level you can make an initial entry Keep in mind that if the price moves downward another buying opportunity may arise Please consider your risk before entering

AR COIN SWING LONG - Arweave Long OpportunityAR is one of my favorite coins fundamentally. It has a strong foundation in storage and distributed computing, which could play a crucial role in integrating AI technology with crypto. I won’t go deep into the details here, but you can read more about it online if you’re interested.
Technical Analysis:
The price reached the monthly demand, ran the daily swing liquidity, and couldn't close below it. We saw a strong rejection from that level, which led to a break in the daily structure.
Additionally, we broke the bearish trendline responsible for the downtrend since spring 2024. The trendline has been retested and rejected, further reinforcing the bullish bias. I believe we could soon see strong upward momentum on this coin.
I’ve purchased a spot bag and opened a futures position at this level, targeting significant upside and potentially holding as a swing trade until all-time highs.

AR Long Spot Trade (Support Retest)Market Context: AR has retraced to a significant support zone between $18 and $20, following a rejection around $24. This retracement offers a favorable entry point for a long position, with potential for a rebound toward higher resistance levels.
Trade Details:
Entry: Between $18.00 and $20.00
Take Profit Targets:
First target: $24.00 – $26.50
Second target: $32.00 – $35.00
Stop Loss: Just below $16.00
Rationale: The current support zone aligns with previous price action, suggesting a potential for upward movement. The risk-to-reward ratio is favorable, with a clear stop loss below the recent support level.
Note: Always conduct your own research and consider your risk tolerance before entering any trade.

AR/USDT: High Risk-to-Reward Setup on 4H Chart (4.18 R:R)Trade Setup Overview
Entry Zone (CMP): $16.80 - $16.60 (current price action suggests consolidation near these levels).
Stop Loss: $16.21 (below recent lows and key support).
Target: $17.90 (next significant resistance level).
Risk-to-Reward Ratio: 4.18
Key Levels to Watch
Entry Zone: $16.80 - $16.60. This zone is near current price action and offers a good entry point, with a favorable risk setup.
Stop Loss: $16.21, placed just below the recent low to manage downside risk.
Target: $17.90, a key resistance level, aligning with the expected short-term bullish move.
Technical Context
1️⃣ Price Action: AR/USDT is holding near the support zone of $16.80 - $16.60, which could act as a base for a short-term rally.
2️⃣ Fibonacci Retracement: The entry range aligns well with the 0.5 retracement of the previous move, strengthening the support.
Next Steps for Traders
1️⃣ Watch for Confirmation: Look for a bullish candlestick pattern or price action confirmation within the entry range before entering.
2️⃣ Manage Risk: Place your stop-loss at $16.21 to keep risk limited while targeting the $17.90 level for profit.
3️⃣ Target Execution: Consider taking partial profits as the price approaches $17.90 or use trailing stops to lock in gains.
Conclusion:
With a 4.18 R:R ratio and a defined entry range of $16.80 - $16.60, AR/USDT is setting up for a short-term bullish move toward $17.90. Keep an eye on the support at $16.21 and the key target at $17.90
What’s your view on this setup? Share your thoughts in the comments below! 👇
Disclaimer: This is not financial advice. Always conduct your own research before trading.

Trading opportunity for ARUSDTBased on technical factors there is a Buy position in :
📊 ARUSDT
🔵 Buy Now
🪫Stop loss 18.500
🔋Target 1 26.500
🔋Target 2 30.000
🔋Target 3 35.000
💸RISK : 1%
We hope it is profitable for you ❤️
Please support our activity with your likes👍 and comments📝
