Bullish potential detected for AGLEntry conditions:
(i) higher share price for ASX:AGL along with swing up of indicators such as DMI/RSI.
Depending on risk tolerance, the stop loss for the trade would be:
(i) below the low of the recent gap-up (12th September) of $8.44, or
(ii) below previous potential support of $8.24 from the open of 28th August, or
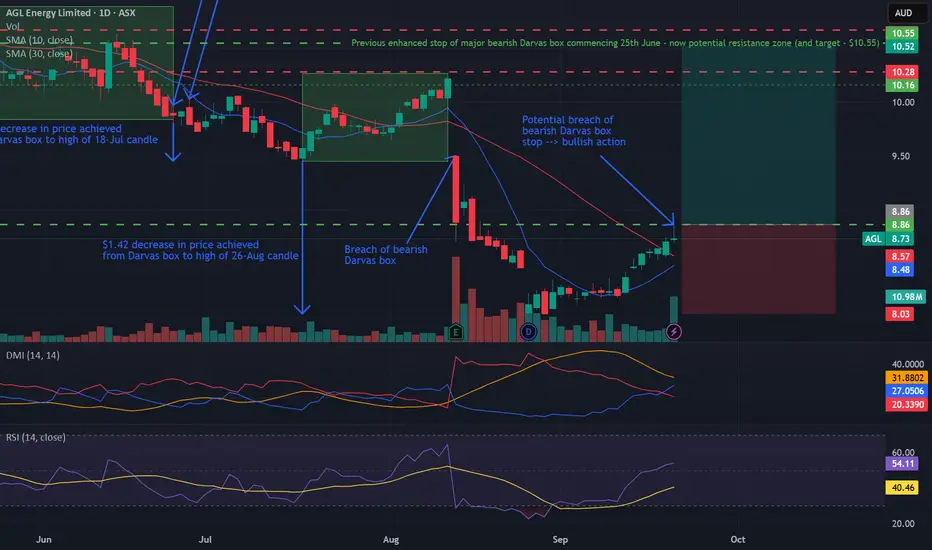
(iii) below the prior swing low of $8.03 from 26th August.
AGL Energy Limited
No trades
Trade ideas
Bearish potential detected for AGLEntry conditions:
(i) breach of the lower confines of the Darvas box formation for ASX:AGL
- i.e.: below low of $9.84 of 7th April, and
(ii) swing increased bearishness of indicators such as DMI/RSI along with a test of prior level of support of $10.02 from 11th March.
Stop loss for the trade (based upon the Darvas box formation) would be:
(i) above the high of 10th April (i.e.: above $10.89), or
(ii) above the prior support level from the open of 10th January (i.e.: above $11.15), depending on risk tolerance.

$AGL $AGL.ax Bullish Continuation AGL Energy (ASX: AGL) – Snapshot
Industry: Utilities (Energy supply & services)
Focus: Decarbonisation & electrification
Share Price (09/05): $11.05 | Market Cap: $7.43B
Volume: 1.26M (4-wk avg: 1.75M)
1-Year Return: +6.76% (slight outperformance)
Key Financials: EPS $0.344 | DPS $0.58 | BV/Share $7.83 | Shares: ~672.7M
Ranking: ASX #76 | Sector #5
Broker Consensus: Buy (3 Buy · 4 Hold · 0 Sell)
Bullish Continuation. OBV rising, ASX Utilities index Breaking out, Low RSI. Good buying levels.

AGL - Bull pending?Are there bulls lurking here ahead of potential rate cuts?
Our Bullfinder-official Team has identified a potential opportunity within ASX:AGL
If price can hold above the $10.00 mark, there may be potential for a re-rating of momentum to 'bullish'.
We would like to note however that below ~$10.00 significant bearish continuation risk comes into play.
We're inspired to bring you the latest developments across worldwide markets, helping you look in the right place, at the right time.
Thank you for reading! Stay tuned for further updates, and we look forward to being of service along your trading & investing journey...
Disclaimer: Please note all information contained within this post and all other Bullfinder-official Tradingview content is strictly for informational purposes only and is not intended to be investment advice. Please DYOR & Consult your licensed financial advisors before acting on any information contained within this post, or any other Bullfinder-official TV content.

Buying idea AGL with stop at 11.45Buying again at just top of 50 day MA. got stoped last week and now again getting in with new buyable set up. let's see this time will it work :) very tight stop at 2% to avoid big damage even if not work.
overall market sentiment changed a bit with US again talking no further rate cuts this year and AU still not seen any sings. December hopes gone out of the windows, we will unlikely to see Santa this year either :(
Yesterday was a good realisation again, we only can manage risk every thing else is a probability game :)
DISCLAIMER : The content and materials featured are for your information and education only and are not attended to address your particular personal requirements. The information does not constitute financial advice or recommendation and should not be considered as such.

Buying idea AGL with stop at 11.66AGL trying break through it's recent highs and had consolidated around this level. with overall mkt sentiment this time it might break out. with a tight stop can see if it going to work.
DISCLAIMER : The content and materials featured are for your information and education only and are not attended to address your particular personal requirements. The information does not constitute financial advice or recommendation and should not be considered as such.

ASX: AGL Fibonacci retracements
ASX:AGL AGL Energy is have been underperforming for long time , now for one year return is just 3.16%
Look the chart and notice
- double bottom formation on weekly chart
- higher high higher low formation
- no supply
- stock also above the key level of fib levels
disc: invested and tracking

$AGLIN a deep, dark hole under a huge amount of volume and a potential spring/ vs bear glag.
DON't like it at all

AGL energythe price movement is very impulsive. It has completed the wave 3 of a smaller degree which is now correction in terms of wave 4. If the price move according to this analysis , then the next price target would be $13.50.
Wave 4 is hovering just around the 200ma indicating that the price is go flat for a while. The next resistance to break is the high of the smaller degree wave (3).

$AGL NYSE:AGL running hot into an area of resistance, everyone getting horney. Almost 6 months without any pullbacks....
#gas

More Moving Averages for ScreenersAdd more Moving averages to the screener to enable a more robust screening process for traders. This would be for weekly and Daily charts as the 200MA daily would be a 40MA on a weekly chart and that option doesnt exist, there is also no 150MA for Daily charts but there is the 30MA that can be used for weekly


AGL getting ready for launchAGL is getting ready for a pump. I am looking at the double bottom pattern to play out. The volume on last two sell days has been very low, and there has been a bullish divergence. Let's see where this one leads to...first target is $7.52.
DYOR and trade at own risk.


long term investment in AGL?AGL has probably finished falling now, its actually not a bad investment at the moment, with downside risk limited, I doubt it would hold below these recent lows for very long if it went below them at all. AGL will transition to renewable energy over time, they are a business, not an environmentalist company, so I forgive their holding on to fossil fuels. they are a long term well established company, which give decent dividend yields and a low risk long term investment, these alone would hedge against inflation, but the outlook over the next few years is to make some capital gains as well. risk would be lower by buying at the marked levels, I do think that at least $6.30 will be achieved over the next months, but if you take a look at the monthly chart, buying below $8 still makes sense for investments over 7 years.

AGL bullish ascending trianglelong term one to watch, looking for a break high on volume, support and then run back to 15-16

AGL- dividend stock - BUY AGL stock is a beautiful buy .
Currently will start a 5th wave journey to a price of 10 $ + where I would like to sell on trendline break .
Will start dropping to a 7$ price point after that for a correction of the big impulse.
Estimate date to reach that is Mar 23 . It will be a better buiying point .


AGL Candles (Bullish + Bearish) AGL Candles (Bullish + Bearish) to indicate what has happened in the past and where it may lead.

AGL Energy Potentially in Distribution PhaseAGL Energy has seen a steep downfall that started in August 2021 and lasted until about December 2021, trading at about AUD 16.95 in August 2021 and trading as low as AUD 5.10 in November 2021. It has however picked up some pace since then with a potential bullish trend that sees it trading at around AUD 7.5. Still a long way from where it was at this time last year, but might be worth a look to catch the trend.

AGL long bullishneeds to break and consolidate above, 7.85 trend line for a bounce up to next line 10.42 for 25% gain, then IF hold that trend line can bounce up to next line of 14.25 for close to another 25% gain, 3-4 week time frame on each trend line

The same Pattern over and over again.Shorting AGL is free money. Its the third time this pattern has been used in the past 3 months.

AGL @ 15 SEP 2021AGL
- First time doing a written analysis on AGL
- Stock has been in a big downtrend since April 2017 -> a drop of almost 80%
- God bless the long-term investors as their capital is haemorrhaging
- In all 3 markets (Australia, Malaysia, and US), there was a big crash in stock prices in March 2020
- Most of the stocks have recovered to above pre-Covid crash levels
- AGL bucks the trend by creating new lows in August 2020
- Stock price has dropped more than 60% since that broken support
- Downtrend stocks have a lot of overhead resistances -> not conducive for a good mid-term uptrend to form
- Strategy-to-buy (DYOR) – There are other better stocks out there
-----
Text me if you have any questions/feedback for me.
