$ATOM Buy SignalBINANCEUS:ATOMUSDT Atom has been one of the cleanest charts to trade on key levels alone. Here you have a few historically significant levels and we are approaching one around the 8.7 range. That coupled with the MA200 being at 8.5 right now, I’m picking some up at this level. I would get stopped out as soon as we have a daily close below the MA200.
Market insights

Is ATOM forming a cup?See my previous idea for SOL, posted that a few weeks before it started flying, now I'm possibly seeing a cup being formed on ATOM, still needs more candles, but has the makings of one.
One for the watch list

Cosmos Simple Trade- Everything is in graph.
- Atom stayed strong in this bear market.
- Here we stat in cryptos, everything can go fast up and down very fast also.
- Adapt your strategy accordingly.
- Follow TheKing movements.
- Invest what you don't need for living.
--------------------------------------------------------
Trade Setup
--------------------------------------------------------
- Buy Breakout : 14$+
- Buy Retracement : 10$ish ( 25% of your invest )
- Buy Bottom : 5$ish ( add 75% more invest )
TP : Before 20$
- SL : 4$
--------------------------------------------------------
- Stay Safe
- Happy Tr4Ding !

Cosmos Hub (ATOM) Primary FocusIn comparison to other altcoins, the price growth of ATOM has been more gradual. The asset has appreciated by 60% over the past month and is currently hovering near the resistance zone of $10.20-$10.58. Notably, ATOM's rise seems quite steady, characterized by regular corrections and pullbacks. This kind of price movement is generally seen as more sustainable than a rapid, short-term spike.
The continuation of growth and reaching new highs are the current focus. Once the present resistance range is breached, buyers could set their sights on the next resistance levels at $11.0 and $11.5. As the new year approaches, we might witness an accelerated rise to the $15.4 level, marking the asset's annual high that hasn’t been tested for over 10 months.
A local correction in ATOM could see the asset drop to the $9.57 level. Below this, there is a support zone ranging from $8.62 to $9.13, and a buyer’s level at $8.15. These marks present appealing opportunities for opening long positions.

ATOMUSD 83% profit projectionCosmos already broke the channel down pattern. Our bullish target around 15.332 at resistance level with 83% profit projection.
We also have support level at 5.572 (-87% from ATH), if bullish fails, prepare to buy back at this support with 177% profit projection.
If you have any questions about this analysis, do not hesitate to contact me.
Happy trading

ATOM USDSolid S/R flip on key swing low level.
ATOM has always been relative underperformer.
Potential for Adam & Eve reversal formation.
Max extension target is $36
3 stops north.

ATOMUSD (4H) - Bullish breakoutHi Traders
ATOMUSD (4H Timeframe)
The market is in an uptrend and we are waiting for an entry signal to go LONG above the 8.78 resistance level. Only the downward break of 8.14 would cancel the bullish scenario.
Trade details
Entry: 8.78
Stop loss: 8.14
Take profit 1: 9.17
Take profit 2: 9.80
Score: 8
Strategy: Bullish breakout

Potential ATOM longIf ATOM can break through/close above the descending resistance, there is some room for it run to the 8.57 area for a TP area. That area coincides with the top of the descending resistance line and the EMA 200.

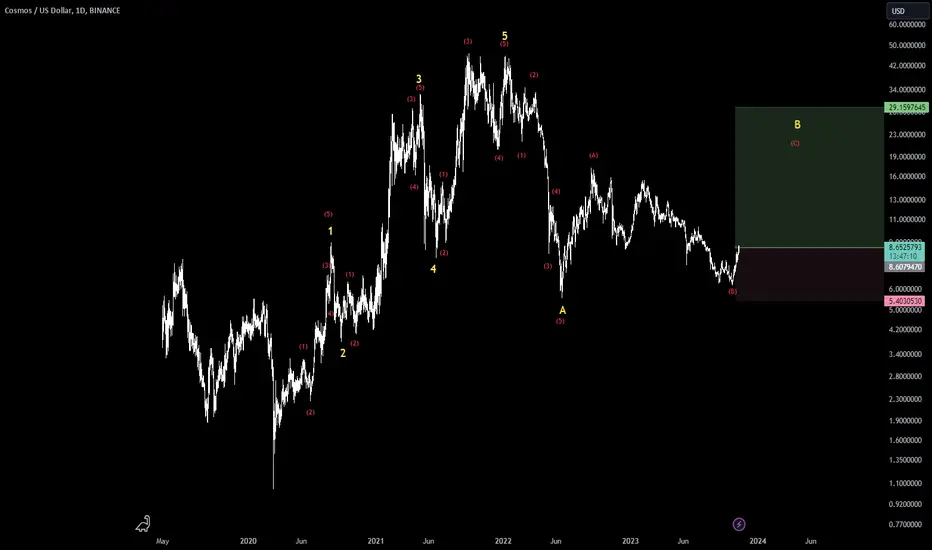
ATOM_USDAccording to the ATOM_USD Elliot wave market cycle, this token can be formed as an A B C or W X Y pattern. As a target, the market will reach the price range of 20$ - 30$
ATOM LONGThe whole crypto market has been moving up for some time. Now that Bitcoin is moving sideways, it is time for alts to move. Atom has been trending up and has just swept some liquidity. Id like to buy quite agressively because i expect a pump

ATOM Double BottomAtom has been off everyones radar for a while, its performance has been what we were used to in the last bull market.
Now the chart is speaking, we have a monthly double bottom and things are looking good though we are at a minor resistance, our next upside targets are shown at the fibs levels where we also have MA confluence.
Atom is a good project.

Atom usdtAtom will hit my resistance and I am currently 80 percent sure it will do so. People please long

ATOM breaking Daily downtrendlineATOM bullrun has started. ATOM has played a ABC zig zag correction for wave 2 and now it has started the 3rd wave breaking the trendline. ATOM can even reach 100$ in the bull run. This scenario is in valided if breaks 5$ area downwardly

ATOMMy idea of an ok place to start small monthly buys into hopefully a project that will last.
Bought and staked $6.88
Hopefully will sell around $40, that will be tricky with the unstaking process
Not financial advice. Could go to ZERO

ATOM setup extremely bullish! The candles/bars in between the 50 and 100, will mark a tremendous breakout of this bull flag!
There will be a little pullback for sure, but the slingshot setup is apparent.
Entertainment purposes, not investment advice :)

📊#ATOM may drop according to the smiley face structure📉➡️This is a smiley face structure that I am very familiar with, so we set the market trap in advance and successfully hunted 200%+ yield.💥
Since we failed to break out of the resistance zone and formed a smiley bear structure, and also broke the uptrend line and inflection point, I judged that we would continue to move lower.📉
⚠️Note that if our short defense is breached, it means that the short structure is broken, which means that we may continue to move higher.📈
Let's see👀
🔔If you also want to improve your trading skills, then you can find Wolf king 💌and we will set up traps for hunting together.🕳💰🍻

📊#ATOM short defense has been breached ❌double top has failed❌🧠It is a pity that the market did not develop in the expected direction, but chose to break the short defense point, which means that the short structure has been broken and will continue to be bullish in the later stage📈
Let's see if we can achieve our goal👀☕️
🔔If you think my analysis is useful to you, please don't forget to "like" me.✔️💯💪🍻
💕 Follow me so you don't miss out on any signals and analyze 💯

📊#ATOM has a potential double-top structure, be careful do long🧠We have formed a double top bearish structure in the resistance zone, so it is not recommended that you continue to chase up, if the short defense point is broken, you can light position chase up.🐾
➡️If the bull defense point is broken, then we will continue to adjust with high probability.📉
Let's see👀
🔔If you think my analysis is useful to you, please don't forget to "like" me.✔️💯💪🍻
💕 Follow me so you don't miss out on any signals and analyze 💯

ATOM SHORT STRONG LEVEL GOING DOWN This has a possible on pumping if there any news but if there isnt we must likely gonna tank

COSMOS potential tradeLooks like it could be ready to move
might have a few days, will wait to see how btc and eth react on the next down move

COSMOSUSD Elliott wave intraday count 4H TFWatching for evidences wave ((2)) ended 6.772.
A clear break of 7.069 pivot will be a good evidence to continue up.
Also we may have another low if price break 6.722 as wave ((a)) has not reached 1:1 ratio with wave ((c)). If break it we are expecting to bounce into the 1:1 ratio ((a)) vs ((c)) where we have 0.764 fib retracement of wave 1 and the bottom line of the channel.
Future updates will be posted as updates to this count.
Daily intraday updates on 1H and 4H time frame, don`t miss them!!
Good luck!

Cosmos Under Bear Claw Plans Reversal?Long-Term Downtrend: ATOM is currently in a falling channel pattern.
50-day EMA Barrier: ATOM faces constant rejections from the 50-day EMA.
Price Target: The asset is eyeing the $6.50 mark.
Uptober Uncertainty: Despite high expectations, the market has been slow to rally.
Pattern of Lower Highs: The daily chart shows prominent lower high formations.
Double Top Formation: Peaks are forming at the declining 50-day EMA.
Today's Price: ATOM is trading at $6.626 with a -1.13% intraday move.
Death Cross: The 50 and 200-day EMAs indicate a long-term downtrend.
RSI Status: The daily RSI has crossed below the halfway line.
Bullish Reversal?: Chances are slim but a reversal from $6.40 is possible.
Dynamic Resistance: The 50-day EMA is a significant barrier.
Support Zones: Key support levels are at $6.25 and $6.

COSMOS ECOSYSTEM LONG TERM PLAYCosmos ecosystem has one of the most respected technology and thus, is a great long-time play for the next cycle.
I am looking at LT buy between 5 and 8 USD
TPs are 20 / 40 / 100 (ish)
The time horizon is 1 to 4 years
