TradeCityPro | Deep Search: In-Depth Of ATOM👋 Welcome to TradeCity Pro!
Today we have a deep research analysis of the ATOM project, and in this report, I’m going to review the project completely. Let’s first go over the project’s fundamentals and then analyze the ATOM chart technically.
🌌 What Is Cosmos?
Cosmos is a blockchain ecosystem desi
No news here
Looks like there's nothing to report right now

Don't Miss This Big Move on COSMOS (ATOMUSDT)Hello Everyone!
With Bitcoin on the rise and Ethereum likely to follow—as outlined in my recent ETHEREUM analysis idea —we continue to look for strong opportunities in the altcoin market. Right now, all eyes are on COSMOS ( BINANCE:ATOMUSDT ) as it shows promising signs of a potential breakout.

WARNING For ATOM Holders: -50% Crash Incoming!Hello, Skyrexians!
As you know I was not sure last couple of days if altseason started or not and finally decided that not. Bitcoin dominance will reach 67% and large altcoin like BINANCE:ATOMUSDT gives me the hint that altcoins can drop 50% in the upcoming 2-3 weeks!
Let's take a look at the 2

My thoughts on this asset im hoping it does something similar to what i have drawn up i feel some harmony in the way this chart is playing out , dont have any techical mumbo jumbo to support my idea but i have been accumulating at the 4$ range and put into staking and i would be pleased if it got a nice pump to at least 12-

ATOMUSDT - LONG-Breaking out of bullish flag + 6 months of consildation range.
-Tested 0.5 +0.618 Fib level well with good volume support.
-Expecting strong move to retest 50 EMA region.

ATOMUSDT LongThis is not a signal but just my observation since I noticed some double bottom on this time frame 1D.

GANN ATOM Analysis
According to the temporal analysis, the targets highlighted in green are expected to be reached in the coming weeks.

Cosmos (ATOM): Possible Bullish Momentum To Catch | +25% / +50%Cosmos coin is in a sideways channel where if we zoom in we are seeing some signs of a reversed head & shoulder pattern.
Now ideally we would look for the first CME gap to be filled here; once we see a bullish overtake of local resistance there, we will be looking for a fill of the upper CME as we

Cosmos (ATOM): Buyers Heading To Fill Bullish FVGsCosmos has recently had a decent movement to lower zones, where, after a proper breakdown (MSB), we are now seeing the second stage for a possible short position, but we are still far away from our entry. We are waiting for more clarity here!
More in-depth info is in the video—enjoy!
Swallow Acade

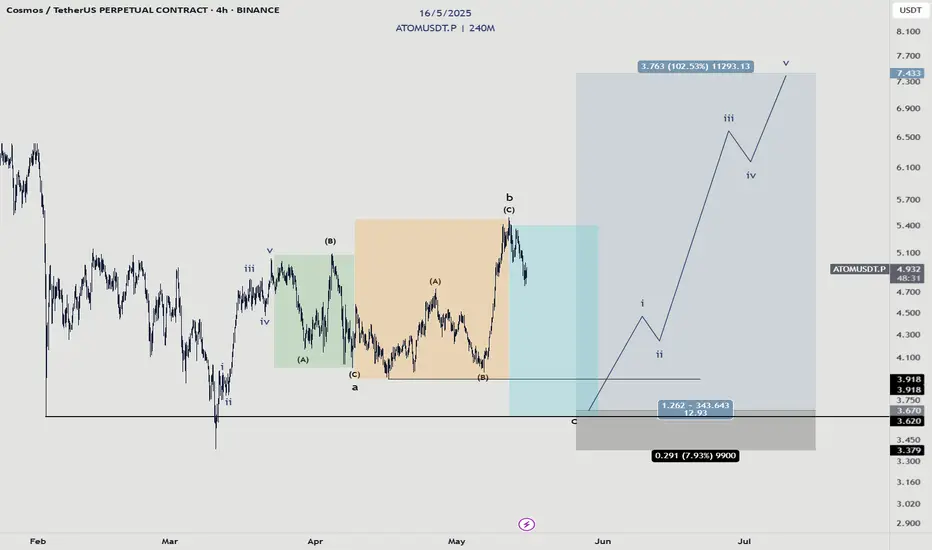
Cosmos - Manipulation?This idea is valid as long as the structure in the orange box maintains its three wave structure.
To prepare for a big run, it goes without saying that there must be some sort of accumulation and manipulation to occur.
In this case, I propose this expanded flat structure where we took the high ou
See all ideas
Summarizing what the indicators are suggesting.
Oscillators
Neutral
SellBuy
Strong sellStrong buy
Strong sellSellNeutralBuyStrong buy
Oscillators
Neutral
SellBuy
Strong sellStrong buy
Strong sellSellNeutralBuyStrong buy
Summary
Neutral
SellBuy
Strong sellStrong buy
Strong sellSellNeutralBuyStrong buy
Summary
Neutral
SellBuy
Strong sellStrong buy
Strong sellSellNeutralBuyStrong buy
Summary
Neutral
SellBuy
Strong sellStrong buy
Strong sellSellNeutralBuyStrong buy
Moving Averages
Neutral
SellBuy
Strong sellStrong buy
Strong sellSellNeutralBuyStrong buy
Moving Averages
Neutral
SellBuy
Strong sellStrong buy
Strong sellSellNeutralBuyStrong buy
Displays a symbol's price movements over previous years to identify recurring trends.