No news here
Looks like there's nothing to report right now

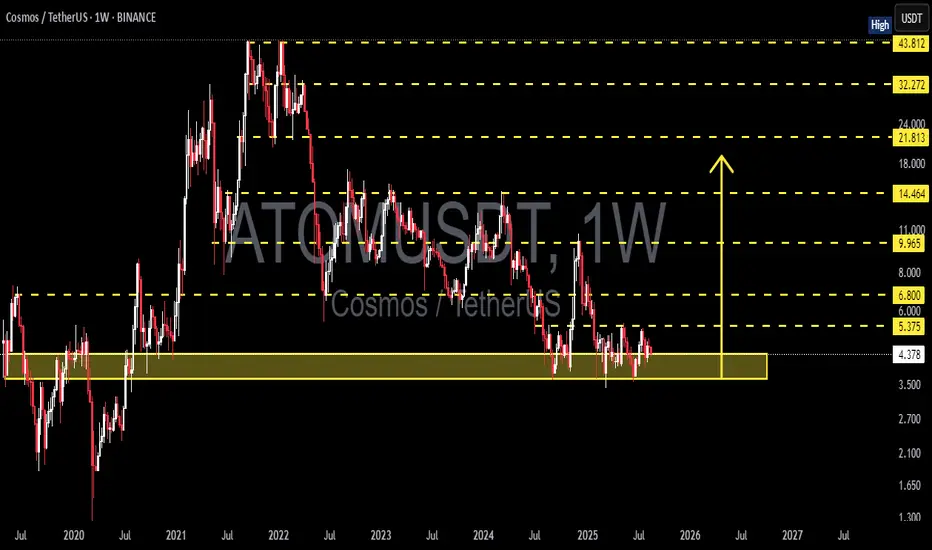
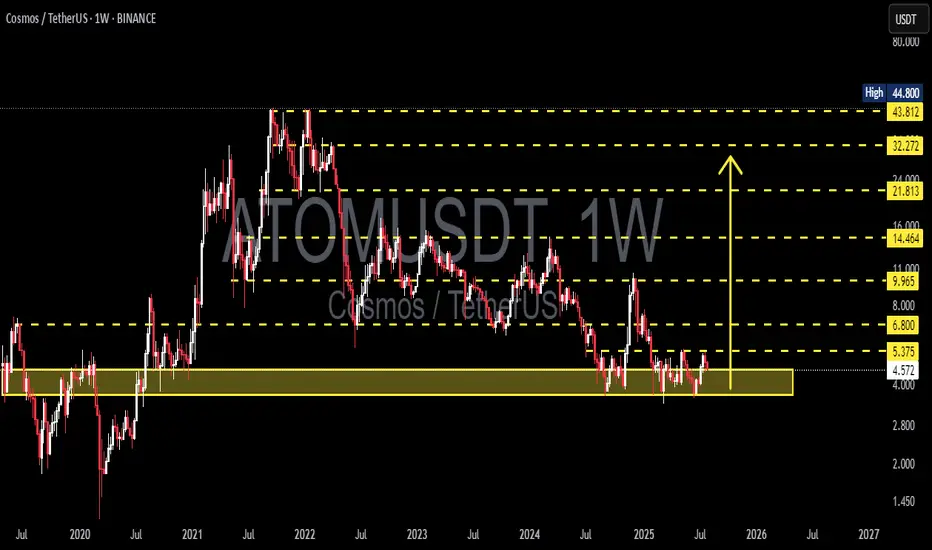
ATOM/USDT Weekly – Strong Accumulation, Is a Major Reversal?📊 Overview
The ATOM/USDT weekly chart shows that the price is currently in a long-term accumulation phase after a massive downtrend since 2022.
The 3.5–4.6 USDT demand zone has acted as a strong historical support level since 2020 and has once again proven its strength during 2024–2025.
In simple t
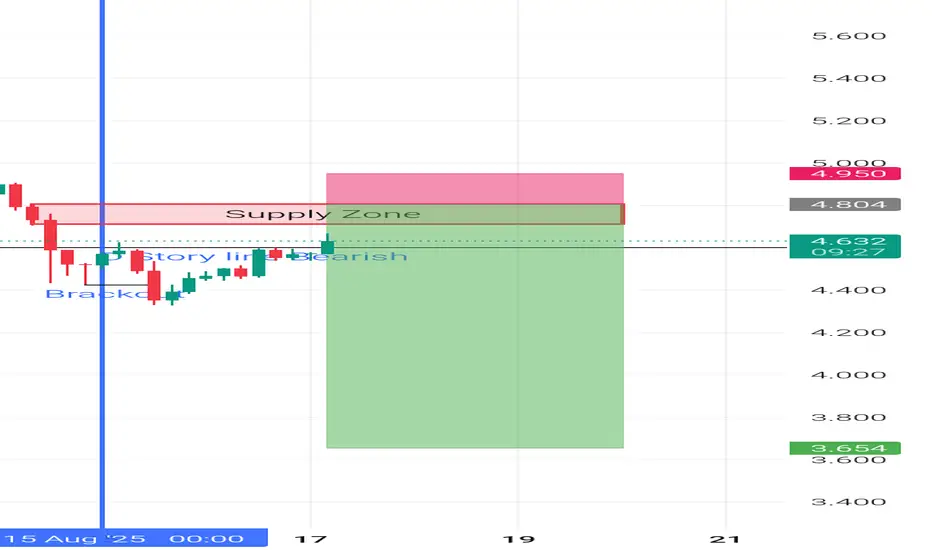
ATOM_USDT 4H Sell Trade.Atom is reaching to the 4H supply right now. When I added Fibonacci Indicator on the chart I can see Golden Pocket zone on that area. This is a good sing for Market revasal.Other wise Im expecting 15munutes divergence could be created. So keep watching on the Market to catch a good trade.
HAPPY TR
buy midterm atom "🌟 Welcome to Golden Candle! 🌟
We're a team of 📈 passionate traders 📉 who love sharing our 🔍 technical analysis insights 🔎 with the TradingView community. 🌎
Our goal is to provide 💡 valuable perspectives 💡 on market trends and patterns, but 🚫 please note that our analyses are not intended as buy o
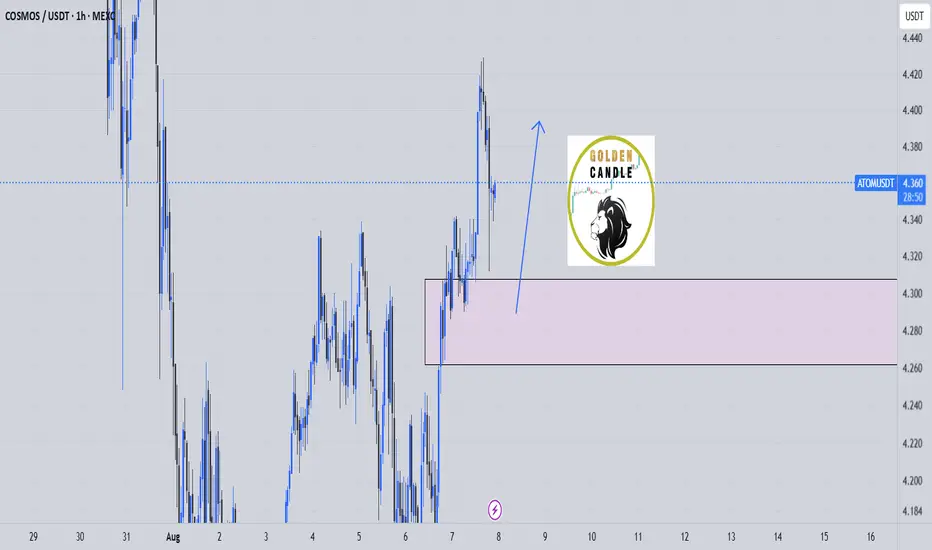
Cosmos (ATOM): Seeing Potential 8% Movement Towards FVGAfter a successful H&S pattern, we are seeing a good opportunity to take a few long positions here on the ATOM coin, so that's what we are looking for: a potential 8% movement to happen here!
More in-depth info is in the video—enjoy!
Swallow Academy

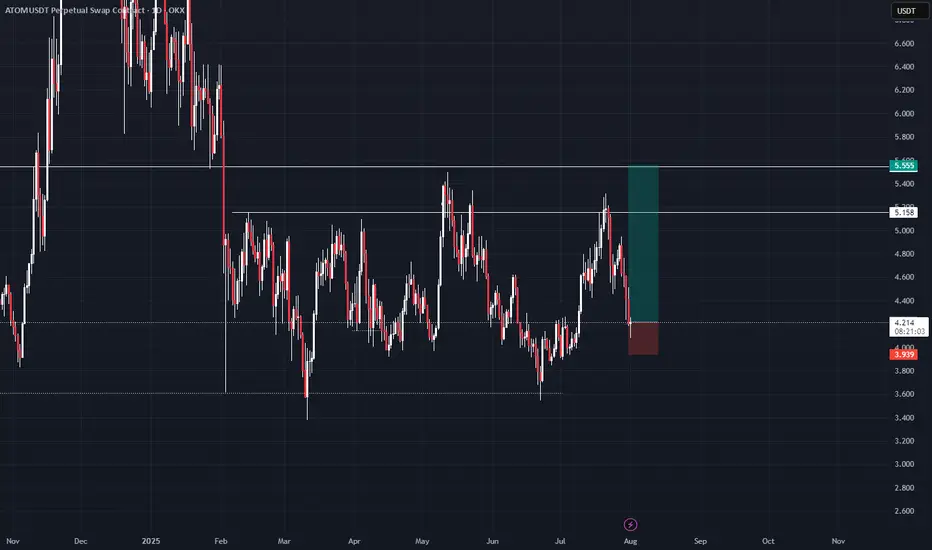
Cosmos 365 · Proof of Bullish · Bull Market Wave NextCosmos (ATOMUSDT) has been sideways for an entire year now. The current trading range is a long-term support, buy and accumulation zone. This zone is already proven to be a bullish launchpad based on late 2024. The same levels were active in August-October-November 2024 leading to a mild bullish wav

ATOM/USDT Weekly Analysis – Major Reversal Incoming?🔍 Technical Structure & Price Action:
ATOM has been in a prolonged downtrend since peaking at $44.80 in 2022, forming consistent lower highs and lower lows. However, the price has recently returned to a major long-term demand zone between $4.00 – $5.37, which has historically acted as a strong supp

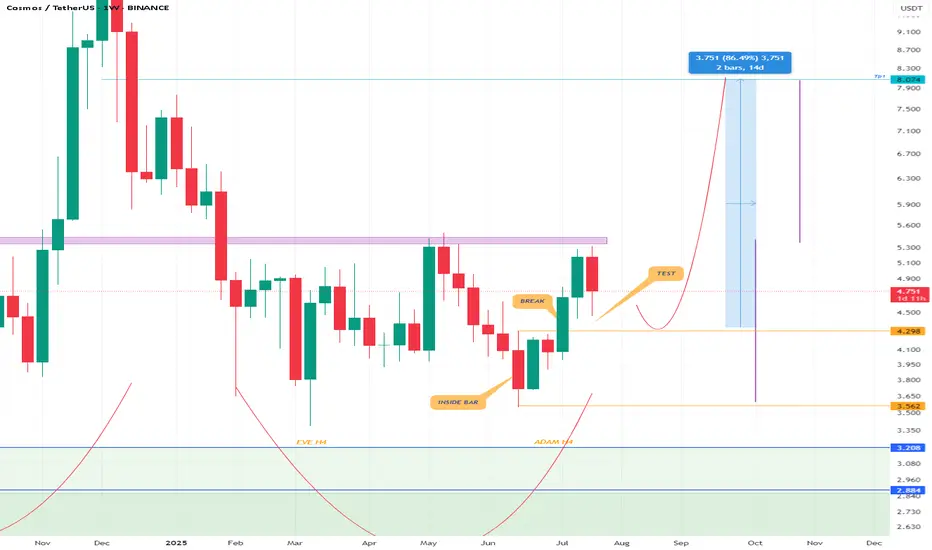
ATOMUSDTAtom has broken out of a good inside bar pattern and is testing it. I think most altcoins have this pattern on the weekly timeframe (you have to check the charts yourself and see what the charts tell you, not what people are emotionally saying on social media). I think the chart can move towards hig
See all ideas
Summarizing what the indicators are suggesting.
Oscillators
Neutral
SellBuy
Strong sellStrong buy
Strong sellSellNeutralBuyStrong buy
Oscillators
Neutral
SellBuy
Strong sellStrong buy
Strong sellSellNeutralBuyStrong buy
Summary
Neutral
SellBuy
Strong sellStrong buy
Strong sellSellNeutralBuyStrong buy
Summary
Neutral
SellBuy
Strong sellStrong buy
Strong sellSellNeutralBuyStrong buy
Summary
Neutral
SellBuy
Strong sellStrong buy
Strong sellSellNeutralBuyStrong buy
Moving Averages
Neutral
SellBuy
Strong sellStrong buy
Strong sellSellNeutralBuyStrong buy
Moving Averages
Neutral
SellBuy
Strong sellStrong buy
Strong sellSellNeutralBuyStrong buy
Displays a symbol's price movements over previous years to identify recurring trends.