Cosmos (ATOM): Looking For Break of Structure | Bullish AFOne of the most undervalued coins, ATOM, might be going for a decent BOS, which could open for us a smaller scalping opportunity. On a bigger timeframe, this coin is still a sleeper!
More in-depth info is in the video—enjoy!
Swallow Academy
Related pairs

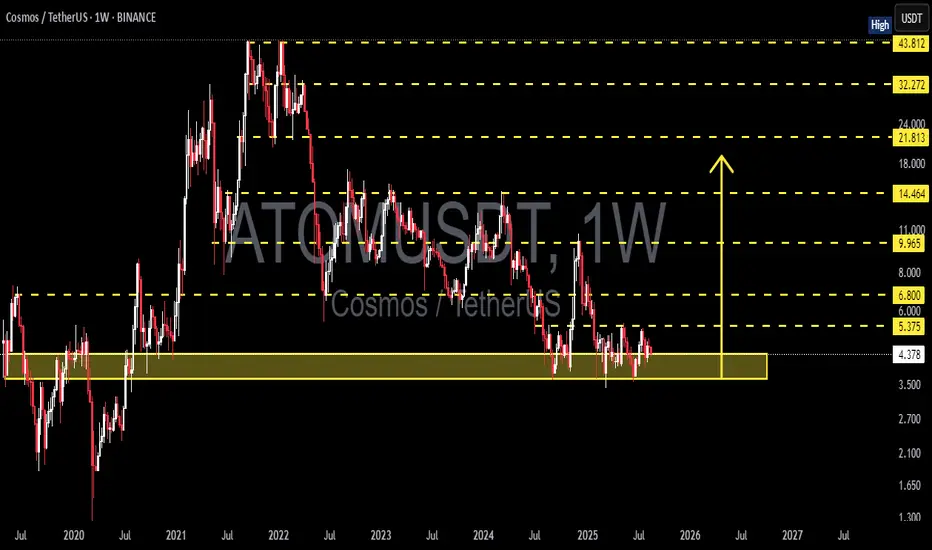
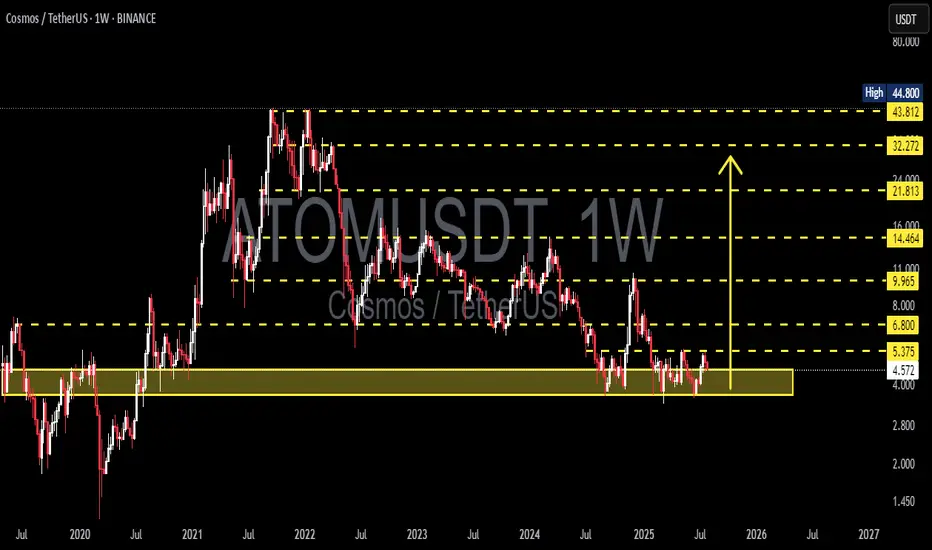
ATOM/USDT Weekly – Strong Accumulation, Is a Major Reversal?📊 Overview
The ATOM/USDT weekly chart shows that the price is currently in a long-term accumulation phase after a massive downtrend since 2022.
The 3.5–4.6 USDT demand zone has acted as a strong historical support level since 2020 and has once again proven its strength during 2024–2025.
In simple t
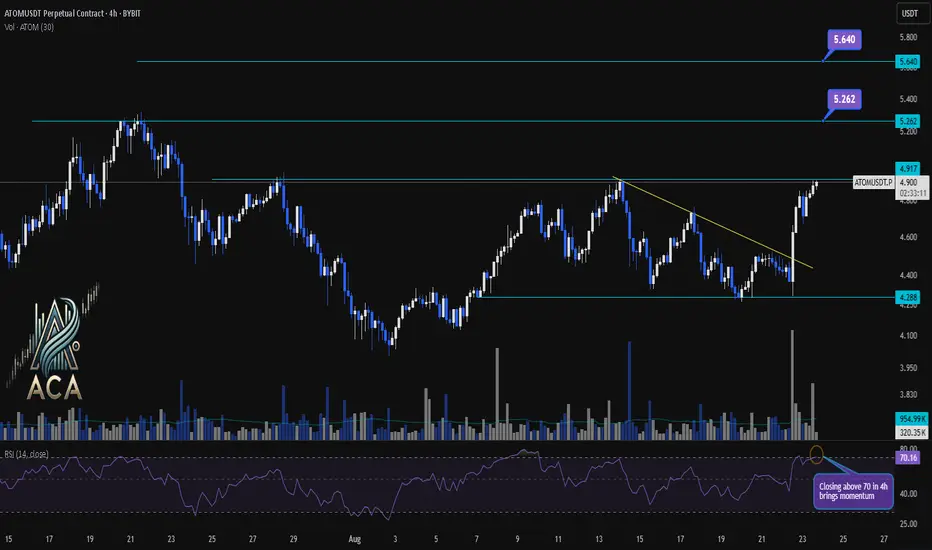
ATOMUSDT 4H Chart Analysis | Momentum Breakout in PlayATOMUSDT 4H Chart Analysis | Momentum Breakout in Play
🔍 Let’s dive into the ATOM/USDT perpetual contract and analyze the latest price action, outlining key bullish setups and momentum signals.
⏳ 4-Hour Overview
The 4-hour chart reveals a strong bullish push, with price surging above the trendli
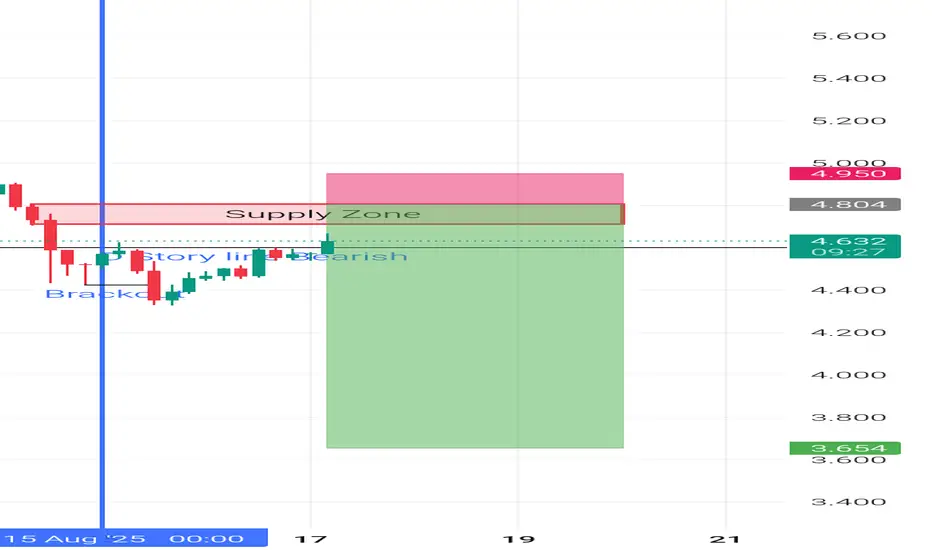
ATOM_USDT 4H Sell Trade.Atom is reaching to the 4H supply right now. When I added Fibonacci Indicator on the chart I can see Golden Pocket zone on that area. This is a good sing for Market revasal.Other wise Im expecting 15munutes divergence could be created. So keep watching on the Market to catch a good trade.
HAPPY TR
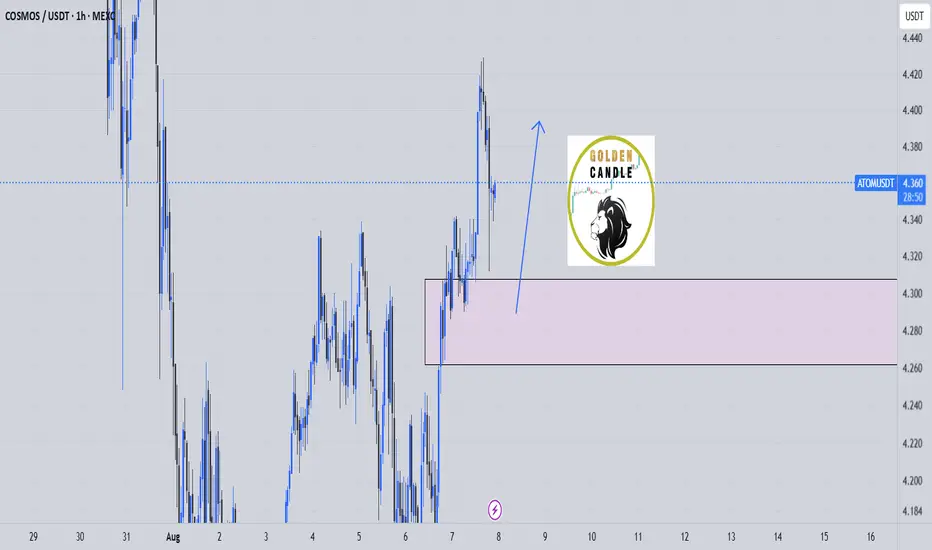
buy midterm atom "🌟 Welcome to Golden Candle! 🌟
We're a team of 📈 passionate traders 📉 who love sharing our 🔍 technical analysis insights 🔎 with the TradingView community. 🌎
Our goal is to provide 💡 valuable perspectives 💡 on market trends and patterns, but 🚫 please note that our analyses are not intended as buy o
Cosmos (ATOM): Seeing Potential 8% Movement Towards FVGAfter a successful H&S pattern, we are seeing a good opportunity to take a few long positions here on the ATOM coin, so that's what we are looking for: a potential 8% movement to happen here!
More in-depth info is in the video—enjoy!
Swallow Academy

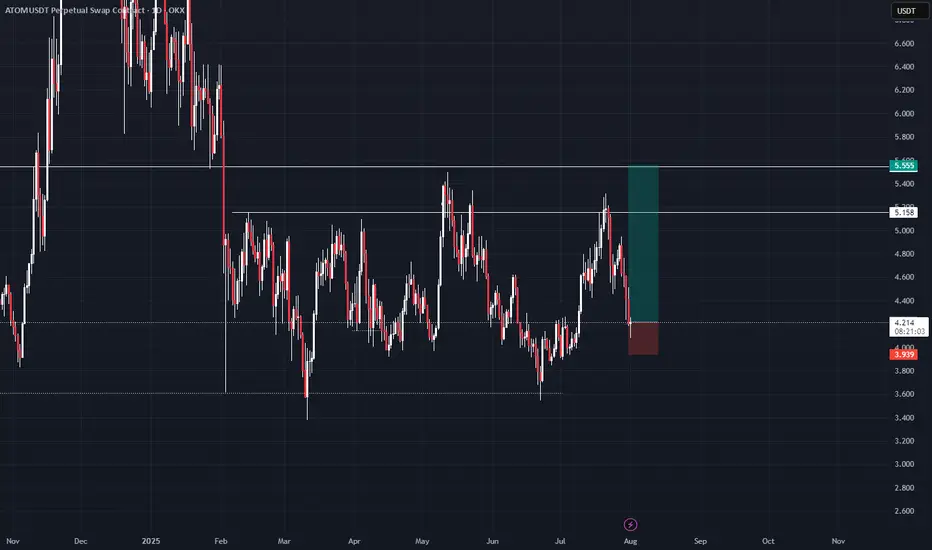
Cosmos 365 · Proof of Bullish · Bull Market Wave NextCosmos (ATOMUSDT) has been sideways for an entire year now. The current trading range is a long-term support, buy and accumulation zone. This zone is already proven to be a bullish launchpad based on late 2024. The same levels were active in August-October-November 2024 leading to a mild bullish wav

ATOMim thinking about that as a diviation from global diapozone so we have to at least test its lower boarder 5.555 that is my first target if we will return higher than 5.555 ill be looking for 11.4 as a swing target
ATOM/USDT Weekly Analysis – Major Reversal Incoming?🔍 Technical Structure & Price Action:
ATOM has been in a prolonged downtrend since peaking at $44.80 in 2022, forming consistent lower highs and lower lows. However, the price has recently returned to a major long-term demand zone between $4.00 – $5.37, which has historically acted as a strong supp
Cosmos (ATOM): Reached Major Support Area | Good Buying Moment?Cosmos has really good potential for good risk:reward if we see proper MSB to form so that's what we will be waiting for.
More in-depth info is in the video—enjoy!
Swallow Academy

See all ideas
Summarizing what the indicators are suggesting.
Oscillators
Neutral
SellBuy
Strong sellStrong buy
Strong sellSellNeutralBuyStrong buy
Oscillators
Neutral
SellBuy
Strong sellStrong buy
Strong sellSellNeutralBuyStrong buy
Summary
Neutral
SellBuy
Strong sellStrong buy
Strong sellSellNeutralBuyStrong buy
Summary
Neutral
SellBuy
Strong sellStrong buy
Strong sellSellNeutralBuyStrong buy
Summary
Neutral
SellBuy
Strong sellStrong buy
Strong sellSellNeutralBuyStrong buy
Moving Averages
Neutral
SellBuy
Strong sellStrong buy
Strong sellSellNeutralBuyStrong buy
Moving Averages
Neutral
SellBuy
Strong sellStrong buy
Strong sellSellNeutralBuyStrong buy
Displays a symbol's price movements over previous years to identify recurring trends.
Frequently Asked Questions
The current price of Cosmos / Tether (ATOM) is 4.8850 USDT — it has risen 1.34% in the past 24 hours. Try placing this info into the context by checking out what coins are also gaining and losing at the moment and seeing ATOM price chart.
Cosmos / Tether price has risen by 9.60% over the last week, its month performance shows a 4.01% increase, and as for the last year, Cosmos / Tether has increased by 4.12%. See more dynamics on ATOM price chart.
Keep track of coins' changes with our Crypto Coins Heatmap.
Keep track of coins' changes with our Crypto Coins Heatmap.
Cosmos / Tether (ATOM) reached its highest price on Sep 20, 2021 — it amounted to 44.7664 USDT. Find more insights on the ATOM price chart.
See the list of crypto gainers and choose what best fits your strategy.
See the list of crypto gainers and choose what best fits your strategy.
Cosmos / Tether (ATOM) reached the lowest price of 1.0704 USDT on Mar 13, 2020. View more Cosmos / Tether dynamics on the price chart.
See the list of crypto losers to find unexpected opportunities.
See the list of crypto losers to find unexpected opportunities.
The safest choice when buying ATOM is to go to a well-known crypto exchange. Some of the popular names are Binance, Coinbase, Kraken. But you'll have to find a reliable broker and create an account first. You can trade ATOM right from TradingView charts — just choose a broker and connect to your account.
Crypto markets are famous for their volatility, so one should study all the available stats before adding crypto assets to their portfolio. Very often it's technical analysis that comes in handy. We prepared technical ratings for Cosmos / Tether (ATOM): today its technical analysis shows the buy signal, and according to the 1 week rating ATOM shows the buy signal. And you'd better dig deeper and study 1 month rating too — it's sell. Find inspiration in Cosmos / Tether trading ideas and keep track of what's moving crypto markets with our crypto news feed.
Cosmos / Tether (ATOM) is just as reliable as any other crypto asset — this corner of the world market is highly volatile. Today, for instance, Cosmos / Tether is estimated as 5.60% volatile. The only thing it means is that you must prepare and examine all available information before making a decision. And if you're not sure about Cosmos / Tether, you can find more inspiration in our curated watchlists.
You can discuss Cosmos / Tether (ATOM) with other users in our public chats, Minds or in the comments to Ideas.