Cosmos (ATOM): Looking For Break of Structure | Bullish AFOne of the most undervalued coins, ATOM, might be going for a decent BOS, which could open for us a smaller scalping opportunity. On a bigger timeframe, this coin is still a sleeper!
More in-depth info is in the video—enjoy!
Swallow Academy
ATOMUSDT trade ideas

ATOM/USDT Weekly – Strong Accumulation, Is a Major Reversal?📊 Overview
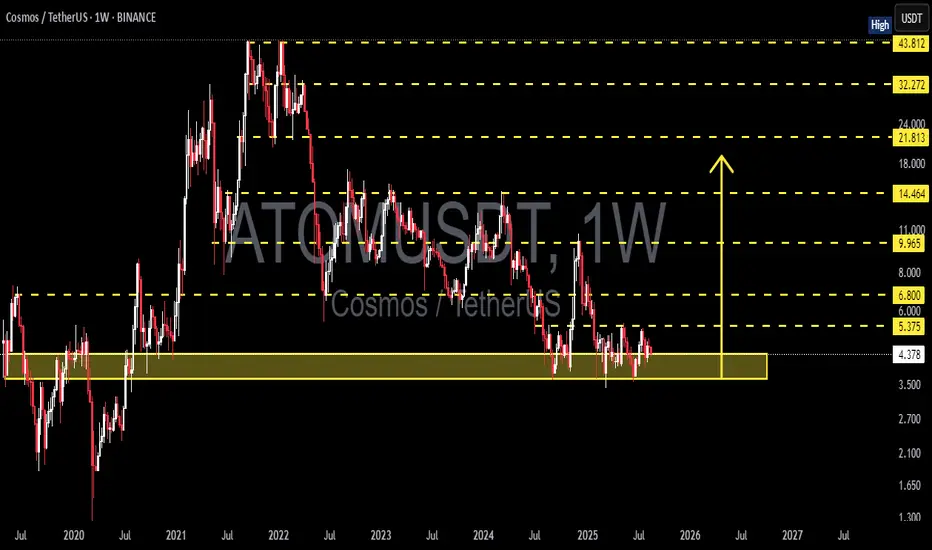
The ATOM/USDT weekly chart shows that the price is currently in a long-term accumulation phase after a massive downtrend since 2022.
The 3.5–4.6 USDT demand zone has acted as a strong historical support level since 2020 and has once again proven its strength during 2024–2025.
In simple terms, this area is the “last defense” zone for buyers and could determine whether ATOM will start a new bullish cycle or face a deeper breakdown.
---
🔹 Structure & Pattern Analysis
Macro Pattern: ATOM has formed a wide sideways/base structure near the multi-year demand, signaling potential accumulation by smart money.
Key resistance (short-term): 5.375 – 6.00 USDT, the first gate to confirm a bullish reversal.
Further resistances: 6.80 → 9.96 → 14.46 (strong mid-cycle supply).
If broken: The path opens toward 21.81 – 32.27 USDT, aligning with higher timeframe resistances.
---
✅ Bullish Scenario
1. Price continues to hold above the 3.5–4.6 demand zone, showing strong buyer presence.
2. A confirmed breakout above 5.375 with volume could shift market structure into a new Higher High (HH) formation.
3. Bullish targets:
6.00 → 6.80 (first resistance levels)
9.96 → 14.46 (major supply zone)
Extended targets: 21.81 – 32.27 USDT
📌 Bullish confirmation: A solid weekly close above 6.00 USDT.
---
❌ Bearish Scenario
1. Rejection from 5.3–6.0 resistance may drag price back toward the middle of the current range.
2. A decisive weekly close below 3.50 would invalidate the accumulation structure and open downside continuation:
2.70 → 2.10
Possible extension: 1.65 – 1.30 USDT (historical supports).
📌 Bearish confirmation: Consistent weekly closes below 3.50 USDT.
---
🎯 Conclusion
The 3.5–4.6 zone remains the ultimate pivot: hold = bullish potential, breakdown = deeper downside.
5.375–6.00 acts as the breakout trigger zone: clearing this level may spark a major reversal trend.
Currently, ATOM is in a long-term accumulation range, waiting for a decisive breakout.
#ATOM #Cosmos #ATOMUSDT #CryptoAnalysis #PriceAction #SupportResistance #SwingTrade #WeeklyChart
ATOMUSDT 4H Chart Analysis | Momentum Breakout in PlayATOMUSDT 4H Chart Analysis | Momentum Breakout in Play
🔍 Let’s dive into the ATOM/USDT perpetual contract and analyze the latest price action, outlining key bullish setups and momentum signals.
⏳ 4-Hour Overview
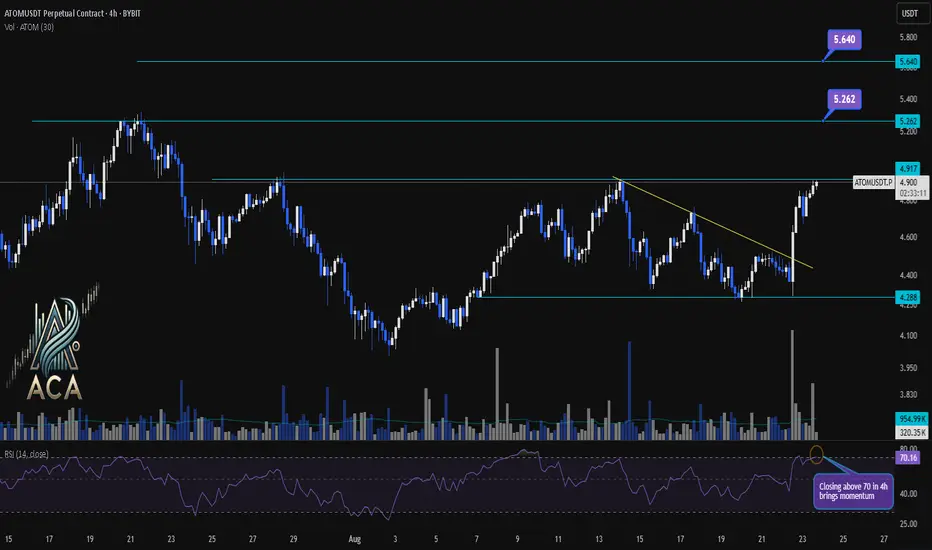
The 4-hour chart reveals a strong bullish push, with price surging above the trendline resistance and reclaiming the local $4.917 zone. Volume has notably increased, confirming the move’s strength. Meanwhile, the RSI indicator is closing above 70, marking the overbought territory and highlighting a surge in buyer momentum.
🔺 Long Setup:
On the upside, sustained momentum could ignite a rally toward $5.262 first, with a further target at $5.640 should follow-through buying persist. These levels line up with previous resistance zones and potential trend-based extensions.
📊 Key Highlights:
- 4H breakout confirms bullish bias and momentum shift.
- Volume spike adds conviction to the move.
- RSI closing above 70 signals strong momentum; a continuation could bring further upside.
- Short-term resistance targets are $5.262 and $5.640.
- “Closing above 70 in 4h brings momentum” — if sustained, might hint at a new trend leg.
🚨 Conclusion:
ATOM/USDT is showcasing renewed bullish momentum. Watch for confirmations above resistance and be mindful of short-term exhaustion signals in the overbought zone. If momentum holds, upside targets at $5.262 and $5.640 are in play.
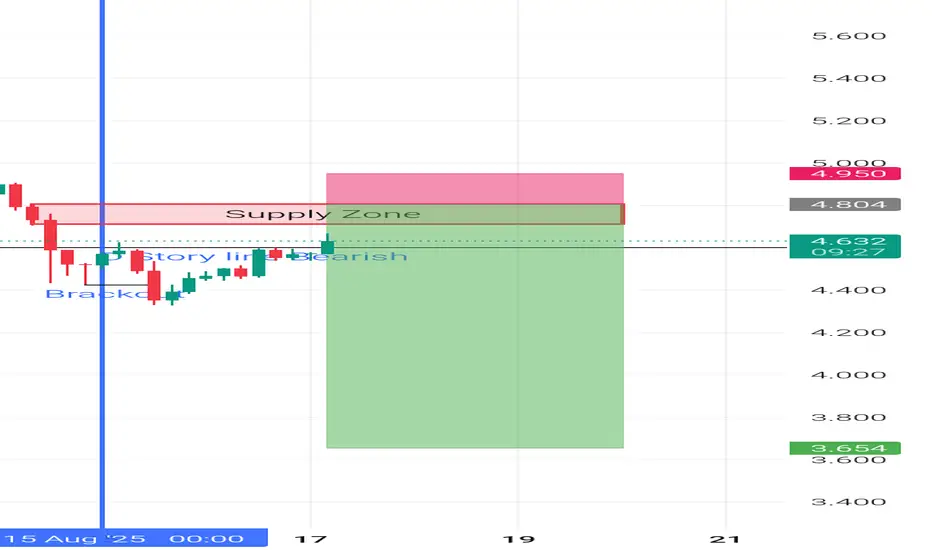
ATOM_USDT 4H Sell Trade.Atom is reaching to the 4H supply right now. When I added Fibonacci Indicator on the chart I can see Golden Pocket zone on that area. This is a good sing for Market revasal.Other wise Im expecting 15munutes divergence could be created. So keep watching on the Market to catch a good trade.
HAPPY TRADING 🎉
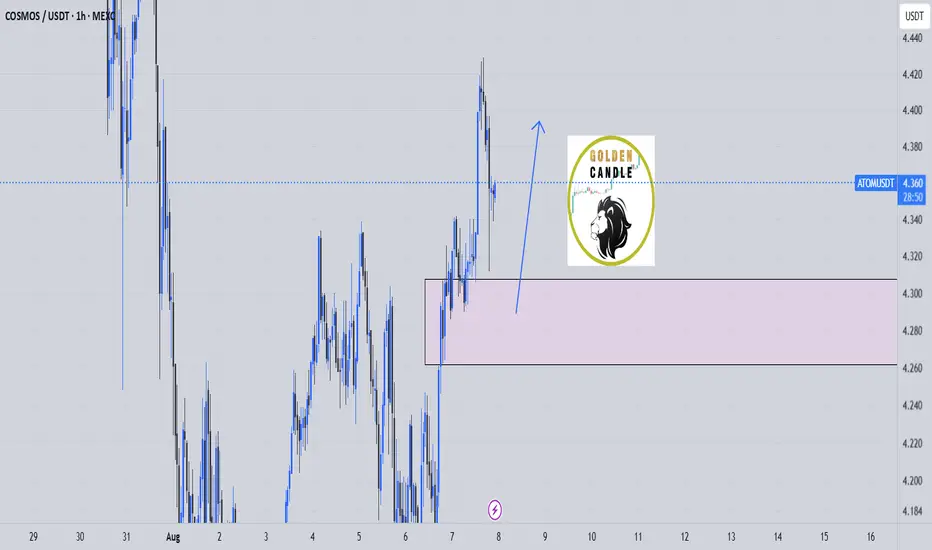
buy midterm atom "🌟 Welcome to Golden Candle! 🌟
We're a team of 📈 passionate traders 📉 who love sharing our 🔍 technical analysis insights 🔎 with the TradingView community. 🌎
Our goal is to provide 💡 valuable perspectives 💡 on market trends and patterns, but 🚫 please note that our analyses are not intended as buy or sell recommendations. 🚫
Instead, they reflect our own 💭 personal attitudes and thoughts. 💭
Follow along and 📚 learn 📚 from our analyses! 📊💡"
Cosmos (ATOM): Seeing Potential 8% Movement Towards FVGAfter a successful H&S pattern, we are seeing a good opportunity to take a few long positions here on the ATOM coin, so that's what we are looking for: a potential 8% movement to happen here!
More in-depth info is in the video—enjoy!
Swallow Academy

Cosmos 365 · Proof of Bullish · Bull Market Wave NextCosmos (ATOMUSDT) has been sideways for an entire year now. The current trading range is a long-term support, buy and accumulation zone. This zone is already proven to be a bullish launchpad based on late 2024. The same levels were active in August-October-November 2024 leading to a mild bullish wave. This is only the start.
The same support range is activated again in Febraury-March-April-May-June-July-August 2025 and this will lead to a major bullish wave. Notice that the first period of consolidation lasted only three months and thus we had a mild wave only. With now six full months of consolidation the next bullish wave will be at least twice as big. But the market and how participants act and react doesn't work linearly. A six months consolidation period can lead to a bullish wave that is 3-5 times stronger than the previous one.
What you are seeing right now is actually pretty good. ATOMUSDT is red, yes. Notice weeks of bearish action yet no new lows, no significant challenge of support. More sideways which is as bullish as it gets. We already saw many examples of a downtrend and how the market goes lower and lower always producing new lows. This scenario is far from being what is present on the chart.
ATOM has been dropping for weeks but its price isn't affected that much negatively because this is only a minor retrace. An intermediary pause. The positive side of this type of market behavior is how it tends to unravel. It goes from quiet and shy to fast, surprising and unexpected. The market can change any day.
You can start seeing bullish action tomorrow just as it can start next week or the week above. The retrace has been going long enough and it lacks volume and momentum, sellers are running dry; when momentum dies down, the market turns.
Look at Bitcoin, it isn't dropping anymore. It stopped at the previous high and so far this is a strong support. Even if it moves lower, we continue bullish above $100K long-term. It is normal for a small pause before additional growth. $15 is an easy target, ATOM can grow much more in the coming months. Late 2025-early 2026 are the best dates for higher prices. Buy now and hold.
Namaste.

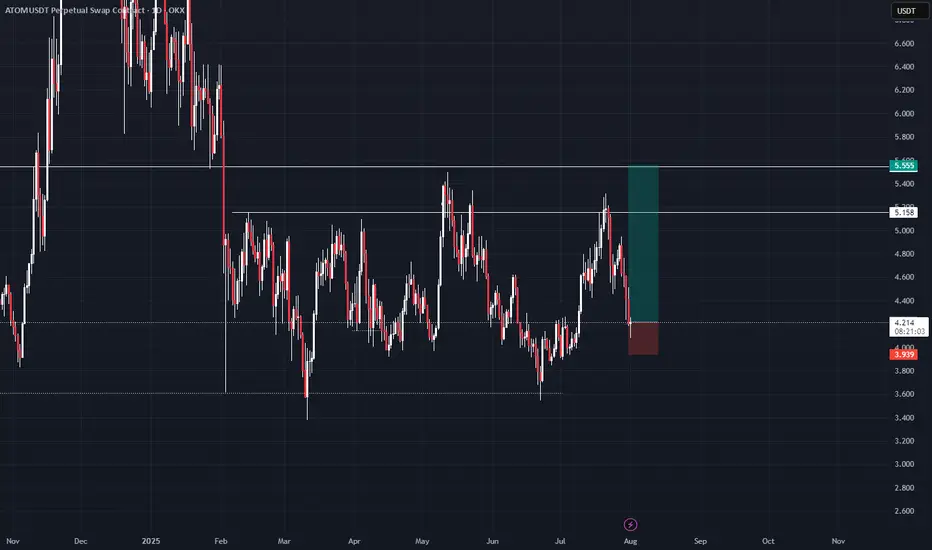
ATOMim thinking about that as a diviation from global diapozone so we have to at least test its lower boarder 5.555 that is my first target if we will return higher than 5.555 ill be looking for 11.4 as a swing target
ATOM/USDT Weekly Analysis – Major Reversal Incoming?🔍 Technical Structure & Price Action:
ATOM has been in a prolonged downtrend since peaking at $44.80 in 2022, forming consistent lower highs and lower lows. However, the price has recently returned to a major long-term demand zone between $4.00 – $5.37, which has historically acted as a strong support since 2020.
The price is showing a bullish reaction from this level, indicating a potential trend reversal or relief rally.
---
🧱 Key Levels & Technical Zones:
Level Role
$4.00 - $5.37 Major Historical Demand Zone (Strong Support) 🟨
$6.80 Minor Resistance & Double Bottom Neckline
$9.96 Mid-Term Key Resistance
$14.46 Next Bullish Target If Breakout Holds
$21.81 Major Resistance Ahead
$32.27 - $43.81 Long-Term Distribution Zone / ATH Range
$44.80 All-Time High (ATH)
---
📐 Patterns and Price Behavior:
🟡 1. Potential Double Bottom (Reversal Pattern)
The price appears to be forming a double bottom structure with a neckline around $6.80. A successful breakout above this level could signal a confirmed trend reversal.
🟡 2. Sideways Accumulation
ATOM has been ranging sideways within a tight zone, suggesting institutional accumulation before a possible impulse breakout.
🟡 3. Volume Compression
Declining volume near support often precedes a strong breakout move, either up or down.
---
✅ Bullish Scenario:
Price continues to hold above the $4.00 – $5.37 demand zone.
If weekly candle closes above $6.80, bullish confirmation is triggered.
Potential targets:
Short-Term: $9.96
Mid-Term: $14.46 – $21.81
Long-Term: $32.27 – $43.81 (if momentum sustains)
📈 Confirmation Signs:
Break and weekly close above $6.80
Increasing breakout volume
RSI divergence from oversold territory
---
⚠️ Bearish Scenario:
If price breaks down below $4.00, bears could regain control.
Possible downside targets:
Next Support: $2.80
Breakdown invalidates the double bottom structure
Continuation of macro downtrend likely
📉 Confirmation Signs:
Strong weekly close below $4.00
Spike in selling volume
Failure to break $6.80 resistance
---
🎯 Conclusion & Strategy:
ATOM is sitting at a make-or-break level, where a strong historical support zone meets growing bullish momentum. If bulls manage to break above $6.80, it could trigger a multi-week rally toward mid-term targets. This setup presents a high reward-to-risk opportunity if managed correctly.
---
⚙️ Trading Strategy Suggestion:
Aggressive Entry: Within $5.00 - $5.37 zone, stop loss below $4.00
Conservative Entry: After confirmed breakout above $6.80
Take-Profit Zones: $9.96 → $14.46 → $21.81
Risk Management is a MUST 🚨
#ATOMUSDT #Cosmos #CryptoAnalysis #DoubleBottom #AltcoinOutlook #TechnicalAnalysis #SupportResistance #PriceAction #CryptoTrading #BreakoutWatch #TrendReversal
Cosmos (ATOM): Reached Major Support Area | Good Buying Moment?Cosmos has really good potential for good risk:reward if we see proper MSB to form so that's what we will be waiting for.
More in-depth info is in the video—enjoy!
Swallow Academy

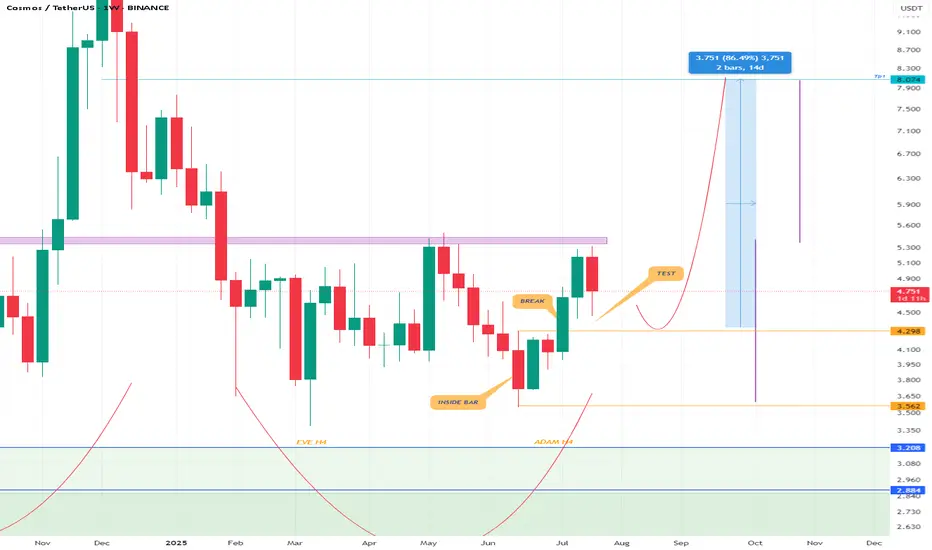
ATOMUSDTAtom has broken out of a good inside bar pattern and is testing it. I think most altcoins have this pattern on the weekly timeframe (you have to check the charts yourself and see what the charts tell you, not what people are emotionally saying on social media). I think the chart can move towards higher targets after testing the top of the inside bar.
Cosmos (Atom)Atom usdt Daily analysis
Time frame daily
We have 2 models of analysis
1. The green line. Price can't break the resistance line and fall down to 3.5$
2. Price can break the resistance (gray line) and pump to 9$
Therfore we must watch the reaction of price and resistance

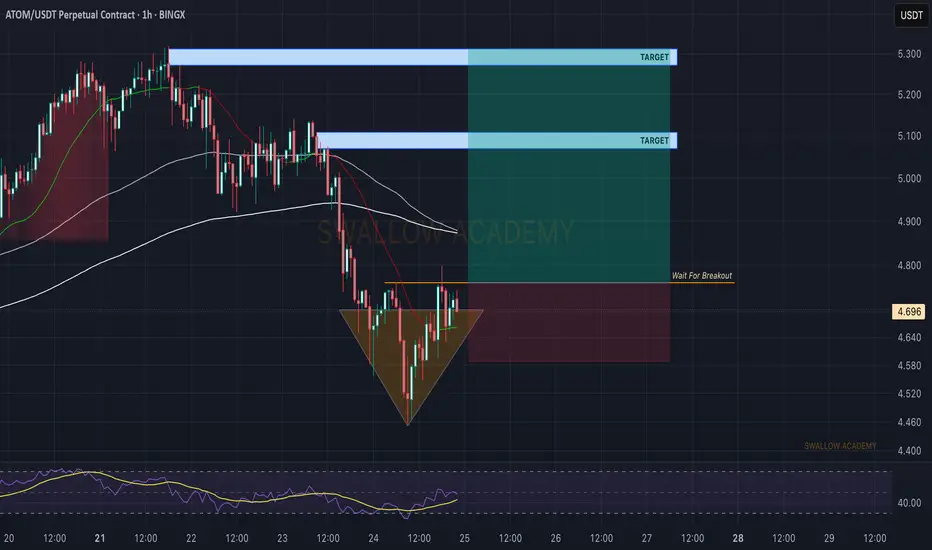
Cosmos (ATOM): Waiting Is Key | Potential Breakout IncomingCosmos might have a good buying opportunity soon, where we are looking for a proper MSB, which would confirm our bullish scenario for this setup here.
As soon as we get the MSB, we are going to look for a buying opportunity.
Swallow Academy
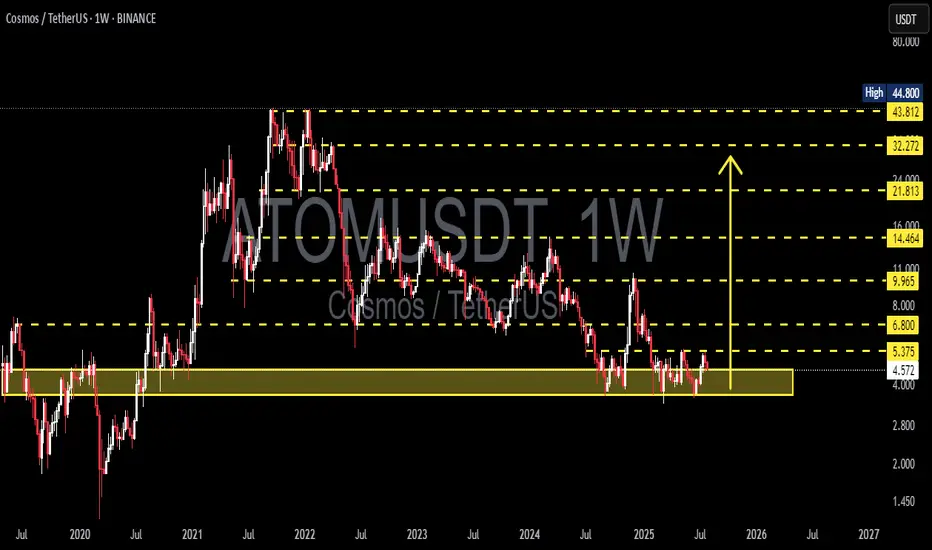
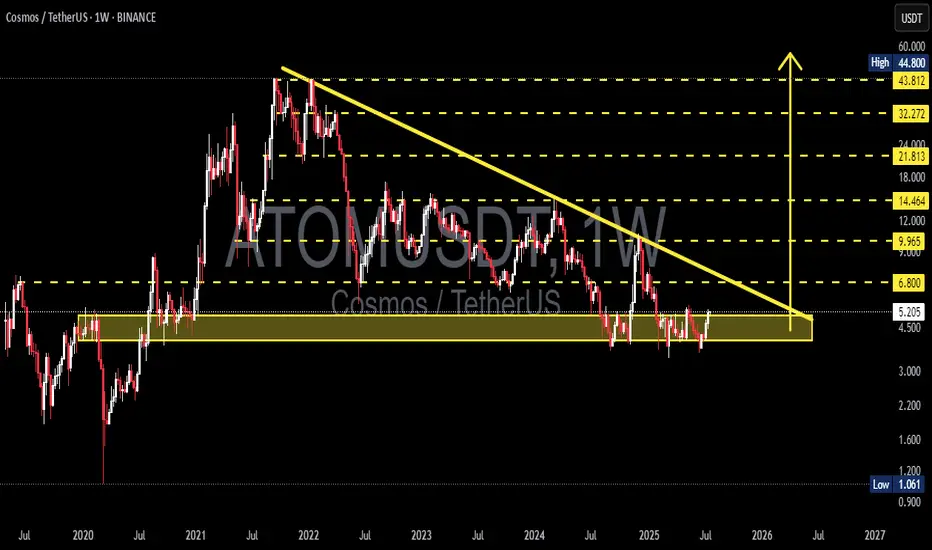
ATOM/USDT – Long-Term Accumulation Phase Nearing Breakout?📊 Full Technical Breakdown:
🟡 Long-Term Accumulation Zone
ATOM is currently trading within a horizontal accumulation zone between $4.50 and $5.20, which has held strong since early 2021. This key area has acted as a solid floor across multiple market cycles, suggesting strong buying interest from long-term holders or institutional participants.
🔻 Descending Trendline Resistance
Since reaching its all-time high (~$44.8) in late 2021, ATOM has been in a sustained downtrend, forming a descending trendline acting as dynamic resistance. The price is now retesting this line for the first time in months, hinting at a potential trend reversal setup if broken.
🧱 Potential Descending Triangle Breakout
The current structure closely resembles a Descending Triangle, with a flat base of support and a descending resistance line. While typically a bearish continuation pattern, in this context — combined with prolonged oversold conditions — it may serve as a bear trap and precede a major breakout.
✅ Bullish Scenario (Confirmed Breakout & Trend Reversal):
If ATOM breaks and closes weekly above $6.80, the breakout could trigger a powerful move, marking the start of a new macro bullish phase.
📈 Upside targets based on historical resistance levels:
📍 $9.96 → former short-term resistance
📍 $14.46 → previous support-turned-resistance
📍 $21.81 → major structural breakdown point
📍 $32.27 → upper resistance zone
🎯 $43.81 – $44.80 → All-Time High (ATH) zone
🟢 Potential upside: Over 700% from current levels if breakout is validated with strong momentum and volume.
❌ Bearish Scenario (Rejection & Breakdown):
If price gets rejected at the trendline and breaks below the $4.50 accumulation floor:
📉 Downside targets to watch:
🔻 $3.00 → previous minor support
🔻 $2.20 → pandemic-era support zone
🔻 $1.06 → historical bottom (2020)
This would confirm a continuation of the macro downtrend and indicate that further accumulation is needed before any major reversal.
📌 Key Technical Confirmation Signals:
Weekly Volume: A true breakout must be supported by a volume spike well above the weekly average.
RSI (Relative Strength Index): A move above 50 on the weekly RSI would support a bullish thesis.
Bullish Divergence (on lower timeframes): Would strengthen the breakout probability.
🔮 Strategic Takeaway:
ATOM is at a make-or-break level. With a long period of sideways consolidation and tightening price action, a high-volatility move is imminent.
> For long-term investors, this zone offers a high reward-to-risk opportunity. For traders, it's time to prepare for a confirmed breakout or rejection trade setup.
#ATOMUSDT #CosmosAnalysis #CryptoBreakout #TechnicalAnalysis #DescendingTriangle #BullishSetup #AltcoinSeason #CryptoMomentum #AccumulationZone #TrendReversal #CryptoSignals
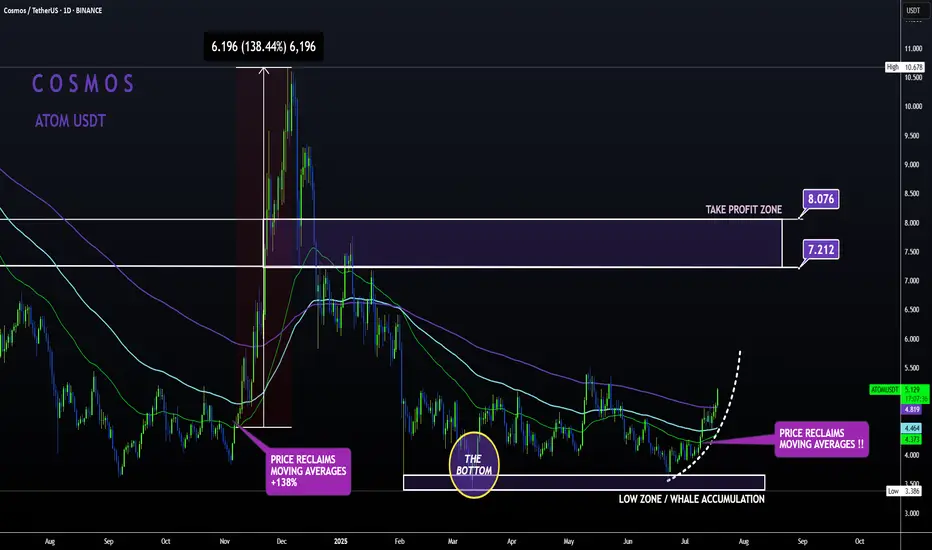
ATOM Sleeping GIANT ALT | Moving Averages BULLISH like NOV24'ATOM is slowly but surely making a turn up towards the first Take Profit point.
From the bottom, Cosmos has already increased a whopping 52% , with even more room to grow:
In my previous update, the 4 was still bearish when looking at trend lines and moving averages.
However, this has flipped to bullish from the 4h upward, with the price trading high above the moving averages in the 4h and in the daily timeframe:
4H:
Daily:
Note how previously, the big increases started as soon as the price regained the moving averages as support.
ATOMUSDTHello, the Atom currency has several reversal patterns in its price floor and accumulation. On the daily time frame, we can see an ADAM and EVE. If we look from a more distant perspective, a twin bottom has also formed in the weekly time frame as an extension that seems to be able to grow well. If you are familiar with harmonic patterns, we can see a good harmonic pattern that can be seen as a butterfly or a crab. Of course, W patterns are usually considered the same as the twin bottom (this is my personal opinion). Good luck.

Cosmos (ATOM) Trading At Bottom · Bear Markets End ForeverCosmos is still trading near its market bottom, the "opportunity buy zone" as I call it. This is nothing more than great news.
Remember how I mentioned that some pairs are really advanced, trading already very high and this is risky if you want to go LONG? Well, when projects are trading near the bottom of the range; support, all-time lows, this is great news because there is little room for lower and plenty of room for prices to grow. ATOMUSDT is now in this highly desirable situation.
This a trading pair that is "yet to move."
It is awesome.
Potential for growth goes beyond the chart, literally. The chart you are seeing here now does not show the potential ATOMUSDT has for growth. The size of the candles should tell you everything you need know.
Bullish waves, corrections, bullish waves and corrections and see how small the candles are. Compare to the action in 2021 and you know we are looking at a true bottom. This opportunity does not repeat often and with the market evolving as it is evolving now, this might be the last chance in the history of Cryptocurrency to buy this low.
This is because we are entering an extended bull market that will last for years to come. When a new bear market develops, a long-term correction, it will be nothing like before. Instead of down, down, down forever, we will have some sideways then down, a strong swing followed by a recovery and additional growth. Just like Bitcoin. Look at Bitcoin since November 2022, that is how most of the big altcoins projects will evolve.
The wild-wild west of Crypto is going to an end. Think of it this way, Cryptocurrencies credit application has been approved.
Remember how the bear markets became shorter and the bull markets longer when the Federal Reserve came into the picture in the early 20th century? That is because with credit easily available, there was no more need for the companies to crash nor take a long time to recover from a major downturn. Here the situation is the same.
With the Cryptocurrency market now being accepted as the amazing technology that it is, we have access to credit. Instead of long and wild crashes, we will have short-term corrections. In short, demand will be too strong for the market to stay depressed for too long.
There will always be corrections of course, night and day (market cycles), but from now on, these will be short.
Namaste.
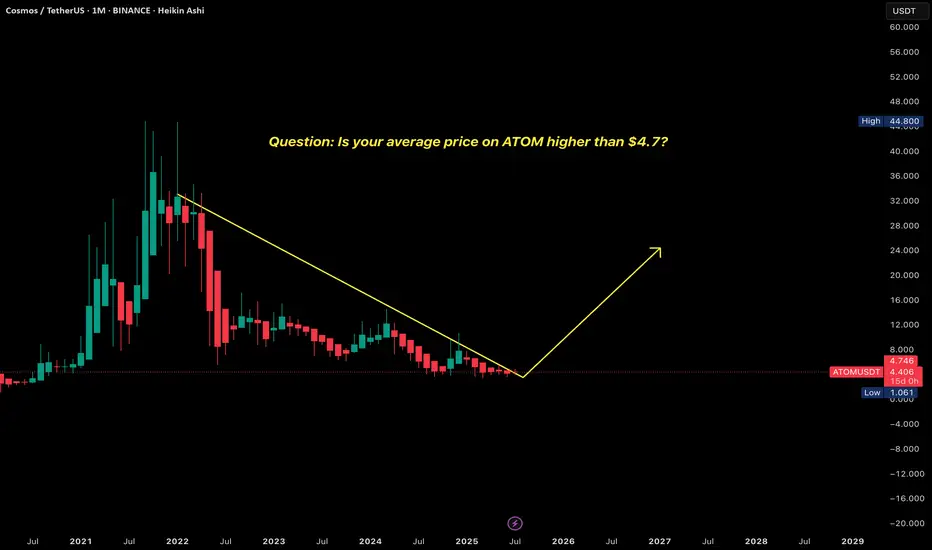
Question: Is your average price on ATOM higher than $4.7?ATOMUSDT – Market Commentary & Buy Strategy
Question: Is your average price on ATOM higher than $4.7?
If you've been buying since post-2022, chances are you're stuck—2023, 2024, and half of 2025 have kept ATOM holders sidelined while the total market cap soared from $1100B to $3700B.
Current Status:
ATOM peaked at $40 (2022–2025 cycle) and has just formed a Weekly (W) bottom this week at $4.7.
However:
No official BUY recommendation yet because the Monthly (M) timeframe is still declining and needs more time to finalize its bottom—possibly 1-2 more months of sideways accumulation around $4.7.
Strategy:
Prioritize tokens where W + M both have bottomed.
Wait for ATOM’s Monthly bottom confirmation.
Once confirmed, we’ll enter Swing positions targeting the next major wave.
TLDR:
Don’t rush ATOM yet. Let it finish the Monthly bottom. Then we buy Swing.
ATOMUSDT Channel Breakout Alert!ATOMUSDT Technical analysis update
NASDAQ:ATOM is bouncing from a major support zone and has formed a descending channel at the bottom of the zone on the 4H chart. Currently, the price is breaking above the channel's trend resistance and trading above both the 50 and 100 EMAs on the 4H timeframe — a bullish signal for ATOM.

Cosmos (ATOM): Seeing Good Buying Opportunity | BULLISH AFCosmos is pushing strongly, giving us a sign of potential upward movement to happen anytime soon. So let's keep an eye on the 200 EMA and wait for a breakout from there.
More in-depth info is in the video—enjoy!
Swallow Academy

ATOM 4H – Potential Wave 3 Impulse SetupAfter a completed 5-wave impulse (likely Wave 1), followed by a corrective Wave 2, ATOM appears to be setting up for a potential Wave 3 to the upside based on Elliott Wave Theory.
This setup aligns with the idea of Wave 3 being typically the strongest and most extended move in the cycle.
📍Entry Zone: $3.90 – $4.30
🎯Take Profit (TP): $6.463
🛑Stop Loss (SL): $3.70
🌀Risk-Reward: Approx. 4:1

ATOMUSDT Demand Zone Battle Bullish Rally or Final FlushATOM/USDT is currently consolidating within a long-term descending structure, hovering just above a critical demand confluence between $3.42 and $4.10. This area marks the Immediate Demand Zone, where buyers have historically stepped in, and price action is once again testing its resilience after multiple touches.
A decisive breakout above the $5.47 resistance level, which aligns with the descending trendline from the macro highs, would validate a bullish reversal structure. This could open the path for a multi-leg rally targeting $11.36 in the medium term and $31.09 in the long term, corresponding with historical supply and Fibonacci extension zones.
However, failure to hold the current support zone could accelerate a move toward the deeper Extreme External Demand Zone between $2.15 and $2.590.
The current consolidation carries the potential for both structural reversal and final flush out, and we should closely monitor price behavior around $5.47 for confirmation of directional bias.

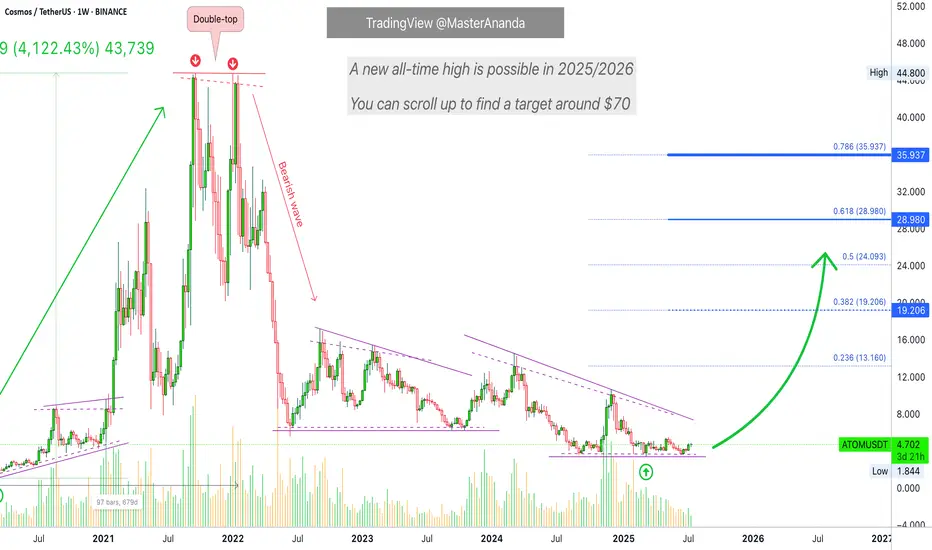
Cosmos (ATOM) $70 New All-Time High, Market Dynamics & MoreCurrent price for ATOMUSDT matches the low from September 2020. The same range was also active in July of the same year and between December 2019 and February 2020.
From a low point in March 2020 Cosmos (ATOMUSDT) grew 4,122% to peak in September 2021. Giving us a 560 days long bull market.
The double-top in January 2022 extended the bull market to a total of 679 days. Those that didn't sell in September 2021, after a correction, had an additional month to sell at the highest possible.
Back in those days we had a rising bottom after the all-time low. This time around we have a stable (flat) bottom.
The lowest price for Cosmos happened March 2025. A one year long bull market would give us a top around March 2026. If we get 560 days like last time this would give us a top around September 2026. Compare this to September 2021, same month. Things will be pretty interesting that's for sure.
We cannot generalize anymore and each pair/project needs to be considered individually.
For example, Ethereum hit bottom June 2022, here Cosmos hit bottom March 2025, huge difference. Many projects bottomed also mid-2022 but others bottomed around August 2023, others August 2024 and many others just recently, 7-April 2025 and some even last month.
We are entering uncharted territory.
The big projects and the ones with ETFs will have their own charts. Corrections will be minimal and we cannot expect the same highly volatile and crazy dynamics as when Crypto was underground, it is public now and it has all the attention in the world. The altcoins can't crash down too strong when everybody is waiting to buy when prices go low.
The flat bottom in 2024-2025 for Cosmos can tell of two things: 1) There is the possibility of one final flush, lasting only a few hours or days and this would mark the start of the next bullish phase. Or, 2) the next cycle can start uneventfully. Normally there is always a strong shakeout before the change in trend.
A pair can grow for years, as some projects are already doing based on higher lows while others can be doing things differently.
I am just trying to get the point across that each project needs to be considered individually, this is very important for the future because everything is changing now but the effect will be felt only after many months. Even the bear market will spread out; not like before. The bull market is very likely to be extended because the projects move in groups and since the market is so big now it will take time for each group to jump.
Start late, ends late.
This chart allows for a new all-time high. $70 is the standard projection and I should say also the minimum. But this one is tricky because of the chart structure. It can also end with no new all-time high so all will depend on the demand. How strong is the project, the team behind it, how active are the participants, etc.
There will be enough capital for everything to shine but only those with a plan and the right tools will attract our attention. It is a huge game, competition is very strong. Those that neglect their projects are likely to stay behind. Those that are active with a positive mindset and plan, should come to the front.
You know how it is... Regardless of any individual project, Crypto is going up.
Namaste.
