ATOM at a Crossroads: Breakout or Rejection?ATOM just pulled off a little victory, sneaking past the moving average—but the real show starts if it can break through that thick red Ichimoku cloud. The big question: will it act as a resistance wall or a launchpad for a move up? That all depends on us holding above that circled area. The market’s a bloodbath right now, but if we’re gonna see a turnaround, this looks like a prime spot. Targets marked on the chart—now we wait. Fingers crossed! 🤞🔥
ATOMUSDT trade ideas
$ATOM Ready for Liftoff – 100%+ Move on the TableNASDAQ:ATOM has just broken out of the trendline and is converting the major resistance into support.
This breakout could be the start of something huge - the chart shows potential 100 %+ movement ahead of it.
Looking forward to a retest around the $4.73 mark before the next move upwards towards $10+.
Momentum looks solid, this could take off soon 🚀
Retweet if you are bullish!
#ATOM #Altseason2025

$ATOM Breakout Above Key Resistance – Bullish ReversalNASDAQ:ATOM has just broken through a key resistance zone, reclaiming the 100 EMA with confidence and confirming a strong trend reversal.
This move has triggered a powerful breakout, backed by volume and bullish price structure.
DYOR, NFA

ATOM/USDT review chart 4HHello everyone, let's look at the 4H ATOM chart for USDT, in this situation we can see how the price has affected from the upper limit of the downward trend channel, however, staying in the upper part of the channel. Going further, let's check the places of potential target for the price:
T1 = $ 4.79
T2 = $ 5,26
Т3 = 5.63 $
Let's go to Stop-Loss now in case of further declines on the market:
SL1 = $ 4.29
SL2 = $ 4.02
SL3 = $ 3,57
Looking at the RSI indicator, you can see a healthy relaxation crossing the lower limit, which produces space for a potentially new growth movement. The MacD indicator that has returned to the center of the range, which also creates potential for upward movement.

atom buy midterm "🌟 Welcome to Golden Candle! 🌟
We're a team of 📈 passionate traders 📉 who love sharing our 🔍 technical analysis insights 🔎 with the TradingView community. 🌎
Our goal is to provide 💡 valuable perspectives 💡 on market trends and patterns, but 🚫 please note that our analyses are not intended as buy or sell recommendations. 🚫
Instead, they reflect our own 💭 personal attitudes and thoughts. 💭
Follow along and 📚 learn 📚 from our analyses! 📊💡"

ATOMUSDT 1D AnalysisATOM ~ 1D Analysis
#ATOM Buy after successfully penetrating this resistant line with a short -term target of at least 10%+ from here.

ATOMUSDT Potential UpsidesHey Traders, in today's trading session we are monitoring ATOMUSDT fora buying opportunity around 4.30 zone, ATOM is trading in an uptrend and currently is in a correction phase in which it is approaching the trend at 4.30 support and resistance area.
Trade safe, Joe.

#ATOM $ATOM is showing bullish potential as price tests the uppe
▪️ Holding above key support suggests buyer strength.
▪️ A confirmed breakout from the trendline could ignite a new bullish wave.
Potential targets upon breakout:
T1 $5.00
T2 $6.40
T3 $7.75
This bullish scenario remains valid as long as price holds above the support base.

atom sell midterm "🌟 Welcome to Golden Candle! 🌟
We're a team of 📈 passionate traders 📉 who love sharing our 🔍 technical analysis insights 🔎 with the TradingView community. 🌎
Our goal is to provide 💡 valuable perspectives 💡 on market trends and patterns, but 🚫 please note that our analyses are not intended as buy or sell recommendations. 🚫
Instead, they reflect our own 💭 personal attitudes and thoughts. 💭
Follow along and 📚 learn 📚 from our analyses! 📊💡"

ATOM LONG/BUY SETUPHello, TradingView community and my subscribers, please if you like ideas do not forget to support them with your likes and comments, thank you so much and we will start a LONG/BUY outlook on #ATOMUSDT.P explained

ATOMUSDT Breakout And Potential RetraceHey Traders!
In today's session, we're keeping a close eye on ATOMUSDT as it presents a potential buying opportunity around the 4.13000 zone.
After trading in a prolonged downtrend, ATOM has successfully broken out, signaling a possible trend reversal. Right now, the pair is in a correction phase, and it’s approaching a key support/resistance level near the 4.13000 area — a critical retracement zone we’re watching for potential bullish continuation.
Trade safe, Joe.

ALTSEASON | ALTS | BUY Zones SummaryOver the past few weeks I've been gradually analyzing the alts that I believe have great potential for the next cycle.
These include:
✅ ATOM
✅ Litecoin
✅ Fantom
✅ Doge
✅ SUI
✅ SHIB
✅ DOT
✅ PEPE
✅ BNB
✅ Tron
✅ The Graph
✅ Render
✅ Maker
✅ AAVE
Here's your quick video summary on ideal buying zones for the above altcoins. Enjoy!
____________________________

Cosmos (ATOM): Waiting For Break of EMA and Fill of CME GapsCosmos coin has a chance to fall hard here once we see a clean breakdown from that 200EMA.
We are waiting for more clarity and once we get it, we are targeting both bearish CME gaps here!
Swallow Team

Cosmos (ATOM): Buyers Showing Strong Dominance Breaking 200EMACosmos coin has recently broken out from the 200 EMA mark, which has been holding the price down for quite some time.
Now as we see some sort of volume to build above the EMA, we are looking for a strong candle to form here, which then would form a BOS on smaller timeframes.
We are seeing a good opportunity here with good R:R, so let's try; if we see the price fall back below 200 EMA, then our target is the bearish CME gap and even lower from there, but for now we are looking for long!
Swallow Team

ALTCOINS | ALTSeason | Buy Zones PART 3⚜TRX
TRX has been really strong over the past few days, continuously making higher lows which is early signs of a bullish sentiment. Though, I would want to see the price hold the highlighted support zones before making any decisions. A close UNDER would likely lead to a lower drop.
In that case, I'd be willing to buy at 0,22:
⚜GRT
GRT I'd be looking to buy very low, between the two following prices:
⚜RNDR
Render has bounced from the first buy-zone, but it seems likely we'll retest again soon since the bounce did not equate to a reversal:
⚜MAKER
Optimistic longer term on this coin. Strong decline, lower buy likely here:
⚜AAVE
Strong short-term bearish sentiment, weighted heavier towards the lower zone:
Make sure you don't miss part 1 and part 2 !!

atom buy midterm"🌟 Welcome to Golden Candle! 🌟
We're a team of 📈 passionate traders 📉 who love sharing our 🔍 technical analysis insights 🔎 with the TradingView community. 🌎
Our goal is to provide 💡 valuable perspectives 💡 on market trends and patterns, but 🚫 please note that our analyses are not intended as buy or sell recommendations. 🚫
Instead, they reflect our own 💭 personal attitudes and thoughts. 💭
Follow along and 📚 learn 📚 from our analyses! 📊💡"


Back to the Box — Classic Range Play on ATOMATOM has been moving within a well-defined sideways range between $4.03 and $5.08 for over two months now. Every time price touches the lower boundary, we’ve seen strong bullish reactions — and right now, we’re sitting right at that key support zone again.
I'm entering a long position around $4.281
💡 The idea here is simple: classic range trading setup with a clean invalidation point and an R:R close to 1:4.
📍 Entry: $4.281
🎯 Targets:
→ $4.325
→ $4.369
→ $4.426
→ $4.497
→ $4.569
❌ Stop: $4.029
More thoughts in my profile @93balaclava
Personally I trade on a platform that offers low fees and strong execution. DM me if you're interested.

ATOMUSDT🔻 ATOM/USD – 55 SMA Rejection + Bear Power Pressure
Timeframe: H4
Bias: Bearish
Entry Type: Confluence Rejection + Momentum Confirmation
🔍 Trade Idea
Price has rejected cleanly off the 55 SMA, failing to break through previous structure highs while remaining well below the 800 EMA. The market printed lower highs in a consolidation block before breaking down, suggesting a liquidity sweep followed by seller control.
Williams %R is printing below -80, exhibiting bearish crossover behavior, and Bear Power remains negative, indicating continued downward strength.
📍 Technical Confluence
55 SMA sloping downward with direct price rejection
Price remains below the 800 EMA (bearish bias confirmed)
Bear Power histogram remains red, confirming pressure from sellers
Williams %R (100 + 50) both breaking through -80, validating downside momentum
TP levels aligned with BB(400) zone support (TP2/TP3)
📉 Execution Plan
Entry: $4.26
Stop Loss: $4.70 (above the previous structure rejection & SAR reversal)
TP1: $4.00
TP2: $3.70
TP3: $3.54 (aligned with Bollinger Band 400 deviation zone)

atom buy midterm"🌟 Welcome to Golden Candle! 🌟
We're a team of 📈 passionate traders 📉 who love sharing our 🔍 technical analysis insights 🔎 with the TradingView community. 🌎
Our goal is to provide 💡 valuable perspectives 💡 on market trends and patterns, but 🚫 please note that our analyses are not intended as buy or sell recommendations. 🚫
Instead, they reflect our own 💭 personal attitudes and thoughts. 💭
Follow along and 📚 learn 📚 from our analyses! 📊💡"


Long Position ATOM/USDT🚀 ATOM/USDT – Falling Wedge Breakout in Progress
The price just broke out of a falling wedge for retesting the major support zone (🔵 4.32 to 4.185). This is a classic bullish reversal setup forming at the right spot.
📈 Long Bias Activated
Momentum is building for a potential multi-TP run if the breakout holds.
🟢 LONG Position Entry: 4.32 to 4.185
✅ Target1@ 4.383
✅ Target2 @ 4.456
✅ Target3 @ 4.552
✅ Target4 @ 4.663
🔴 Risk Level: Invalid below 4.185
🧠 Why it matters:
Wedge formations often lead to explosive breakouts. With the structure forming at demand, this could be a liquidity sweep followed by a rally.
POINT: Next Possible 🔴 Short Zone could be around 4.666

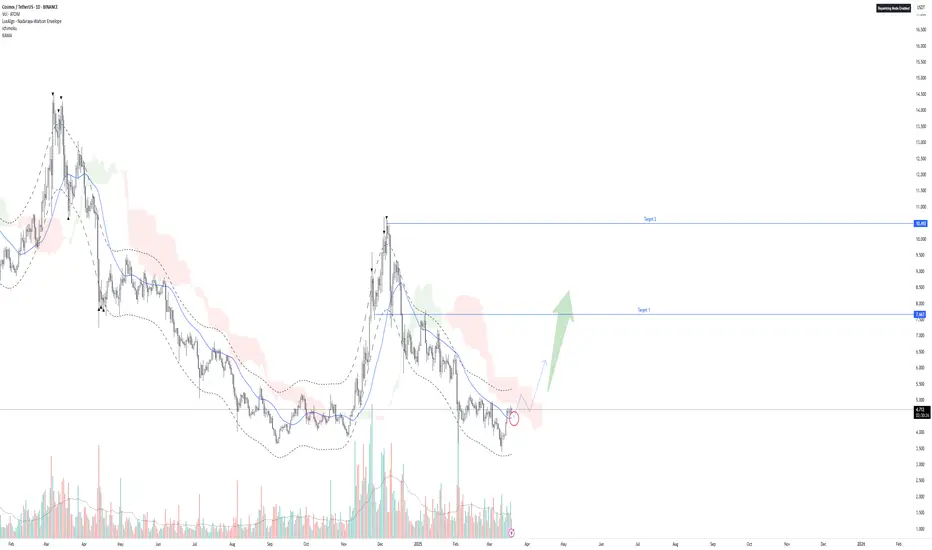
Cosmos: Your Altcoin ChoiceATOM is performing perfect market bottom behavior. It bottomed first in late 2024, around September. A higher low in November. Now, in 2025, we have a lower low in March but the session close happened above the 2024 bottom, much higher.
So you can count all the action between late 2024 and present day as the formation of the bottom. This is where and when smart money buy Crypto. This is the whales buy-zone. Retail traders and investors can also buy if they are smart.
The best prices are available only now and won't continue to be available for long.
The orthodox end of the bear market for Cosmos (ATOMUSDT) happened in June 2022, almost three years ago.
The bear market was down, clearly. The end of the bear market heralds the start of a neutral period. This neutral period can be seen as sideways action on the chart. This sideways action can also be called consolidation before the next major bullish phase. We are in front of this new phase. There will be a major rise, look at the arrow on the chart. Believe it or not, this is exactly what will take place.
This is nothing new. After the March 2020 low, ATOMUSDT went through a similar consolidation period but with an upward bent. After a few months, the market developed a strong bullish phase. Total growth amounted to more than 4,000%. Are you ready for the 2025 bull market?
Cosmos is ready to grow more than 1,000%.
Targets can be seen on the chart.
Expect surprises. Prepare for something great.
Everything will grow more than anything you can imagine, calculate or expect.
The only reason I will be wrong is because the All-Time High will end up being much higher than my projected targets, and this is ok.
Just let the market the grow.
The more it grows, the better it will get.
We are ready for 1 billion users trading Crypto.
Thank you for reading.
Namaste.
