$auctionthought id already posted this got a bag yesterday and its back where i got it
flip blue line and have a spike in supply zone and undertest of 200ema then retest 17.26 maybe take stops below that then run it back .
so IF it does play out like above shall look to lever up on the rertest
part of me wants that range low deviation but may not get it still shall check back in 8hrs
Market insights

AUCTIONUSDT - BULLISHBINANCE:AUCTIONUSDT is currently creating higher highs and higher lows after experiencing bullish divergence. I am expecting the bullish momentum to continue as the lower high as been broken as well!

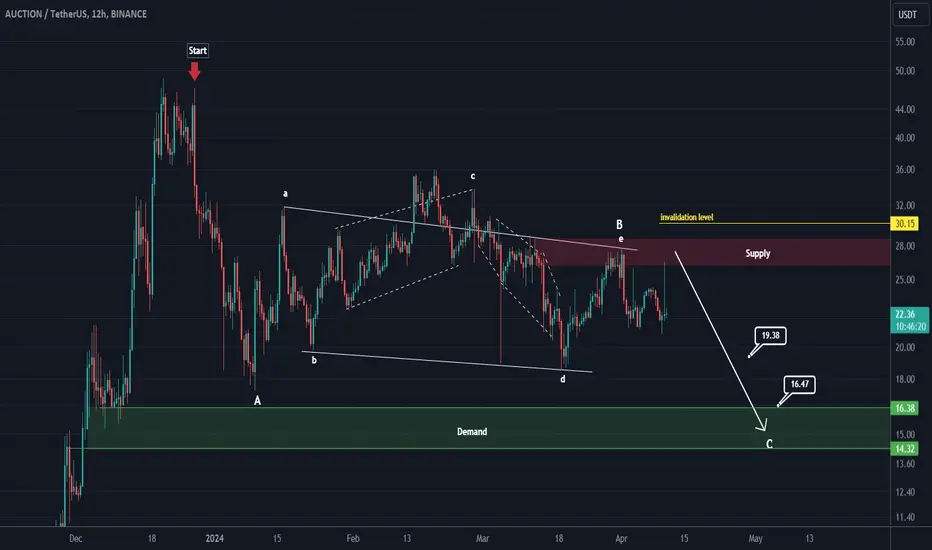
Auction looks bearishThe correction has started from where we entered "START" on the chart.
It seems that we are in an ABC or a more complicated pattern.
Now it looks like wave B, which was a triangle, is over. And we have entered bear C wave.
The targets are marked on the chart. When we reach the first target, save some profit and then change the stop to entry
Closing a daily candle below the invalidation level will violate the analysis
For risk management, please don't forget stop loss and capital management
Comment if you have any questions
Thank You
Bounce Token (AUCTION)After AUCTION broke the downtrend line, went up 1000% and now correction is unfolding in a triangle pattern. It seems, AUCTION is aiming for the ATH area that definitely will act as a major resistance. AUCTION would be free If break this area successfully, as there are no resistances. Let's see what happens.

#AUCTION/USDT#AUCTION
We have a strong bullish soft trend that the price has been following for two months
Now the rising trend has been touched and it is expected to rebound upward
We have a strong rising trend on RSI as well
We have a higher stability than the Moving Average 100 and we have an upward discount
The pattern is canceled if the day is closed with a strong bearish candle
Entry price 29.86
The first goal is 32.00
The second goal is 35.06
Third goal 38.54

AUCTIONUSD 3DAUCTION ~ 3D 📈
#AUCTION Bullish Pennant Pattern is Formed, Make purchases gradually from here, with a minimum Target of 20%+ From here 📈

AUCTIONUSDT DCA Buying Spot this under 22.
Pretty nice potential of a nice move in this one.
Looks like it can generate a nice Spot Trade from here.
Targeting 70 and 120.
Note: Not a Financial Advice.

AUCTION IN THE VERGE OF BREAKOUTAUCTION is trying to breakout from descending channel in daily timeframe. In case of breakout 100% pump is expected.

#Auction #Bounce / #Bouncebit #BounceToken forms falling wedge.#Auction Bounce Token forms falling wedge, would be completed. Need to stand above Kijun and then bullish as shown.

AUCTIONUSDT OUTLOOKAUCTIONUSDT.P OUTLOOK:
The price has reached its strongest support level on the 1D timeframe, as indicated by the horizontal blue line.
The black arrow indicates the potential direction of the price movement, suggesting a bullish breakout towards the resistance level at

AUCTION/USDT I BUY SETUP✔︎📈 BINANCE:AUCTIONUSDT SIGNAL
✔︎ENTRY : 26.72 or market
🏓TARGETS :
✔︎ T1 : 28.07
✔︎ T2 : 29.42
✔︎ T3 : 31
✔︎ Long term T4 - T5
✘ STOP : 25.37
🚦Stop Trigger:
• If you make capital management: Stop is activated when one candle opening and closing
below the stop level of the same time frame of the signal.
• If you don't make capital management: Stop is direct without waiting for the candle to close.
💡Risk management :
• Enter the trade with 10% to 20% of your capital to reduce risk and save cash to enter other opportunities.
• Sell (25% to 50%) on (T1) and don't move your stop-loss.
• Sell 50% on (T2) and move your stop loss to the entry point.
• You are safe now, and the next 25% is up to you.
💡Reason for this trade:
BINANCE:AUCTIONUSDT gives my trading system a sign of strength:
• My trading system is based on liquidity and reversal zones.
• When the liquidity is swept from one side under certain conditions, we will wait for the price on the other side.
The liquidity will attract the price like a magnet.
• the first side that has been swept:
1- previous monthly low
2- valu area deviation
• Opposite side targets:
1- range high
2- inducment
3- previous monthly high
💡Entry setup
1- AMT rule ( If time/volume build at the edge of a balance, price is likely to push through)
⚠️WARNING:
• I'm not a financial advisor.
• Do your own research (DYOR).


AUCTION analysisFrom where we wrote "START" on the chart, AUCTION seems to have entered a correction.
It seems that this correction is an abc, which wave B has become a diametric diamond.
It is expected to move up to the red range and then reject downwards to complete wave C.
For risk management, please don't forget stop loss and capital management
Comment if you have any questions
Thank You

Bounce Token (AUCTION) completed a setup for upto 34.50% pumpHi dear members, hope you are well and welcome to the new update on Bounce Token (AUCTION).
Recently we caught almost 29% pump of AUCTION as below:
Now on a daily time frame, AUCTION has formed a bullish Shark move for the next pump.
Note: Above idea is for educational purpose only. It is advised to diversify and strictly follow the stop loss, and don't get stuck with trade.

ScalpA great scalp position, given that we are in a strong uptrend and corrective wave analysis we can expect to return to the green zone.
Be patient and enjoy your profit

DAY TRADE 024BYBIT:AUCTIONUSDT.P
Hey guys, so keeping it simple as always... have spot for a limit on what I call a crater (because I believe this game is run by your own rules) from now on i will be setting most of my trades at a 5:1 to gain better consistency as i believe tweaking your structure in minor ways can have major affects on your performance. we are in a bull market so longing is the only option for me right now. where my limit is set is where the volume is booming the most as you can see with the volume profile indicator.
LIMIT - 24.148
STOP LOSS - 22.366
TAKE PROFIT - 33.052

AUCTIONUSDT.4HBased on the given data, it appears that the AUCTION/USDT pair is currently trading at a price of 28.71 USDT. The 4-hour, 1-day, and 7-day Relative Strength Index (RSI) values are 62.74, 59.46, and 64.96 respectively, indicating that the pair is nearing overbought territory, which could suggest a potential pullback in the near future.
The Moving Average Convergence Divergence (MACD) for the 4-hour, 1-day, and 7-day charts are 0.59, 0.70, and 5.49 respectively, indicating a bullish trend. This suggests that the momentum is currently with the buyers.
The Bollinger Bands (Bb) for the 4-hour, 1-day, and 7-day charts are 29.66, 29.68, and 29.70 respectively. The pair is currently trading below the upper band, suggesting a potential downward price movement.
In terms of support and resistance levels, the pair has immediate support at 27.08 USDT (4-hour chart), 25.65 USDT (1-day chart), and 27.08 USDT (7-day chart). If these levels are broken, the price could potentially drop further. On the flip side, resistance levels are at 29.51 USDT (4-hour chart), 29.50 USDT (1-day chart), and 29.60 USDT (7-day chart). A break above these levels could lead to further upward movement.
In summary, the AUCTION/USDT pair is showing signs of a bullish trend but is nearing overbought levels. It is crucial to keep an eye on the support and resistance levels as they could indicate potential price reversals. Always consider other market factors and your risk tolerance before making any trading decisions.

auctionusdttraingle
pay attention . only 2 roofs and 2 floors are not seen in infinite triangles
the target is the apex of the tringle when it breaks it warns that it is completed and grows to the top of the triangle as one of the thickest waves

AUCTION Bearish Ideaauction has been moving inside a triangle weakly without making same highs or higher highs, I believe it will break the lower trendline and move lower

AUCTION Long After sweeping liquidity at 19.7, price has gracefully returned back into the channel and is ready to test resistance at 22.8. The bounce token is one investors should be monitoring closely. TP at fib levels

AUCTIONUSDT.PAUCTIONUSDT.P is in bearish trend.
Bearish divergence also shown in RSI.
Sellers are strongly active.
We wait for the breakout of last LL.

#AUCTION Expect a pullback to the broken structureIn time H1, it is moving in a short-term ascending channel, which in time 30 minutes, if it pulls back in the green box area, and due to the failure of the supply area, it will be able to reach the next target. Therefore, you can wait for the green box area in the case of pullback.
Please support this idea with a LIKE and COMMENT if you find it useful and Click "Follow" on our profile if you'd like these trade ideas delivered straight to your email in the future.
Thanks for your continued support.
Sincerely.

AUCTIONUSDT buy at potential HL to catch a trend AUCTIONUSDT buy at potential HL to catch a trend
buy at current market price and Stop loss previous HL
