AUDCAD - From Shorts to Potential Longs!!Earlier in this range, we sold 📉AUDCAD near the upper boundary, fading resistance as price showed clear exhaustion. That idea played out well, with price rotating back into the middle and now pressing toward the lower bound of the range.
This is where things shift.
⚔️As long as range support holds, the bias flips from selling rallies to looking for longs from support. In a well-defined range, edges matter more than direction, and the lower boundary is where buyers historically step in.
The plan from here is simple and disciplined.
No chasing. No guessing....
🏹If price holds above support and shows bullish reaction on lower timeframes, longs become valid back toward the range highs. A clean breakdown below support would invalidate this idea and put sellers back in control.
Range trading is not about prediction, it’s about location and reaction.
Will buyers defend the floor once again, or is this range finally ready to break? 🤔
⚠️ Disclaimer: This is not financial advice. Always do your own research and manage risk properly.
📚 Stick to your trading plan regarding entries, risk, and management.
Good luck! 🍀
All Strategies Are Good; If Managed Properly!
~Richard Nasr
Australian Dollar/Canadian Dollar
No trades
Market insights


AUDCAD: Bearish Drop to 0.907?FX:AUDCAD is eyeing a bearish pullback on the 4-hour chart , with price testing resistance after rebounding from major support, converging with a potential entry zone that could trigger downside momentum if sellers defend amid recent volatility. This setup suggests a correction opportunity in the uptrend, targeting lower levels with risk-reward exceeding 1:3.🔥
Entry between 0.91890–0.92050 for a short position (entry at these levels with proper risk and capital management is recommended). Target at 0.90745 . Set a stop loss at a close above 0.9226 , yielding a risk-reward ratio of more than 1:3 . Monitor for confirmation via a bearish candle close below entry with rising volume, leveraging the pair's dynamics near resistance.🌟
Fundamentally , AUDCAD is trading around 0.914 in mid-December 2025, with key Canadian events this week potentially impacting CAD strength. On December 16 at 12:30 PM UTC, BoC Governor Macklem speaks in Montreal, which could provide policy insights. December 18 features the Bank of Canada Rate Decision at 09:45 AM UTC, where a potential hold or cut amid economic data could weaken CAD if dovish. Followed by Macklem's Speech at 12:45 PM UTC for further guidance. December 19 brings CPI (Nov) at 08:30 AM UTC, with hotter inflation possibly supporting CAD, while softer readings could pressure it. December 22 includes GDP (Oct) at 08:30 AM UTC, where strong growth might bolster CAD. No major high-impact releases for AUD this week, leaving the pair sensitive to CAD catalysts and broader USD sentiment. 💡
📝 Trade Setup
🎯 Entry (Short):
0.91890 – 0.92050
(Entries in this zone are valid with proper risk & capital management.)
🎯 Target:
• 0.90745
❌ Stop Loss:
• 4H / Daily close above 0.9226
⚖️ Risk-to-Reward:
• > 1:3
💡 Your view?
Will AUDCAD reject this resistance for a clean pullback toward 0.90745 — or will CAD weakness invalidate the setup and push price higher? 👇

Lingrid | AUDCAD Buying Opportunity from Channel Lower EdgeFX:AUDCAD perfectly played out my previous trading idea . Price is stabilizing near a well-defined demand pocket where the rising support trendline converges with prior horizontal reactions, creating a technically important decision zone. The recent decline from the top unfolded in a corrective manner, suggesting bearish pressure may be losing traction. Price action is compressing near support, often a precursor to a directional move.
If buyers manage to hold the 0.9050–0.9080 region, it could attempt a recovery toward 0.9150. This area aligns with previous supply and could act as the next meaningful test for bulls.
➡️ Primary scenario: support holds at 0.9080 → rebound toward 0.9150.
⚠️ Risk scenario: break below channel may invalidate the bullish setup and expose deeper downside pressure.
If this idea resonates with you or you have your own opinion, traders, hit the comments. I’m excited to read your thoughts!

AUDCAD – When Price Refuses to Come BackThis chart isn’t interesting because of what price did.
It’s interesting because of what price refused to do .
After a clear structural shift, AUDCAD printed a bullish breaker and then launched vertically. No hesitation. No overlap. No courtesy pullback. Just expansion.
That tells a very specific story.
This was not a market inviting participation.
This was a market escaping a price range .
The bullish breaker exists, but it was never mitigated . Price didn’t return to rebalance, didn’t test commitment, didn’t allow confirmation. That’s not accumulation — that’s urgency.
So even though the bias flipped bullish , the location never became tradable.
What followed was consolidation above the move — not inside it. That’s acceptance at higher prices, not demand being built below.
In other words:
Direction is clear
Intent is visible
Participation is missing
This is why I don’t confuse market intent with market opportunity .
Sometimes the market tells you:
“ I’m bullish — but you’re late. ”
And the correct response is not FOMO, not prediction, not forcing an entry —
it’s patience.
This chart stays on watch until price comes back to unfinished business , or until a new narrative forms.
This post is about location, behavior, and restraint — not a trade call.
— SmellyTaz
Decoding chaos
⚠️ This is not financial advice.

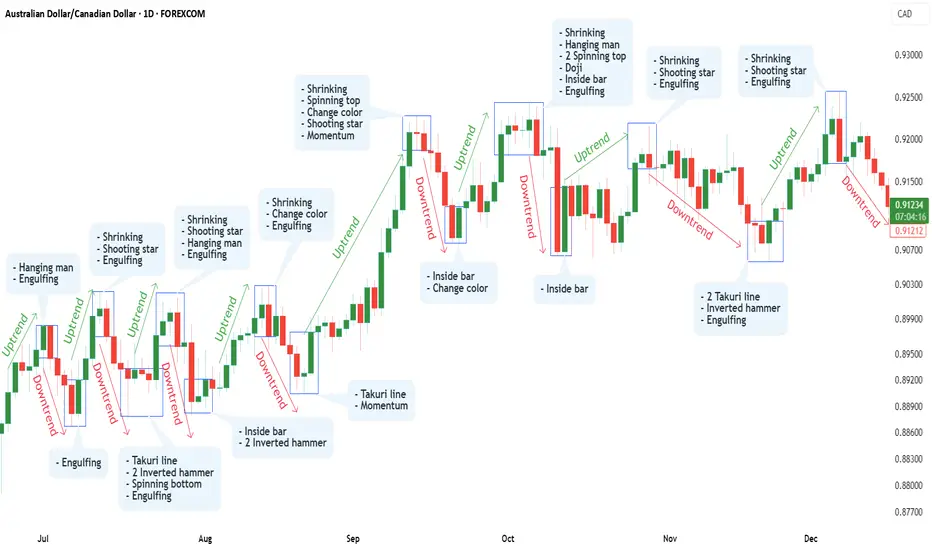
How to Use Candlesticks in a High-Probability Way | Tutorial #3📊 Market Context: Ranging Market
This tutorial completes the trilogy of market conditions:
Trending (Uptrend & Downtrend) → Ranging Market.
From the next tutorials, we move into advanced concepts , where candlesticks are placed into proper context and combined with the most important element in trading — Support & Resistance .
🕯 Candlestick Types Covered in This Tutorial (Ranging Market)
Shrinking Candlesticks
➡️ Loss of momentum and reduced participation — balance, not an automatic reversal.
Inside Bar
➡️ Compression and consolidation inside the range, often before expansion.
Takuri Line
➡️ Strong rejection from range support — buyers stepping in.
Hanging Man
➡️ Context matters. In a range, it highlights supply — not a sell signal by itself.
Inverted Hammer
➡️ Buyer response after downside pressure within the range.
Spinning Top
➡️ Indecision between buyers and sellers.
Spinning Bottom
➡️ Temporary hesitation near range extremes.
Engulfing Candle
➡️ Strong participation when aligned with location and context.
Momentum Candlestick
➡️ Large-bodied candle showing aggressive participation.
Change Color Candle
➡️ After a sequence of same-colored candles, a color change may signal pause or shift.
🧠 Best Practice
Candlesticks should be read as clusters and sequences , not isolated signals.
This tutorial focuses on how candles stack together inside a ranging market to tell the full story.
⚠️ Important
Candlesticks alone are NOT enough .
High-probability setups come from combining them with:
Support & Resistance
Areas of Confluence
Chart Patterns
Trendlines
Indicators
Multi-timeframe context
This is how high-probability trading is built.
👉 Want Part 4?
From the next phase, we move into advanced trading :
combining candlesticks with Support & Resistance — this is where the real edge begins .
📈 Follow to catch the next tutorial.
⚠️ DISCLAIMER
This content is for educational purposes only and does not constitute financial advice.
Trading involves risk — always conduct your own analysis.
I am not responsible for any decisions or losses based on this material.
AUDCAD - BEARISH MOVE Hello traders,
the AUDCAD price has broken the support level (0.91323 – 0.91476).
This key zone now acts as new resistance,
so I expect a bearish move from here.
🎯 TARGET: 0.90900

AUDCAD - Stuck in a Range… Bears Eye the Upper Boundary!📦AUDCAD has been moving inside a clear horizontal range , with price repeatedly rejecting the upper resistance zone highlighted in red. Each time price tapped this area, sellers regained control and pushed it downward.
⚔️Price is now approaching that same resistance once again. As long as this zone holds, we will be looking for sell setups, expecting AUDCAD to reverse back toward the lower bound of the range.
📉The bias remains bearish within this structure unless buyers manage to break and close above the resistance with strength.
Do you think AUDCAD will respect the range again? Share your thoughts below 👇
⚠️ Disclaimer: This is not financial advice. Always do your own research and manage risk properly.
📚 Stick to your trading plan regarding entries, risk, and management.
Good luck! 🍀
All Strategies Are Good; If Managed Properly!
~Richard Nasr

AUDCAD Is Bullish! Buy!
Here is our detailed technical review for AUDCAD.
Time Frame: 4h
Current Trend: Bullish
Sentiment: Oversold (based on 7-period RSI)
Forecast: Bullish
The market is approaching a significant support area 0.912.
The underlined horizontal cluster clearly indicates a highly probable bullish movement with target 0.919 level.
P.S
The term oversold refers to a condition where an asset has traded lower in price and has the potential for a price bounce.
Overbought refers to market scenarios where the instrument is traded considerably higher than its fair value. Overvaluation is caused by market sentiments when there is positive news.
Like and subscribe and comment my ideas if you enjoy them!

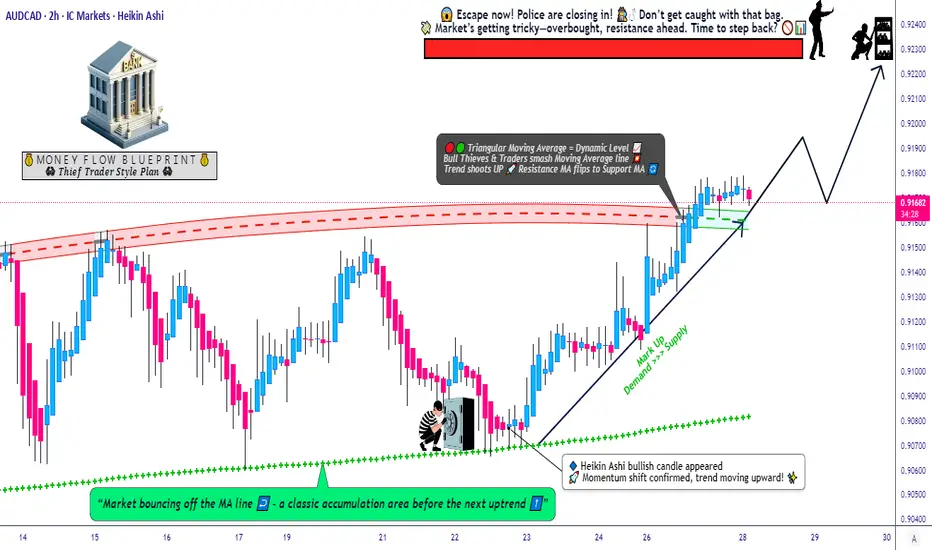
Trading The AUD/CAD Breakout - A Systematic Approach.🎯 Aussie vs Cad Dollar – Market Capital Flow Blueprint (AUD/CAD Bull Setup) 🦘🍁
Hello Market Money Makers & Thief OG’s!
We’re watching the AUD/CAD pair with a bullish bias — the Aussie is showing strength vs the Loonie, and the capital-flow looks supportive. Here’s the plan:
📈 Setup:
A breakout of the triangular moving average structure has just been confirmed — signalling a potential swing/day trade environment.
Risk-reward is favourable, and layered entries give us flexibility in execution.
🛒 Entry Strategy (Layering Style):
Using multiple buy limit orders (classic Thief layering method) at the following levels:
0.91300
0.91400
0.91500
0.91600
(You can add more layers if you like — scale as you see fit.)
🚫 Stop Loss (Thief’s SL):
0.91100 — if price drops below here the trade is invalidated.
Note: Dear Ladies & Gentlemen (Thief OG’s), I am not recommending you blindly follow my SL — it's your choice, you can make money then take money at your own risk.
🎯 Target (TP):
0.92300 — this level acts as a police barricade (strong resistance) + overbought trap zone.
Note: Dear Ladies & Gentlemen (Thief OG’s), I am not recommending you blindly follow my TP — it's your choice, you can make money then take money at your own risk.
🔍 Watch-Pairs / Correlations:
OANDA:USDCAD – watch relative strength of USD vs CAD.
OANDA:AUDJPY – for Aussie strength confirmation.
OANDA:GBPCAD – another CAD-weakness proxy.
Monitoring these helps us see if CAD remains weak or if AUD continues to shine.
📌 Key Points / Why This Setup Works:
Capital flow: Aussie assets drawing interest, contributing to AUD strength.
Breakout confirmation: Moving average triangle resolved bullishly.
Layered entries: lets us average into the trade if price comes down to support.
Target zone backed by resistance and structural trap — good exit zone.
Stop-loss placement protects capital if market flips direction.
✨ “If you find value in my analysis, a 👍 and 🚀 boost is much appreciated — it helps me share more setups with the community!”
Disclaimer: This is Thief style trading strategy just for fun.
#AUDCAD #Forex #FX #DayTrade #SwingTrade #CapitalFlow #LayeringStrategy #ThiefTrader
AUDCAD; Heikin Ashi Trade Idea📈 Hey Traders!
Here’s a fresh outlook from my trading desk. If you’ve been following me for a while, you already know my approach:
🧩 I trade Supply & Demand zones using Heikin Ashi chart on the 4H timeframe.
🧠 I keep it mechanical and clean — no messy charts, no guessing games.
❌ No trendlines, no fixed sessions, no patterns, no indicator overload.
❌ No overanalyzing the market; use only two time frames.
❌ No scalping, and no need to be glued to the screen.
✅ I trade exclusively with limit orders, so it’s more of a set-and-forget style.
✅ This means more freedom, less screen time, and a focus on quality setups.
✅ Just a simplified, structured plan and a calm mindset.
💬 Let’s Talk:
💡Do you trade supply & demand too ?
💡What’s your go-to timeframe ?
💡Ever tried Heikin Ashi ?
📩 Got questions about my strategy or setup? Drop them below — ask me anything, I’m here to share.
Let’s grow together and keep it simple. 👊

AUDCAD - Bullish Continuation WatchBias:
Bullish.
⸻
4H:
HTF structure remains clean and intact. Monitoring price to see if continuation can be attended.
⸻
30M:
Mid-term structure is being tracked. Waiting for SSL to be taken, leading price into a test area. From there, I’ll hold for proper confirmation.
⸻
5M:
On LTF, once a LH break is confirmed, I’ll assess buy execution on the bullish leg. Until everything aligns — patience remains the edge.

AUDCAD OutlookAm bullish on AUDCAD. Price has approached an unmitigated Demand Zone + Discount Fib Level.
Manage risk

AUDCAD sellsActive and pending orders. Price approached Supply level after the sudden drop
Manage risk o

Swing Trading AUD/CAD: A Detailed Bullish Scenario📌 𝐀𝐬𝐬𝐞𝐭: AUD/CAD — “Aussie vs Canadian Dollar”
𝐅𝐨𝐫𝐞𝐱 𝐌𝐚𝐫𝐤𝐞𝐭 𝐓𝐫𝐚𝐝𝐞 𝐎𝐩𝐩𝐨𝐫𝐭𝐮𝐧𝐢𝐭𝐲 𝐆𝐮𝐢𝐝𝐞 (𝐒𝐰𝐢𝐧𝐠 𝐓𝐫𝐚𝐝𝐞)
🧭 𝐓𝐫𝐚𝐝𝐞 𝐏𝐥𝐚𝐧: 𝐁𝐮𝐥𝐥𝐢𝐬𝐡 — 𝐌𝐀 𝐏𝐮𝐥𝐥𝐛𝐚𝐜𝐤 + 𝐏𝐫𝐞𝐜𝐢𝐬𝐞 𝐑𝐞𝐭𝐞𝐬𝐭 𝐂𝐨𝐧𝐟𝐢𝐫𝐦𝐞𝐝
The trend structure remains bullish with clean higher-lows. Price has reacted strongly from the dynamic support zone around the Moving Averages, validating a trend-continuation setup. Momentum stays on the buyers’ side with exhaustion signs on the sellers.
🎯 𝐄𝐧𝐭𝐫𝐲: 𝐌𝐮𝐥𝐭𝐢-𝐋𝐚𝐲𝐞𝐫 𝐁𝐮𝐲 𝐎𝐫𝐝𝐞𝐫 𝐒𝐭𝐫𝐚𝐭𝐞𝐠𝐲 (𝐓𝐡𝐢𝐞𝐟 𝐌𝐞𝐭𝐡𝐨𝐝)
This plan uses a layered limit entry system to reduce risk and improve average execution:
Buy Limit Layers:
0.91400
0.91500
0.91600
0.91700
(You may increase or decrease layers based on your personal strategy.)
Concept: This layering method allows catching pullback liquidity sweeps and retest reactions across micro-levels — ideal for swing positioning.
🛡️ Stop Loss (SL): 0.91200
This is the proposed Thief SL.
However, you must adjust SL based on your risk tolerance, trade size, and personal strategy.
Your money—your responsibility.
🎯 Target (TP): 0.92400
Price is approaching a Police Barricade Zone — a strong resistance area where:
Market is entering overbought territory,
A possible bull trap might form,
Liquidity zones cluster tightly.
Take profits safely.
Again, adjust TP as per your risk and comfort.
📚 Related Pairs to Watch (Correlation Insights)
💱 1. USD/CAD ( OANDA:USDCAD )
Correlation: Moderate Positive
When CAD strengthens (often due to oil), USDCAD tends to drop, and AUDCAD may also feel downside pressure.
Watch oil and CAD macro data.
💱 2. AUD/USD ( OANDA:AUDUSD )
Correlation: Strong Positive with AUD strength
If AUD shows broad market strength versus USD, chances increase for AUD to outperform CAD as well.
Risk sentiment (RISK-ON/RISK-OFF) heavily impacts it.
💱 3. CAD/JPY ( OANDA:CADJPY )
Correlation: Risk sentiment indicator
When CADJPY weakens, global risk sentiment may be shifting, which can slow AUDCAD bullish momentum.
💱 4. AUD/JPY ( OANDA:AUDJPY )
Correlation: High risk sentiment sensitivity → guidance for AUD strength
If AUDJPY rallies, it shows strong AUD flows—supportive for AUDCAD longs.
💱 5. WTI Crude Oil ( TVC:USOIL )
Correlation: Inverse Effect on AUDCAD
CAD is an oil-linked currency.
Rising oil → CAD strengthens → AUDCAD may drop.
Falling oil → CAD weakens → AUDCAD tends to rise.
🧠 Final Notes
This is a structured swing setup designed for layered execution, strong risk control, and clarity.
Always adapt entries, stops, and targets to your own strategy.
Trade responsibly, trade smart.

Sell AUDCADAUDCAD presenting a short opportunity mid-week. A bearish flag has formed on the 4hr chart. We may see aggressive bearish movement from this pair in the coming hours

AUDCAD Under Pressure! SELL!
My dear friends,
Please, find my technical outlook for AUDCAD below:
The price is coiling around a solid key level - 0.9195
Bias - Bearish
Technical Indicators: Pivot Points High anticipates a potential price reversal.
Super trend shows a clear sell, giving a perfect indicators' convergence.
Goal - 0.9182
Safe Stop Loss - 0.9202
About Used Indicators:
The pivot point itself is simply the average of the high, low and closing prices from the previous trading day.
Disclosure: I am part of Trade Nation's Influencer program and receive a monthly fee for using their TradingView charts in my analysis.
———————————
WISH YOU ALL LUCK

AUDCAD: Move Up is Expected 🇦🇺🇨🇦
There is a high probability that AUDCAD will continue rising.
A bullish change of character and a formation of an imbalance
candle after the Australia interest rate decision this night,
suggest a strong buying sentiment.
Goal - 0.9218
❤️Please, support my work with like, thank you!❤️
I am part of Trade Nation's Influencer program and receive a monthly fee for using their TradingView charts in my analysis.

Bearish drop off?AUD/CAD is rising towards the resistance level which is a pullback resistance that aligns with the 38.2% Fibonacci retracement and could reverse from this level to our take profit.
Entry: 0.91961
Why we like it:
There is a pullback resistance that aligns with the 38.2% Fibonacci retracement.
Stop loss: 0.92566
Why we like it:
There is a swing high resistance.
Take profit: 0.91181
Why we like it:
There is a pullback support level that is slightly below the 61.8% Fibonacci retracement.
Enjoying your TradingView experience? Review us!
Please be advised that the information presented on TradingView is provided to Vantage (‘Vantage Global Limited’, ‘we’) by a third-party provider (‘Everest Fortune Group’). Please be reminded that you are solely responsible for the trading decisions on your account. There is a very high degree of risk involved in trading. Any information and/or content is intended entirely for research, educational and informational purposes only and does not constitute investment or consultation advice or investment strategy. The information is not tailored to the investment needs of any specific person and therefore does not involve a consideration of any of the investment objectives, financial situation or needs of any viewer that may receive it. Kindly also note that past performance is not a reliable indicator of future results. Actual results may differ materially from those anticipated in forward-looking or past performance statements. We assume no liability as to the accuracy or completeness of any of the information and/or content provided herein and the Company cannot be held responsible for any omission, mistake nor for any loss or damage including without limitation to any loss of profit which may arise from reliance on any information supplied by Everest Fortune Group.

AUDCAD - Bullish Outlook | Weekly * MidtermHigher-Timeframe Bias:
AUDCAD is bullish. HTF structure is clean, price has broken major and significant highs, showing clear bullish intent and directional control.
Mid-Term Structure:
On the mid-term perspective, structure is mapped and ready for continuation.
Currently, we’re waiting for:
• A sell-side liquidity sweep
• Inducement taken
• Price falling into the internal-framework OB just underneath
Once full mitigation occurs, we drop to lower timeframes for confirmation.
Lower-Timeframe Execution:
On LTF, we’re looking for:
• Internal micro lower-high break
• Pullback within the bullish leg
• Entry points to target:
• Mid-term highs
• HTF highs
• LTF highs
Plan:
Until the market opens, we stay patient.
Smart Money leads direction; we track footprints. Our job is to monitor structure, map zones, and execute when the algorithm delivers.
Patience is key. Follow the footprints. Let’s go.

BREAKOUT FAILED? IF SO, ARE SELLERS STEPPING IN?Hello traders! Here’s an idea for AUDCAD based on current structure, trend, and momentum.
(This is market analysis, not financial advice. Always use proper risk management and seek additional confirmations before entering a trade.)
Yes, we are back below 0.92000, folks.
This is significant because the market finished the week under a key level — and that matters.
We’re now trading below September’s high, October’s high, and November’s high. If price retests this area, we could easily see a bearish move back toward 0.91500.
We also broke downward out of a bullish ascending channel, and the week closed outside that structure. That breakout adds another layer of confirmation that this rally may be topping out as we head deeper into December.
If price retests the resistance zone between 0.92000 and 0.92250, the reaction could be bearish.
⸻
Why CAD strengthened into the end of the week?
Well… it’s simply because of economic news/data that was released. Let’s talk about what happened ⬇️
• Stronger-than-expected Canadian jobs data:
Canada added 53,600 jobs in November, pushing unemployment down to 6.5%, the lowest in 16 months.
• Shift in interest-rate expectations:
Strong labor data supports the narrative that the Bank of Canada may hold rates steady — or in some scenarios, tighten later. Higher yield expectations increase demand for CAD.
• Higher oil prices:
Oil, one of Canada’s largest exports, saw a rise that boosted CAD as export revenues and FX flows strengthened.
• Rising Canadian bond yields:
Yields climbed across short-term maturities, drawing foreign inflows into CAD-denominated assets.
⸻
Technical Outlook
• Market structure is showing a bearish tilt.
• Moving-average alignment suggests resistance overhead and potential for continued downside.
• A near-term target around 0.9144 is reasonable based on momentum and structure.
• Some broader daily indicators still read Buy / Strong Buy, suggesting any downside could be limited or corrective rather than a full trend reversal.
• AUD remains sensitive to global risk sentiment and metals, so any risk-on rally could weaken the bearish case.
⚠️ A push toward 0.91000 is possible, but may require stronger momentum or further CAD-positive catalysts.
⸻
What to Watch for Confirmation
• Commodity moves: industrial metals and oil — AUD and CAD react differently here.
• Upcoming data from the RBA and BoC: rate guidance, CPI, jobs, etc.
• A clean bearish rejection at 0.92000–0.92250: ideally with strong momentum or volume.
⸻
Trade Idea (If Retest Occurs)
Entry Zone: 0.92000 – 0.92250
TP1: 0.91500 – 0.91600
TP2: 0.91100 – 0.90900
Stop-Loss: Above ~0.92450 – 0.92550
⸻
Let’s not predict — let’s react.
Good setup, good logic, good risk-management mindset. Share your thoughts about this market and good luck traders!

AUDCAD Will Go Down! Sell!
Take a look at our analysis for AUDCAD.
Time Frame: 4h
Current Trend: Bearish
Sentiment: Overbought (based on 7-period RSI)
Forecast: Bearish
The market is testing a major horizontal structure 0.924.
Taking into consideration the structure & trend analysis, I believe that the market will reach 0.918 level soon.
P.S
The term oversold refers to a condition where an asset has traded lower in price and has the potential for a price bounce.
Overbought refers to market scenarios where the instrument is traded considerably higher than its fair value. Overvaluation is caused by market sentiments when there is positive news.
Like and subscribe and comment my ideas if you enjoy them!

AudcadI hope everyone is enjoying their holidays. Unfortunately, on this side we don’t really experience that, so I’m assuming this might be a slow trading month with fewer opportunities. I understand it’s the holiday season, but the market still moves. Earlier this morning, I spotted a trade, and I think we can expect a shift in momentum on AUD/CAD.
