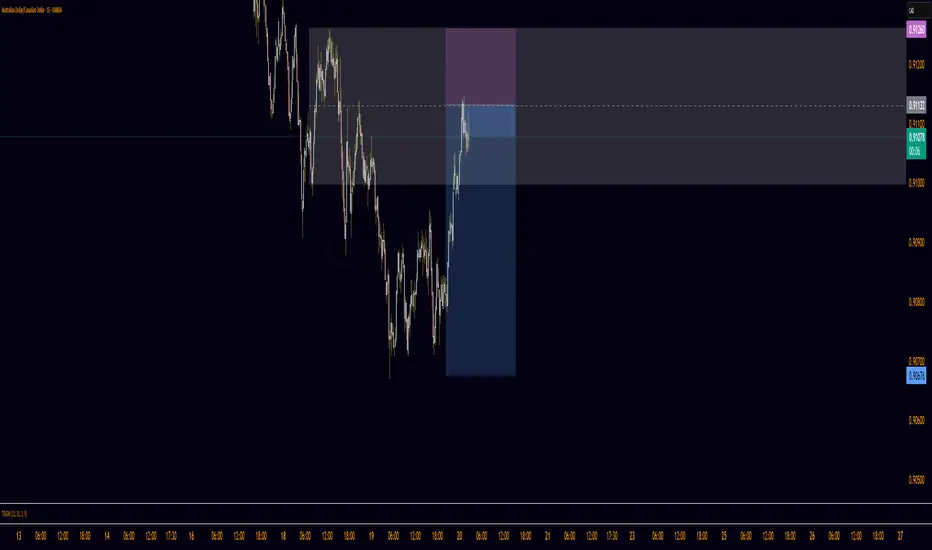
AUDCAD - trade of the week.The reason why I am interested in this trade is the following factors:
It looks like we ended a big abc correction on the 4hr. It took liquidity from the previous uptrend. We also see divergence in MACD.
I place a buy stop above the previous lower high. If it breaks, it is a confirmation for me for a buy.
The rr will be 1:1.46
Let's see.
Australian Dollar/Canadian Dollar
No trades
Trade ideas


AUDCAD SELLsim looking on selling audcad price has been looking good and we have alot of major news coming this week...


forex watch pairs for the weekthis are the pairs that we are looking to trade this week its a simple break and retest

AUDCAD LONG 110+ PIPSThe Australian macroeconomic data appears to be quite strong, while the Canadian macroeconomic data is weak but still acceptable. The price range is between 0.92148 and 0.90664. I can identify the support and resistance zones, as well as the third touch of the trend-based support level.

AUDCAD | Bullish Outlook
HTF Perspective:
Higher timeframe structure remains bullish. Price has been forming multiple courtyards (internal structures), signaling preparation for the next move.
MTF Perspective:
Waiting for the deep sell-side liquidity to be taken. So far, price is showing lower highs forming, which could act as resistance and indicate potential downward pressure.
LTF Execution:
If price reaches the mid-term order block, we’ll drop to lower timeframes to confirm structure and entries. Watch for lower-high breaks or flips before committing to continuation plays.
Current Outlook:
Until confirmations occur, we let Smart Money lead the direction. Patience is key — no forcing trades.
Let’s go!

AUD/CAD Daily AnalysisPreviously in October, we saw price reject 0.9060 after several attempts from the sellers to break the level.
On the final day of trading last week, price rejected the zone once again.
We could see price push higher like last time, back towards 0.9150 or maybe we could see 0.9060 tested again?
Either way, look for a trading setup that meets your strategy rules.

Choppy market, but still present opportunities…Hello traders!
Weekly outlooks will most likely be published over the weekend while the market is closed. This gives us the opportunity to analyze the market while it is dormant to eliminate the noise. We will begin the AUDCAD.
Short-term technicals are suggesting a slightly bullish market. Within the next month, we could see a choppy market where price range between 0.90500 and 0.91500. This could be likely since there are no major central bank surprises expected in the next 2–4 weeks and the commodities such as oil for Canada and iron for Australia are currently stable and RBA & BoC holding rates steady as we head into December, hopefully no surprises from China.
Looking at the chart provided, we had a weekly low around 0.90671 on Tuesday right before midnight and the market rallied quickly 0.91320. This low that was created act as a strong support this week and the market attempted to break below this support and failed as buyers took advantage of a premium price near 0.90500. We end the trading week closing above 0.91000 which may indicate bullish intentions, at least for now. If price remains above 0.90500, we could see this pair trading around 0.91500 before the end of the quarter.
This is an idea, not a signal…. and we should continue looking for confirmations. Remember, we can always try to predict the market, but it’s best to know when to react.

Advanced Supply and Demand (HORC Trend + SnD StructureAfter studying the charts for some time, I’ve realized that candlesticks are all we need to make money in the market. The question is: can you read the story of market participants — where they showed their hand and revealed their intentions before a break of structure or a change of character, creating imbalances as they seek balance?
A concept called HORC is what I follow. It’s an advanced supply-and-demand framework that incorporates knowledge of participant behavior. In this series I will share what I’m looking at and my intentions.
Warning
Nothing shared here is financial advice; I am not an expert. I am still learning and figuring this out.
AUD-CAD Bullish Rebound Ahead! Buy!
Hello,Traders!
AUDCAD made a nice bearish stretch but is now hovering above a strong demand level so as the bullish pressure builds, we might see a move up towards the inefficiency above.Time Frame 5H.
Sell!
Comment and subscribe to help us grow!
Check out other forecasts below too!
Disclosure: I am part of Trade Nation's Influencer program and receive a monthly fee for using their TradingView charts in my analysis.

AUDCAD | 4H Setup | VMS StrategyGood morning,
This pair has been in a clean downtrend for about a week, but today we finally reached a strong support level — and the market reacted.
Here’s the breakdown:
🟢 Structure
Price has reached major support and just printed a bullish engulfing candle on the 4-hour chart.
📉 Momentum
Momentum is:
Low
Slightly divergent
Starting to point up
Exactly what we look for before a potential shift.
🔊 Volume (VMS Key Piece)
Volume was weak on the higher timeframes,
so we dropped down to the 15-minute chart —
and that’s where the gem appeared:
Volume 95 🔥
With structure, momentum, and now volume in alignment, this becomes a valid VMS long setup to watch.
Not financial advice — this is how we apply the VMS Strategy with precision and patience.

AUDCAD longPrice holding around higher timeframe range bound support level.
Shorter term counter trend channel breakout for entry with a target at recent highs.
RBA continues to have a more hawkish stance with economic data supporting the holding of rates. Current downside has been caused by a risk off sentiment which if continued could see the break below the higher tf range.

AUDCAD ScalpRisky scalp buys targeting Key levels. This is a low probability trade cause am overall bearish on the pair. Please risk a little

AUD/CAD – Long Setup Analysis (1H Chart)Market Structure
The pair has been in a clear downtrend, forming lower highs and lower lows. However, the current price action shows the market rejecting the lower boundary of a descending channel (marked by the yellow dotted lines). The most recent candle cluster suggests buying interest stepping in around 0.9100–0.9103.
This area acts as:
• A short-term demand zone, shown by multiple rejections.
• A reaction point within the channel structure.
This makes it a logical place for a potential long position.
The setup anticipates that price will:
1. Hold above the lower channel boundary.
2. Push upward into mid-channel structure.
3. Eventually test the upper channel resistance.
The green projection path on your chart reflects a likely stair-step bullish retracement within the overall channel.
Take Profit Levels
📍 TP1 – 0.91535
This level aligns with:
• Mid-channel structure
• A minor resistance zone visible from earlier consolidation
• A logical place for partial profits, as price often reacts here before continuing
Reaching TP1 would confirm the bullish momentum and strengthen the case for TP2.
📍 TP2 – 0.91700
This is positioned directly at the upper boundary of the descending channel, making it a strong, confluence-based target.
Reasons it’s a high-probability profit zone:
• It aligns with the projected bullish leg of the move.
• It matches previous reaction levels shown on the chart.
• Channels often cause strong reactions at their extremes.
This would represent the full realization of the long setup.
Stop-Loss Placement
The stop is set below:
• The nearest swing low
• The lower channel boundary
• Local demand zone
This protects the setup in case price invalidates the bullish scenario.
Risk/Reward
The trade offers a favorable R:R structure:
• TP1 creates a safe, conservative exit point.
• TP2 provides extended upside with channel confluence.
Given the clean structure and defined invalidation, the setup is technically sound.

AUDCAD SHORTMarket structure bearish on HTFs 3
Entry at Daily AOi
Weekly Rejection at AOi
Daily Rejection at AOi
Previous Structure point Daily
Around Psych Level 0.92000
H4 Candlestick rejection
Rejection from Previous structure
TP: WHO KNOWS!
Entry 95%
REMEMBER : Trading is a Game Of Probability
: Manage Your Risk
: Be Patient
: Every Moment Is Unique
: Rinse, Wash, Repeat!
: Christ is King.

AUDCAD Set To Grow! BUY!
My dear subscribers,
My technical analysis for AUDCAD is below:
The price is coiling around a solid key level - 0.9117
Bias - Bullish
Technical Indicators: Pivot Points Low anticipates a potential price reversal.
Super trend shows a clear buy, giving a perfect indicators' convergence.
Goal - 0.9143
About Used Indicators:
By the very nature of the supertrend indicator, it offers firm support and resistance levels for traders to enter and exit trades. Additionally, it also provides signals for setting stop losses
Disclosure: I am part of Trade Nation's Influencer program and receive a monthly fee for using their TradingView charts in my analysis.
———————————
WISH YOU ALL LUCK

AUD/CAD LONG FROM SUPPORT
Hello, Friends!
Bullish trend on AUD/CAD, defined by the green colour of the last week candle combined with the fact the pair is oversold based on the BB lower band proximity, makes me expect a bullish rebound from the support line below and a retest of the local target above at 0.917.
Disclosure: I am part of Trade Nation's Influencer program and receive a monthly fee for using their TradingView charts in my analysis.
✅LIKE AND COMMENT MY IDEAS✅


AUDCAD RISKY LONG|
✅AUDCAD is sliding into a clean demand zone where liquidity rests below recent lows. Expect a reaction as price taps this imbalance. Targeting a retracement toward the marked FVG before continuation. Time Frame 2H.
LONG🚀
✅Like and subscribe to never miss a new idea!✅

AUDCAD LONG POSITIONAustralian macroeconomic data is positive, but most Canadian microeconomic data is negative. I open a buy position based on this data and my market structure analysis, but I still lack information about the geopolitical situation. I will make an update, maybe tomorrow.

AUDCAD Forming Bullish MomentumAUD/CAD has formed a clean base around the 0.9150–0.9200 range, suggesting that buyers are defending this zone and accumulation may be underway. The recent move upward with a potential breakout in play aligns with a view that the Aussie could be set for further strength. If momentum continues, we could see AUD push toward the 0.9300–0.9400 area, which would be a compelling risk-reward opportunity for bulls.
On the macro side, there’s a strong interest rate differential working in favor of AUD. The Reserve Bank of Australia is holding its rate at 3.60%, according to recent data, while the Bank of Canada has cut its rate to 2.25%, signifying a dovish tilt. This gap draws carry flows toward the AUD from yield-seeking investors. Meanwhile, Australia’s economic growth outlook remains decent, with the RBA projecting GDP to grow by around 2.0% in December 2025.
Commodity plays also support AUD strength: as a major exporter of raw materials, Australia benefits when global demand remains firm. That said, downside risks exist. A sharper-than-expected economic slowdown in Canada, combined with further rate cuts, could weigh on the loonie and reinforce AUD strength. On the flip side, if Australia faces inflationary pressures, the RBA might be forced to re-adjust its policy, which could compress the rate edge.

