AUDCAD Forming Bullish MomentumAUD/CAD has formed a clean base around the 0.9150–0.9200 range, suggesting that buyers are defending this zone and accumulation may be underway. The recent move upward with a potential breakout in play aligns with a view that the Aussie could be set for further strength. If momentum continues, we could see AUD push toward the 0.9300–0.9400 area, which would be a compelling risk-reward opportunity for bulls.
On the macro side, there’s a strong interest rate differential working in favor of AUD. The Reserve Bank of Australia is holding its rate at 3.60%, according to recent data, while the Bank of Canada has cut its rate to 2.25%, signifying a dovish tilt. This gap draws carry flows toward the AUD from yield-seeking investors. Meanwhile, Australia’s economic growth outlook remains decent, with the RBA projecting GDP to grow by around 2.0% in December 2025.
Commodity plays also support AUD strength: as a major exporter of raw materials, Australia benefits when global demand remains firm. That said, downside risks exist. A sharper-than-expected economic slowdown in Canada, combined with further rate cuts, could weigh on the loonie and reinforce AUD strength. On the flip side, if Australia faces inflationary pressures, the RBA might be forced to re-adjust its policy, which could compress the rate edge.
Australian Dollar/Canadian Dollar
No trades
Trade ideas


AUDCAD: Bullish Continuation & Long Trade
AUDCAD
- Classic bullish pattern
- Our team expects retracement
SUGGESTED TRADE:
Swing Trade
Buy AUDCAD
Entry - 0.9155
Stop - 0.9145
Take -0.9173
Our Risk - 1%
Start protection of your profits from lower levels
Disclosure: I am part of Trade Nation's Influencer program and receive a monthly fee for using their TradingView charts in my analysis.
❤️ Please, support our work with like & comment! ❤️

AAA PLUS SET UPAUDCAD
13/11/25 1pm UK
H4
head and shoulders
3pin candlestick
fib 78.6 - AAA Plus
he Dow Jones pulled back from all-time highs on Thursday, falling back below 48,000.
With an end to the US government shutdown now in sight, investor apprehension is back on the rise.
The AI trade is losing steam as tech stocks continue to backslide.

BearsUnless the weekly resistance up top is broken a return to the Weekly FVG is a valid option otherwise a buy towards 0.93956 will become our next target we await the market to give us a direction

AUDCAD ShortWe are in a downtrend. We are creating Lower low, higher Low. We are looking to go short and target a new low.

Bearswe habe been on the upper reistance and a pullback towards the 0.71-0.79 region gives us another entry after 1st entry on same region on the daily chart. there is also a formation of the ChoCh whi unless broken we will make our biase into sellsso now we look to break the low formed in the formation of ChoCh

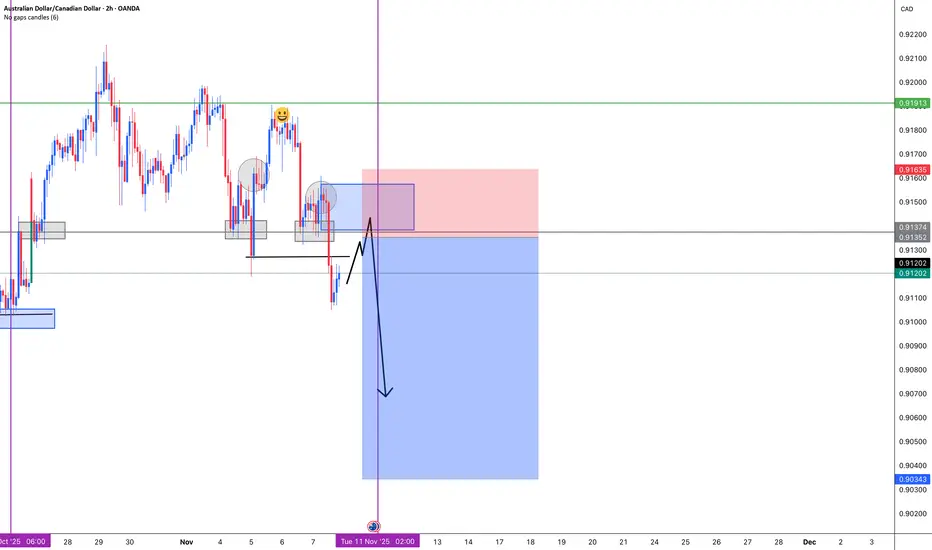
AUDCAD – 2618 Trading Strategy + 3-Bar Reversal ConfirmationThis setup is a textbook example of the 2618 trading strategy combined with a strict 3-Bar Reversal trigger for entry.
First leg: Market breaks structure, taking out prior lows.
Retracement: Price retraces back into the 61.8% Fibonacci level.
Confirmation: A 3-Bar Reversal forms, providing the entry signal.
Entry: Short position placed at confirmation of the 3-Bar setup.
Stops: Positioned above the retracement highs to protect against invalidation.
Targets: Measured at the 127.2% Fibonacci extension of the swing for optimal risk-to-reward.
📊 Why This Matters:
The 2618 strategy by itself is powerful, but pairing it with a confirmation pattern like the 3-Bar Reversal increases probability and filters out weak signals. This combination creates a disciplined, rules-based approach to trading that’s repeatable and consistent.
⚡ High-probability setup. Textbook execution. Risk defined. Reward targeted.

AUDCAD: Short Trading Opportunity
AUDCAD
- Classic bearish pattern
- Our team expects retracement
SUGGESTED TRADE:
Swing Trade
Sell AUDCAD
Entry - 0.9163
Stop - 0.9170
Take - 0.9152
Our Risk - 1%
Start protection of your profits from lower levels
Disclosure: I am part of Trade Nation's Influencer program and receive a monthly fee for using their TradingView charts in my analysis.
❤️ Please, support our work with like & comment! ❤️

AUDCAD | Bullish SetupPrice looking hot here with multiple patterns in one.
Looking for a long term swing with some day trades in between.
Overall target 🎯0.93555

Aoudad only buy set up any correction if it correct only buy setup until it breaks the previous high if it come down one more time I am looking the same thing only buy setup

RIGHT SHOULDER?Hello traders! We are taking a look at this market for a potential buy opportunity. We are waiting to see if our support level will hold after a retest of this key level. If support holds, price could give us a bullish reaction towards the 0.91900 area where Wednesday’s high was established last week. This pattern could be a right inverted shoulder where the head is last week’s low where price dipped a quickly reacted with a bullish to take out Friday’s high. We will continue to looking for other confirmations to support this idea.

AUDCAD: Downtrend, Short!AUDCAD is descending on a momentum channel of support and resistance- lower highs and lows, respecting the trendline as the principal resistance in the structure. price is presently at the lower high level, heading down progressively towards the next support.
Key points;
AUDCAD aims for 0.9088 as the next possible target.
And 0.9070 as the following partial support.
Thanks for reading.

AUDCAD is in descending channel soon breakout and pumpAs observed on the AUDCAD chart, the price has executed a decisive breakout above its previous consolidation range, indicating a preliminary shift toward bullish momentum. Currently, the price is undergoing a corrective phase within a newly formed descending channel, which represents a potential bull flag pattern. We anticipate a subsequent breakout above this channel's resistance, which would validate the pattern and likely initiate a strong bullish impulse toward our primary technical targets.
DISCLAIMER: ((trade based on your own decision))
<<press like👍 if you enjoy💚


AUDCAD: Bearish Continuation & Short Trade
AUDCAD
- Classic bearish formation
- Our team expects fall
SUGGESTED TRADE:
Swing Trade
Sell AUDCAD
Entry Level - 0.9158
Sl - 0.9169
Tp - 0.9138
Our Risk - 1%
Start protection of your profits from lower levels
Disclosure: I am part of Trade Nation's Influencer program and receive a monthly fee for using their TradingView charts in my analysis.
❤️ Please, support our work with like & comment! ❤️

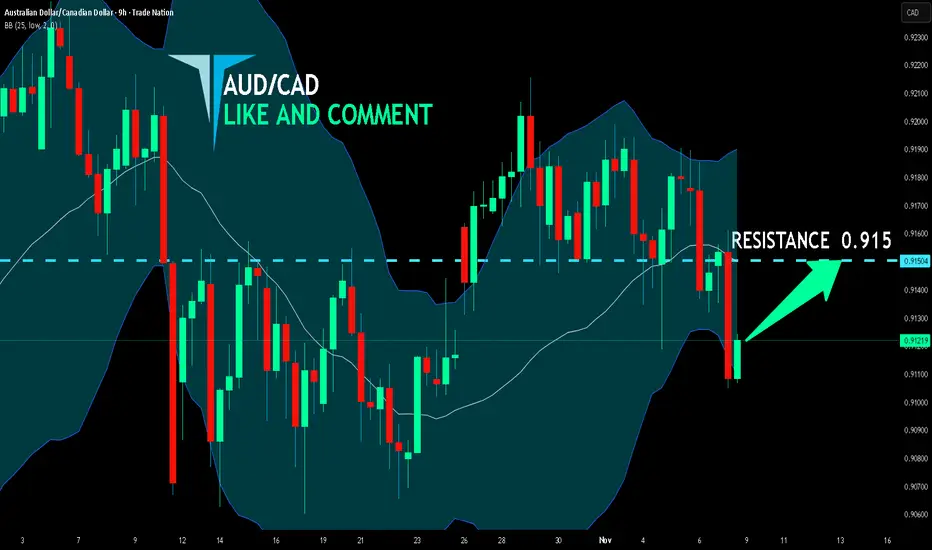
AUD/CAD SENDS CLEAR BULLISH SIGNALS|LONG
Hello, Friends!
We are targeting the 0.915 level area with our long trade on AUD/CAD which is based on the fact that the pair is oversold on the BB band scale and is also approaching a support line below thus going us a good entry option.
Disclosure: I am part of Trade Nation's Influencer program and receive a monthly fee for using their TradingView charts in my analysis.
✅LIKE AND COMMENT MY IDEAS✅

AUD/CAD Daily Market OutlookThe AUD/CAD structure on the daily timeframe is showing clear signs of bearish pressure after repeated rejections within the 0.91500–0.92270 supply zone. Price has been consolidating beneath this resistance area, forming lower highs and indicating a weakening bullish momentum.
My expectation is a continuation to the downside, targeting the next significant liquidity level around 0.84439, but the short-term confirmation zone sits at 0.90789.
At the moment, price is hovering just above 0.90789. For a cleaner and higher-probability sell scenario, I require a decisive daily close below 0.90789, followed by a bearish engulfing candle to signal strong seller dominance. Such a break would confirm that the market has transitioned from distribution into a stronger downside phase.
Trade Idea (Sell Bias):
• Entry Zone: Confirmation comes after a clear close below 0.90789 followed by an engulfing candle.
• Stop Loss: Positioned above the red zone around 0.92270, protecting against any liquidity grab or false breakout.
• Targets: The broader downside structure points to a continuation towards the lower range around 0.84439, where previous major demand sits.
This setup aligns with the prevailing market structure, the visible supply rejection, and the need for confirmation to avoid premature entries. OANDA:AUDCAD

Lingrid | AUDCAD Channel Resistance Selling OpportunityFX:AUDCAD rejected at 0.9186 resistance with a lower high under the descending trendline while stalling at the rising trendline confluence. Price action shows a series of lower highs after a range and fake break, pressing into the uptrend line from below. If 0.9186–0.9190 holds and price slips back under the blue trendline, a drift toward 0.9156 then 0.9126 support is likely; a decisive close above 0.9190–0.9200 would invalidate the short setup. Short-term momentum favors a bearish rotation within the broader resistance zone before any fresh attempt higher.
⚠️ Risks:
Strong risk-on tone in equities/commodities lifting AUD relative to CAD.
Reclaim and hold above 0.9190–0.9200, turning the confluence into support.
Sharp oil weakness undermining CAD and reducing downside follow-through.
If this idea resonates with you or you have your own opinion, traders, hit the comments. I’m excited to read your thoughts!

AUDCAD: Bearish as Aussie Struggles Against Resilient LoonieAUDCAD has come under renewed selling pressure, sliding back toward key support zones after failing to sustain gains above 0.9200. The Canadian dollar remains supported by solid employment data and oil market stability, while the Australian dollar faces headwinds from weaker Chinese demand and a cautious RBA. With momentum shifting lower, AUDCAD looks poised for further downside if support levels give way.
Current Bias
Bearish – Price is testing the lower end of its recent consolidation and risks breaking down toward 0.8950.
Key Fundamental Drivers
AUD Weakness: RBA’s cautious tone and China’s slower growth outlook weigh heavily on the Australian dollar.
CAD Strength: Stronger-than-expected labor market data and oil resilience underpin CAD.
Commodity Flows: Oil boosts CAD, while iron ore softness limits AUD upside.
Macro Context
Interest Rate Expectations: RBA remains cautious, signaling no rush to hike, while BoC is data-dependent but reluctant to cut aggressively amid still-high inflation.
Economic Growth Trends: Australia faces slowing domestic consumption, while Canada’s growth outlook is steadier, albeit with labor market slack.
Commodity Flows: CAD benefits from oil’s relative stability, while AUD remains exposed to weakening iron ore demand from China.
Geopolitical Themes: US-China tariff tensions pressure AUD more directly, while CAD benefits from closer US trade alignment.
Primary Risk to the Trend
A rebound in Chinese stimulus measures or stronger-than-expected Australian data could provide support for AUD.
Most Critical Upcoming News/Event
Australia jobs data and CPI prints – critical for RBA policy outlook.
Canada CPI – pivotal for BoC’s rate stance.
Leader/Lagger Dynamics
AUDCAD is typically a lagger, reflecting broader AUD performance against China-sensitive pairs and CAD’s alignment with oil. It follows AUDUSD trends and CAD crosses but reacts slower than majors like AUDUSD or USDCAD.
Key Levels
Support Levels:
0.9050
0.8950
Resistance Levels:
0.9160
0.9230
Stop Loss (SL): 0.9230
Take Profit (TP): 0.8950
Summary: Bias and Watchpoints
AUDCAD is bearish, with downside momentum reinforced by weak AUD fundamentals and firmer CAD drivers. A break below 0.9050 opens the path to 0.8950, while resistance at 0.9160–0.9230 caps upside. Stop loss sits above resistance at 0.9230, and profit-taking is aimed near 0.8950. Watch for Australia’s jobs/CPI data and Canada’s CPI as the key catalysts that could either reinforce or undermine this bearish setup.
