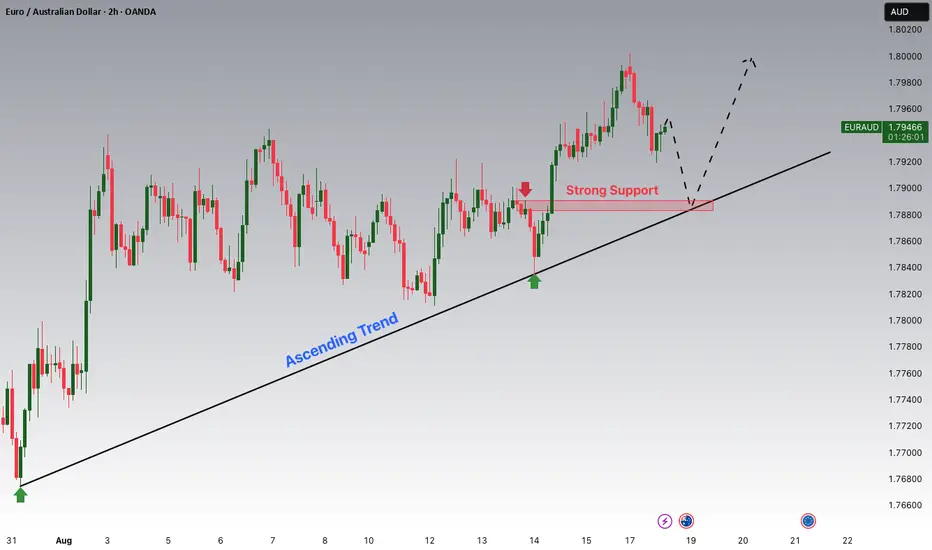
EURAUD is Nearing a Strong Support!!Hey Traders, in today's trading session we are monitoring EURAUD for a buying opportunity around 1.78900 zone, EURAUD is trading in an uptrend and currently is in a correction phase in which it is approaching the trend at 1.78900 support and resistance area.
Trade safe, Joe.
AUDEUR trade ideas
EURAUD: Important Bullish Breakout📈EURAUD has broke and closed above a significant intraday resistance level after a period of consolidation
Upon retesting the breached resistance, a positive bullish response is observed. This suggests a potential for further upward movement in the market.
The anticipated target is 1.8018.

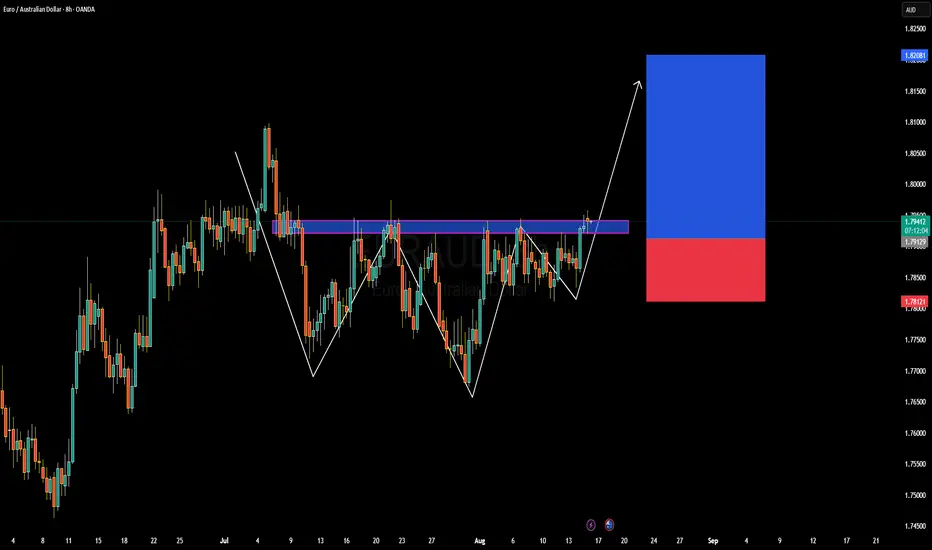
EURAUD Forming Bullish ContinuationEUR/AUD is edging above a persistent resistance zone around 1.7950–1.7970 on the 8-hour chart. The pair has formed a classic two-leg corrective structure, and the recent higher low suggests bullish continuation. A clean break and hold above this resistance could pave the way for a retest of the 1.8200 zone, offering a favorable risk-to-reward setup for trend-following traders.
On the fundamentals front, the backdrop is mixed yet slightly favoring the euro. Both the ECB and RBA remain on easing paths, but the ECB has been more active with its cuts, while market-implied positioning already prices in an RBA cut in August. This divergence, paired with soft growth in Australia and cautious optimism around Eurozone stability, supports a sustained euro bid. Omega forecasts also show projected upside for EUR/AUD into September
However, caution is warranted. ActionForex highlights that intraday bias remains neutral; a sustained break above 1.7972 is needed to validate the bullish scenario, with a move toward the 1.8196 projection thereafter. Additionally, broader sentiment suggests EUR may be overstretched, and the AUD could rebound rapidly once RBA easing is priced in
Technically, this setup offers a clean structure—especially if the breakout is confirmed with volume and a solid candle close above 1.7970. A stop beneath the breakout zone around 1.7910 would provide tight risk control. Long-term targets could range from 1.8100 to 1.8200, depending on momentum sustainability.
EUR/AUDBreakoutAbove Wedge DemandZone Support&Resistance infocusOn the 4H chart, EUR/AUD has recently broken out from a rising wedge pattern after retesting the demand zone around 1.7800–1.7850. Price action shows a strong bullish attempt while holding above key support levels.
Key points from the structure:
Rising wedge pattern followed by a breakout confirmation.
Strong demand zone support near 1.7800, aligning with previous BOS levels.
Current resistance lies around 1.8000–1.8100, which remains the next target for bulls.
If demand holds, a bullish continuation toward 1.8100 resistance area is possible.
On the other hand, a break back below 1.7800 may weaken momentum and expose the 1.7700 support zone.
This setup highlights both bullish breakout opportunities and risk of pullback, making the upcoming sessions crucial for directional confirmation.
This post is for educational purposes only, not financial advice. Always use proper risk management and follow your trading plan.

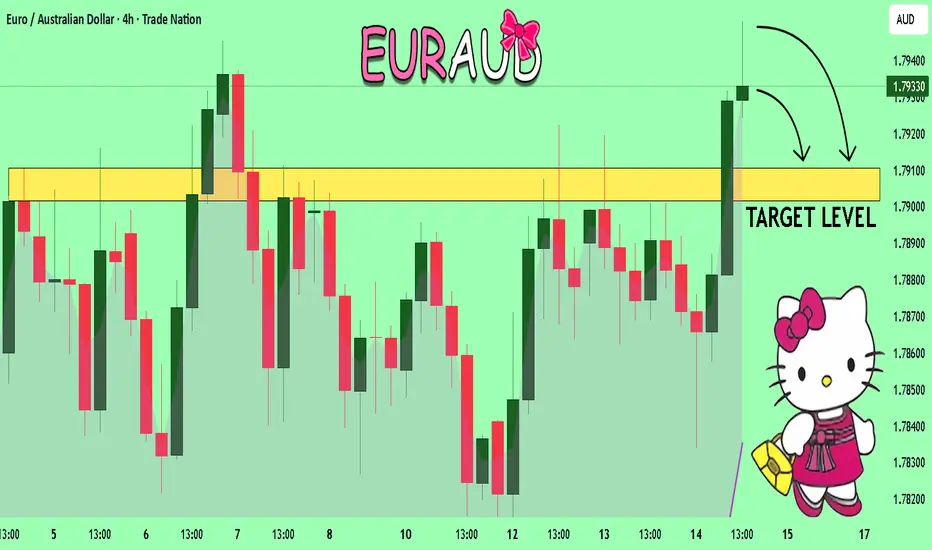
EUR/AUD – Second Chance for Bears?About a month ago, I drew attention to a potential long-term short setup on EUR/AUD, highlighting that the pair had formed a measured move pattern after the sharp drop from 1.85.
Since then, price broke below the rising trendline, but at that moment the drop lacked follow-through, and EUR/AUD bounced back. This bounce may now be a retest of the broken ascending trendline.
If this is the case, bears could get a second chance to enter at higher levels, with the overall bearish structure still intact.
Trading Plan: Selling around 1.79 could offer a solid medium-to-long-term opportunity, with a risk–reward ratio of approximately 1:2.5.
Disclosure: I am part of TradeNation's Influencer program and receive a monthly fee for using their TradingView charts in my analyses and educational articles.

EUR/AUD Technical analysis - 081402025I have a positive view on EUR/AUD at this point! Look like a sell but for me at this time it look like a buyyyyyy

EURAUD, We are still in.In the higher timeframes, the pair is bullish, very, and that's where the problem is, that there aren't recent structures to break to signify a trend shift.
In the weekly timeframe, the pair is still bullish, facing the same monthly situation of lacking recent structures.
In the daily timeframe though, the outlook is different, although there aren't any near trend ending structures, but there are retracement broken structures which we can use to define the trends, with which we are currently in the daily validation level.
In the lower timeframes we are bearish while confluence with the daily level we get a low risk high probability entry.
We are risking as low as 14 Pips, while targeting a potential RRR of 1:20+.
DISCLAIMER: Trade with caution.

EURUAD LOOKING PROMISING FOR A BUY!!!! WATCHOUT Here’s H1 timeframe on EURUAD and we’re looking forward to buying upon the break/retest of 1.79228 Technical analysis suggest the possible buy opportunity as we see a break of the previous local trendline and a retest to it which signals bullish strength . Therefore, we plan to go long on this pair.

EURAUD to find support at market price?EURAUD - 24h expiry
There is no clear indication that the upward move is coming to an end.
Although we remain bullish overall, a correction is possible with plenty of room to move lower without impacting the trend higher.
Risk/Reward would be poor to call a buy from current levels.
A move through 1.7975 will confirm the bullish momentum.
The measured move target is 1.8050.
We look to Buy at 1.7950 (stop at 1.7915)
Our profit targets will be 1.8025 and 1.8050
Resistance: 1.7975 / 1.8000 / 1.8025
Support: 1.7950 / 1.7925 / 1.7915
Risk Disclaimer
The trade ideas beyond this page are for informational purposes only and do not constitute investment advice or a solicitation to trade. This information is provided by Signal Centre, a third-party unaffiliated with OANDA, and is intended for general circulation only. OANDA does not guarantee the accuracy of this information and assumes no responsibilities for the information provided by the third party. The information does not take into account the specific investment objectives, financial situation, or particular needs of any particular person. You should take into account your specific investment objectives, financial situation, and particular needs before making a commitment to trade, including seeking, under a separate engagement, as you deem fit.
You accept that you assume all risks in independently viewing the contents and selecting a chosen strategy.
Where the research is distributed in Singapore to a person who is not an Accredited Investor, Expert Investor or an Institutional Investor, Oanda Asia Pacific Pte Ltd (“OAP“) accepts legal responsibility for the contents of the report to such persons only to the extent required by law. Singapore customers should contact OAP at 6579 8289 for matters arising from, or in connection with, the information/research distributed.

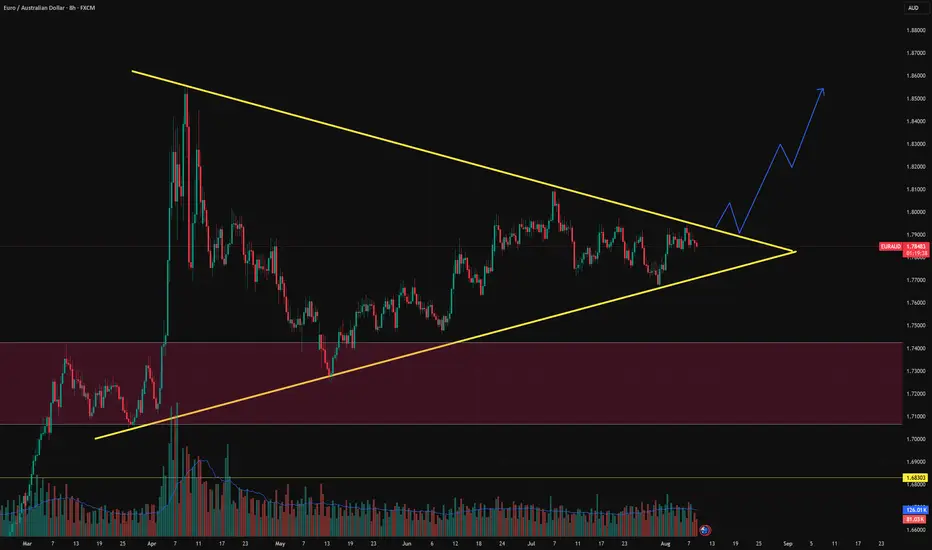
EUR/AUD Analysis – Symmetrical Triangle FormationKey Observations:
Pattern Type: Symmetrical triangle with converging trendlines.
Higher lows show demand stepping in.
Lower highs signal sellers defending resistance.
Volume Profile: Volume is tapering off, aligning with triangle logic → explosive move likely upon breakout.
Liquidity Pool Below: Large liquidity zone marked around 1.68300–1.74000, previously acted as accumulation base and demand zone.
Price Behavior: Currently nearing apex; compression suggests volatility expansion imminent.
EURAUD to find buyers at market price?EURAUD - 24h expiry
Indecisive price action has resulted in sideways congestion on the intraday chart.
RSI (relative strength indicator) is flat and reading close to 50 (mid-point) highlighting the fact that we are non- trending.
Risk/Reward would be poor to call a buy from current levels.
A move through 1.7950 will confirm the bullish momentum.
The measured move target is 1.8000.
We look to Buy at 1.7920 (stop at 1.7885)
Our profit targets will be 1.7995 and 1.8000
Resistance: 1.7950 / 1.7975 / 1.8000
Support: 1.7920 / 1.7900 / 1.7885
Risk Disclaimer
The trade ideas beyond this page are for informational purposes only and do not constitute investment advice or a solicitation to trade. This information is provided by Signal Centre, a third-party unaffiliated with OANDA, and is intended for general circulation only. OANDA does not guarantee the accuracy of this information and assumes no responsibilities for the information provided by the third party. The information does not take into account the specific investment objectives, financial situation, or particular needs of any particular person. You should take into account your specific investment objectives, financial situation, and particular needs before making a commitment to trade, including seeking, under a separate engagement, as you deem fit.
You accept that you assume all risks in independently viewing the contents and selecting a chosen strategy.
Where the research is distributed in Singapore to a person who is not an Accredited Investor, Expert Investor or an Institutional Investor, Oanda Asia Pacific Pte Ltd (“OAP“) accepts legal responsibility for the contents of the report to such persons only to the extent required by law. Singapore customers should contact OAP at 6579 8289 for matters arising from, or in connection with, the information/research distributed.

EURAUD Will Fall! Short!
Here is our detailed technical review for EURAUD.
Time Frame: 1D
Current Trend: Bearish
Sentiment: Overbought (based on 7-period RSI)
Forecast: Bearish
The market is on a crucial zone of supply 1.787.
The above-mentioned technicals clearly indicate the dominance of sellers on the market. I recommend shorting the instrument, aiming at 1.763 level.
P.S
Please, note that an oversold/overbought condition can last for a long time, and therefore being oversold/overbought doesn't mean a price rally will come soon, or at all.
Disclosure: I am part of Trade Nation's Influencer program and receive a monthly fee for using their TradingView charts in my analysis.
Like and subscribe and comment my ideas if you enjoy them!


EUR/AUD Technical Analysis – Diamond Breakout Signals Bullish
---
🇪🇺🇦🇺
In recent sessions, EUR/AUD has been trading within a broader sideways structure, with a temporary uptrend forming inside that range. This corrective move evolved into a falling wedge, a classic bullish pattern. But what truly stands out is the emergence of a diamond formation, a rare but powerful reversal signal.
🔹 The diamond pattern has now been broken to the upside, and price has successfully retested the breakout zone, confirming bullish intent A.
📈 Upside Targets:
• 1.81058
• 1.83000
🛑 Stop-loss: Below 1.77700, to protect against false breakouts or unexpected reversals.
This setup suggests strong bullish momentum ahead, especially with the diamond breakout acting as a technical catalyst. Traders should watch for volume confirmation and continuation signals in the coming sessions.
---

EUR/AUD BEARISH BIAS RIGHT NOW| SHORT
Hello, Friends!
Previous week’s green candle means that for us the EUR/AUD pair is in the uptrend. And the current movement leg was also up but the resistance line will be hit soon and upper BB band proximity will signal an overbought condition so we will go for a counter-trend short trade with the target being at 1.796.
Disclosure: I am part of Trade Nation's Influencer program and receive a monthly fee for using their TradingView charts in my analysis.
✅LIKE AND COMMENT MY IDEAS✅

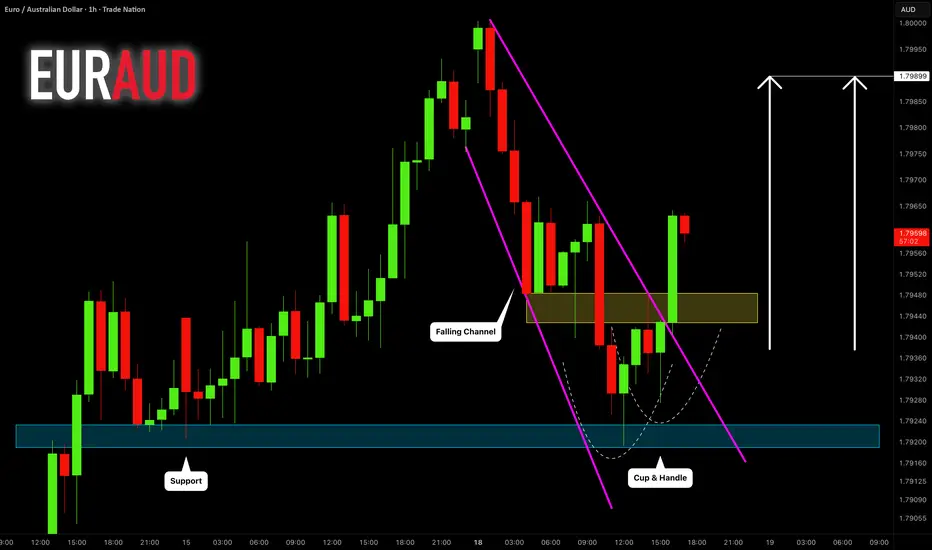
EURAUD: Trend Following Trading 🇪🇺 🇦🇺
EURAUD completed a correctional movement after a strong bullish wave.
The price nicely respected a key intraday horizontal support
and formed a cup and handle pattern on that.
Its neckline breakout with an imbalance candle provides
a strong bullish confirmation.
I expect a rise to 1.799
❤️Please, support my work with like, thank you!❤️
I am part of Trade Nation's Influencer program and receive a monthly fee for using their TradingView charts in my analysis.
EURAUD analysis elliot. Don't forget about stop-loss.
Write in the comments all your questions and instruments analysis of which you want to see.
Friends, push the like button, write a comment, and share with your mates - that would be the best THANK YOU.
P.S. I personally will open entry if the price will show it according to my strategy.
Always make your analysis before a trade

EURAUD ON THE WAY TO FILL FVG ? - {12/08/2025}Educational Analysis says that EURAUD (FX Pair) may give trend Trading opportunities from this range, according to my technical analysis.
Broker - FXCM
So, my analysis is based on a top-down approach from weekly to trend range to internal trend range.
So my analysis comprises of two structures: 1) Break of structure on weekly range and 2) Trading Range to fill the remaining fair value gap
Let's see what this Stock brings to the table for us in the future.
DISCLAIMER:-
This is not an entry signal. THIS IS FOR EDUCATIONAL PURPOSES ONLY.
I HAVE NO CONCERNS WITH YOUR PROFITS OR LOSS,
Happy Trading,
FX Pairs & Crypto Curreny Trade Analysis.
My Analysis is:-
Short term trend may be go to the external demand zone.
Long term trend breaks the new high after going from discount zone.
Short trade idea analysis (Education Purpose)
Confirmation - InternalCHOch
Market Order @$1.78755
Stop loss @1.78957
Take profit @1.69231
Please check the comment section to see how this turned out.

Buy EUR/AUD after retest of broken trendline and consolidation.EUR/AUD has been consolidating for the last couple of weeks and has now broken higher.
EUR crosses look strong and the commodities currencies appear weak so I expect more gains to retrace much of the April high this year.
Buy : 1.7905 retest broken trendline (now support)
Stop : 1.78065 under consolidation lows
Profit : 1.8250 before 78.6% Daily Fib retracement of April 2025 high
Risk 1 : 3.5

EURAUD – Bullish Momentum Targets 1.7944 & 1.7975 On the 1H chart, EURAUD has bounced strongly from a well-respected Support Zone, reclaiming ground above the 200 EMA, which now acts as a dynamic support. This strong reaction is in line with my bullish bias for the pair.
Fib extension levels are pointing toward upside targets, with the first key level at 1.7944 (1.618 Fib). If momentum holds, my next target is 1.7975 (Fib 2.0). A daily close above these zones could open the path for further gains toward the 1.8000+ psychological level.
📈 Bias – Bullish
📍 Key Support – Strong Support Zone & 200 EMA
🎯 Target Levels – 1.7944 → 1.7975 → 1.8000+

: EUR/AUD | Rising Wedge Pattern Near Key ResistanceEUR/AUD has been consolidating after forming a clear Rising Wedge structure between the first peak (Top 1) and the second peak (Top 2). Price action has recently tested the resistance area around 1.7860–1.7900, while holding above a demand zone near 1.7820.
From a market structure perspective:
CHoCH (Change of Character) signals earlier in the chart indicate a shift in momentum.
BOS (Break of Structure) confirmed a bearish move before price found support around the 1.7700 level.
The demand zone has been respected multiple times, showing active buyers.
At this stage, two key scenarios are in play:
Bullish Breakout: If price closes strongly above the wedge resistance and 1.7900, we could see a continuation toward the strong high at 1.8101.
Bearish Rejection: Failure to break the resistance may cause a pullback toward the support zone near 1.7700, which is also aligned with a previous weak low.
Trading Approach:
Wait for a confirmed breakout with volume before entering a long trade toward the 1.8100 zone.
Watch for bearish rejections with confirmation candles if considering short positions back to the support level.
Risk management is essential—avoid entering before confirmation to reduce false breakout risks.
Key Levels to Watch:
Resistance: 1.7900 – 1.8101
Demand Zone: 1.7820 – 1.7850
Support Level: 1.7700 – 1.7720
The upcoming sessions could bring volatility, so patience and confirmation will be the key to trading this setup effectively.

EURAUD EURAUD CURRENT PRICEACTION IS 1.79338
EURAUD 1.79207 DEMAND FLOOR AND 1.79207 DEFENDED WE ARE LOOKING AT 1.81278
Interest Rates
Eurozone (ECB):
Main refinancing rate: 2.15%
Deposit facility rate: 2.00%
Policy remains on hold after eight cuts over the past year, with the ECB noting inflation is at target and adopting a wait-and-see approach due to trade uncertainty.
Australia (RBA):
Official cash rate: 3.60%
The Reserve Bank of Australia cut rates by 0.25% on August 12, 2025, as inflation continues to fall and the labor market gradually loosens, signaling more cuts may follow.
Bond Yields
Eurozone:
5-year central government bond yield: 2.49% (as of August 14, 2025)
10-year government bond yield: 2.79% (as of August 14, 2025)
Yields have slightly increased due to global tariff pressures and investor demand for higher compensation on longer maturities.
Australia:
10-year government bond yield: 4.262% (August 18, 2025)
30-year bond yield: 5.02% (August 18, 2025)
The 10-year yield is up 0.05 percentage points from the previous session.
Summary Table
Region Policy Rate 10Y Bond Yield 5Y Bond Yield Last Policy Action
Eurozone 2.15% 2.793% 2.49% Hold (July 2025)
Australia 3.60% 4.262% — Cut (-0.25%) Aug 12, 2025
These updated figures reflect the monetary stance and market yields currently influencing EURAUD and investment flows.
#EURAUD

EURAUD Set To Fall! SELL!
My dear subscribers,
This is my opinion on the EURAUD next move:
The instrument tests an important psychological level 1.7938
Bias - Bearish
Technical Indicators: Supper Trend gives a precise Bearish signal, while Pivot Point HL predicts price changes and potential reversals in the market.
Target - 1.7910
About Used Indicators:
On the subsequent day, trading above the pivot point is thought to indicate ongoing bullish sentiment, while trading below the pivot point indicates bearish sentiment.
Disclosure: I am part of Trade Nation's Influencer program and receive a monthly fee for using their TradingView charts in my analysis.
———————————
WISH YOU ALL LUCK