AUDJPY Technical & Order Flow AnalysisOur analysis is based on a multi-timeframe top-down approach and fundamental analysis.
Based on our assessment, the price is expected to return to the monthly level.
DISCLAIMER: This analysis may change at any time without notice and is solely intended to assist traders in making independent investment decisions. Please note that this is a prediction, and I have no obligation to act on it, nor should you.
Please support our analysis with a boost or comment!
AUDJPY trade ideas

Monthly, weekly and dally trendlines with downtrend canalWaiting for downside brake out
Daly trend line is rejected, aiming for retest on red weekly trendline

AUDJPY - NEW BREAKOUT!Hello Traders!
The AUDJPY broke the resistance level (96.205 - 96.075).
This key level becomes new support!
So, I expect a bullish move🚀
______________
TARGET: 96.810🎯

AudJpy shortsThe higher timeframe bearish narrative still in play. Price is taking out a daily candle high (turtle soup) in a 4h fvg. I intend using the median of the gap as my entry and targeting the weekly candle low.

AUD/JPY is retesting breakout Looking for the 88.71 target in the upcoming days. Stop loss:96.90
Note: Education purpose only.
AUD/JPY Ready To Go Up And Give Us 100 Pips , Are You Ready ?Here is my 2H Chart on AUD /JPY , We Have A Clear Breakout and the price closed above my old res and new support and we have a very good bullish Price Action on 1 And 2 Hours T.F Also the price trying to retest the area now and giving a good bullish price action on smaller time frames , , So i see it`s a good chance to buy this pair now and we can targeting from 70 to 150 pips . and if we have a daily closure again below my new res then this idea will not be valid anymore .

AUDJPY - The Bears Are Still Strong!Hello TradingView Family / Fellow Traders. This is Richard, also known as theSignalyst.
📈AUDJPY has been overall bearish trading within the falling broadening wedge pattern marked in red and it is currently retesting the upper bound of the channel acting as a non-horizontal resistance.
Moreover, the blue zone is a strong resistance.
📚 As per my trading style:
As #AUDJPY retests the red circle zone, I will be looking for bearish reversal setups (like a double top pattern, trendline break , and so on...)
📚 Always follow your trading plan regarding entry, risk management, and trade management.
Good luck!
All Strategies Are Good; If Managed Properly!
~Richard Nasr

BTC and AJ longsNext impulsive wave is on the horizon for BTC.
Targetting momentum on the Ozzy as well.
NFA

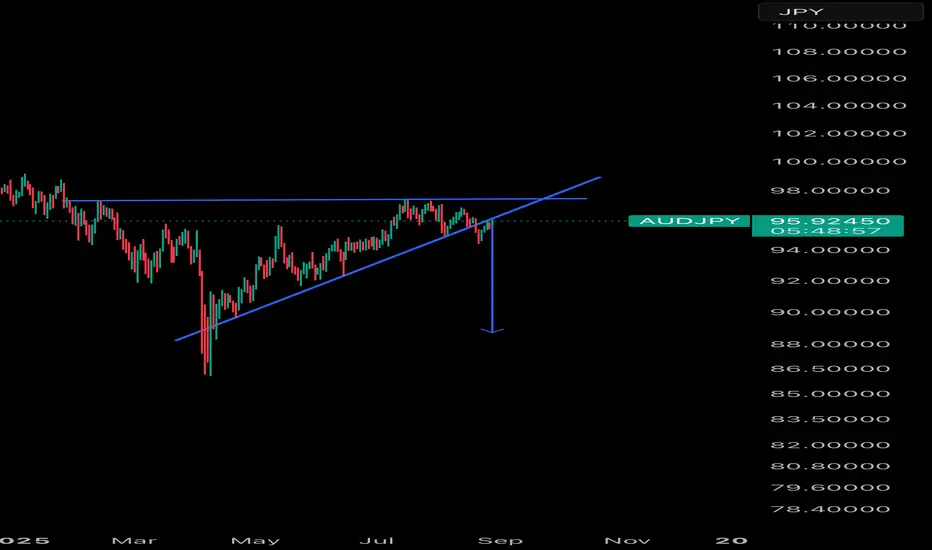
AUDJPY – Rounding Top Breakdown Signals Bearish ContinuationAUDJPY has completed a Rounding Top Pattern on the 4H timeframe, with a clean breakout below the neckline support around the 95.00 area.
The pair failed to sustain above the resistance zone near 97.50–98.00.
Structure shift confirms a downtrend, with price forming lower highs and breaking strong supports.
As long as the price stays below the neckline, sellers may target the next support zone around 92.50–93.00.
A retest of the broken neckline could offer fresh short opportunities, while bulls must reclaim 96.00 to invalidate the bearish outlook.
This analysis is for educational purposes only, not financial advice.

Bearish reversal?AUD/JPY is rising towards the resistance level, which is an overlap resistance, and could reverse from this level to our take-profit.
Entry: 96.12
Why we like it:
There is a pullback resistance level.
Stop loss: 96.73
Why we like it:
There is a swing high resistance level.
Take profit: 95.17
Why we like it:
There is a pullback support.
Enjoying your TradingView experience? Review us!
Please be advised that the information presented on TradingView is provided to Vantage (‘Vantage Global Limited’, ‘we’) by a third-party provider (‘Everest Fortune Group’). Please be reminded that you are solely responsible for the trading decisions on your account. There is a very high degree of risk involved in trading. Any information and/or content is intended entirely for research, educational and informational purposes only and does not constitute investment or consultation advice or investment strategy. The information is not tailored to the investment needs of any specific person and therefore does not involve a consideration of any of the investment objectives, financial situation or needs of any viewer that may receive it. Kindly also note that past performance is not a reliable indicator of future results. Actual results may differ materially from those anticipated in forward-looking or past performance statements. We assume no liability as to the accuracy or completeness of any of the information and/or content provided herein and the Company cannot be held responsible for any omission, mistake nor for any loss or damage including without limitation to any loss of profit which may arise from reliance on any information supplied by Everest Fortune Group.

Possible sell on AudJpyPrice took out buyside liquidity then gave market structure shift down. It gave turtle soup. Although it’s a low probability set up

audjpy sell signal. Don't forget about stop-loss.
Write in the comments all your questions and instruments analysis of which you want to see.
Friends, push the like button, write a comment, and share with your mates - that would be the best THANK YOU.
P.S. I personally will open entry if the price will show it according to my strategy.
Always make your analysis before a trade

AUD-JPY Will Grow! Buy!
Hello,Traders!
AUD-JPY is trading in a
Local uptrend and the pair
Is already making a bullish
Rebound from the horizontal
Support of 95.503 so we are
Locally bullish biased
And we will be expecting a
Further bullish move up
Buy!
Comment and subscribe to help us grow!
Check out other forecasts below too!
Disclosure: I am part of Trade Nation's Influencer program and receive a monthly fee for using their TradingView charts in my analysis.

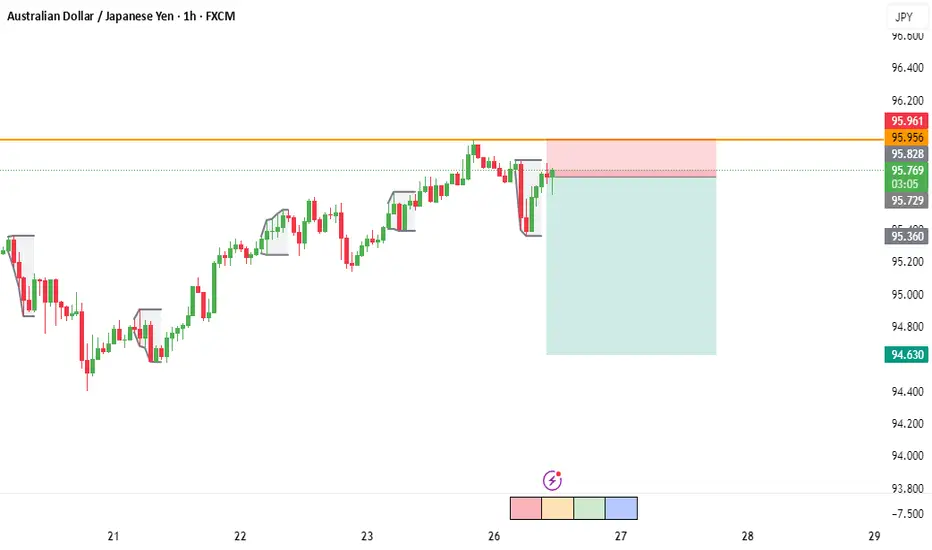
AUD/JPY – Short Setup | 1H ChartAUD/JPY is reacting strongly to a key resistance zone near 95.95 – 96.00.
The pair shows rejection wicks and a potential lower-high formation, indicating sellers stepping in.
Entry: 95.75
Stop Loss: 95.96 (above resistance)
Target: 94.63 (next demand zone)
Risk-to-Reward: ~1:5
This setup aligns with structure rejection at supply and continuation of bearish momentum.
📉 Monitoring for follow-through price action confirmation.
🔎 #AUDJPY #Forex #PriceAction #TradingView #FXAnalysis #SupplyAndDemand #ForexTrading #SwingTrade #RiskReward #JPY
1 to 1 on AUDJPY A very nice 1:1 correction is emerging on AUDJPY. It connects with the trend line and internal Fibo measurement. Join the discussion.

Wedge to Pivot - sellGot a rejection on the 4H bar
from pivot lines
seems like a good RR evev when its end of week and end of month

AUDJPY POSSIBLE MOVEPrice just broke and retets the major resistance as support forming a bullish continuation chart pattern. wait for price to completely break and retest the pendant to go long.
Alternatively, if the price should break below the current major support, we go short to the trend.

Short buddy!!!My 4 confluences have been triggered.
Divergence on pull back from initial drop, divergence again from previous drop and trading divergence in a premium zone.
My target for this week is
94.500-94.200
What are your thoughts?
Trade safely my friends

AUDJPY-BEARISH IDEAAUDJPY is in bearish trend as it broked its major trenline and now moving in a bearish channel.

AUDJPYAUDJPY is showing bullish signals, suggesting potential upside momentum. Traders are waiting for confirmation to enter buy positions.

AUDJPYWeekly came back to a major resistance zone and gave a bearish engulfing candle last week of July. Daily broke support zone and trendline support. Made a retest of Daily zone and H1 looks to have formed a head and shoulder. This could be a long swing trade.


Bearish drop off 50% Fibonacci resistance?AUD/JPY has rejected off the pivot and could drop to the 1st support.
Pivot: 96.14
1st Support: 95.04
1st Resistance: 96.67
Risk Warning:
Trading Forex and CFDs carries a high level of risk to your capital and you should only trade with money you can afford to lose. Trading Forex and CFDs may not be suitable for all investors, so please ensure that you fully understand the risks involved and seek independent advice if necessary.
Disclaimer:
The above opinions given constitute general market commentary, and do not constitute the opinion or advice of IC Markets or any form of personal or investment advice.
Any opinions, news, research, analyses, prices, other information, or links to third-party sites contained on this website are provided on an "as-is" basis, are intended only to be informative, is not an advice nor a recommendation, nor research, or a record of our trading prices, or an offer of, or solicitation for a transaction in any financial instrument and thus should not be treated as such. The information provided does not involve any specific investment objectives, financial situation and needs of any specific person who may receive it. Please be aware, that past performance is not a reliable indicator of future performance and/or results. Past Performance or Forward-looking scenarios based upon the reasonable beliefs of the third-party provider are not a guarantee of future performance. Actual results may differ materially from those anticipated in forward-looking or past performance statements. IC Markets makes no representation or warranty and assumes no liability as to the accuracy or completeness of the information provided, nor any loss arising from any investment based on a recommendation, forecast or any information supplied by any third-party.
