AUDJPY; Heikin Ashi Trade IdeaIn this post, I’ll be sharing my analysis of AUDJPY with my unique Heikin Ashi strategy.Picture tells more than 1000 words, no BS. I highlight key areas where I’m anticipating potential opportunities.
I’m always happy to receive any feedback.
Like, share and comment! ❤️
Trade ideas
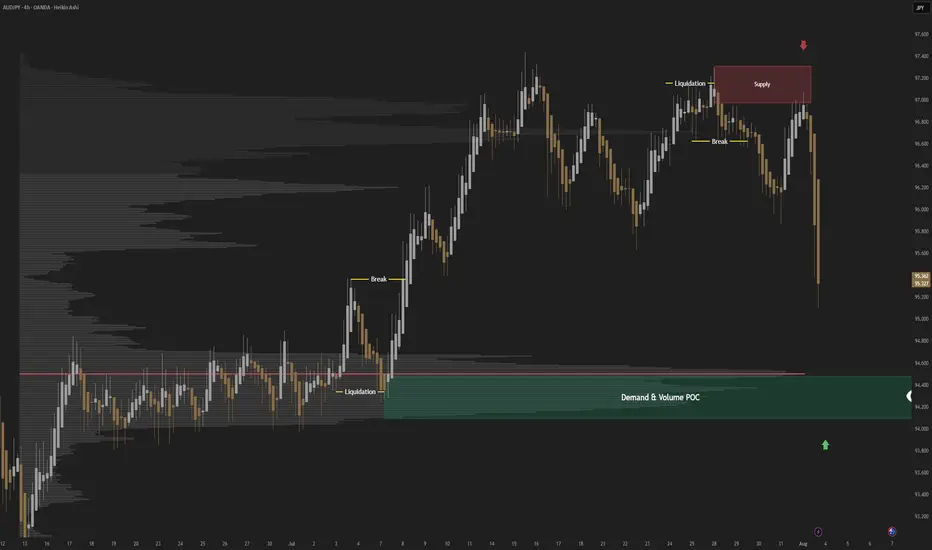
AUDJPY; Heikin Ashi Trade Idea📈 Hey Traders!
Here’s a fresh outlook from my trading desk. If you’ve been following me for a while, you already know my approach:
🧩 I trade Supply & Demand zones using Heikin Ashi chart on the 4H timeframe.
🧠 I keep it mechanical and clean — no messy charts, no guessing games.
❌ No trendlines, no fixed sessions, no patterns, no indicator overload.
❌ No overanalyzing market structure or imbalances.
❌ No scalping, and no need to be glued to the screen.
✅ I trade exclusively with limit orders, so it’s more of a set-and-forget style.
✅ This means more freedom, less screen time, and a focus on quality setups.
✅ Just a simplified, structured plan and a calm mindset.
💬 Let’s Talk:
💡Do you trade supply & demand too ?
💡What’s your go-to timeframe ?
💡Ever tried Heikin Ashi ?
📩 Got questions about my strategy or setup? Drop them below — ask me anything, I’m here to share.
Let’s grow together and keep it simple. 👊

AUDJPY Trade Idea. Bearish.AUDJPY Trade Idea. Bearish.
Posible Trade bearish.
I'll wait for a 1H Bearish Candle.


AUDJPY Trade Idea 2025/08/22AJ has failed at the 95.6 level again. Yesterday, it experienced a meltdown of 174 points from the swing high to the swing low. This is a key higher timeframe support and resistance zone.
With the flow of the bear market structure, the price is now bouncing back to retest the level, also the Fib 0.5 zone from where it began to melt.

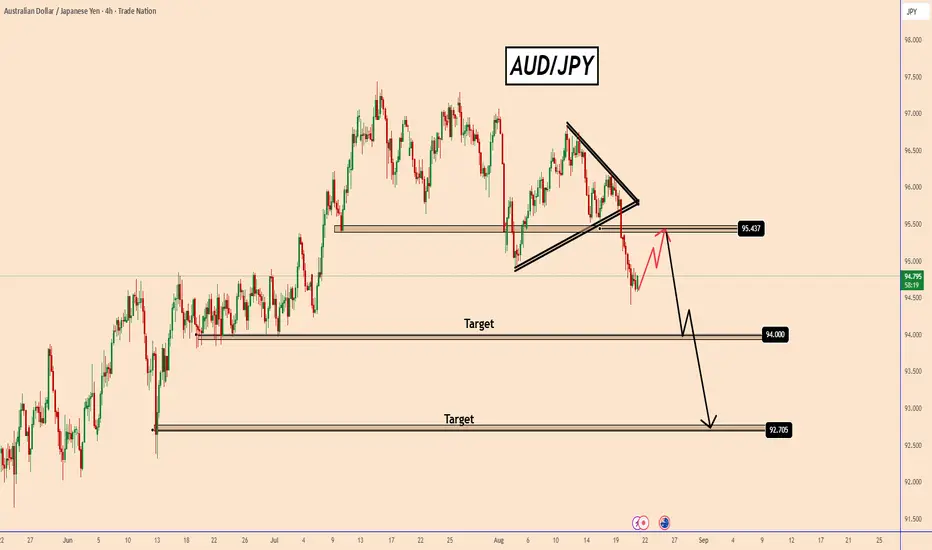
AUDJPY Triangle Breakdown: Retracement Before Deeper DropAUDJPY Triangle Breakdown: Retracement Before Deeper Drop
Two days ago, AUDJPY broke down from a well-defined triangle pattern, triggering a bearish move.
However, the JPY remains fundamentally weak, driven more by speculative headlines than a normal strength.
This imbalance suggests that AUDJPY could retrace higher, potentially reaching 95.40 before resuming its downward trajectory toward 94.00 and 92.70.
On the macro front, Australia continues to show signs of economic improvement, which adds resilience to the AUD. Given this backdrop, a sharp decline may be limited unless broader risk sentiment shifts.
You may find more details in the chart!
Thank you and Good Luck!
PS: Please support with a like or comment if you find this analysis useful for your trading day
Disclosure: I am part of Trade Nation's Influencer program and receive a monthly fee for using their TradingView charts in my analysis.
AUD-JPY Resistance Ahead! Sell!
Hello,Traders!
AUD-JPY keeps going up
And the pair is locally oversold
So after it hits the horizontal
Resistance of 95.607 we
Will be expecting a local
Bearish correction
Sell!
Comment and subscribe to help us grow!
Check out other forecasts below too!
Disclosure: I am part of Trade Nation's Influencer program and receive a monthly fee for using their TradingView charts in my analysis.

AUDJPY SELL BEARISH STRUCTURE AJ has broken through my Daily Support zone and is looking to retest the 4hr ema or the 1hour 200 ema to make a lower high to push down further.

AUD/JPYI’ve entered a personal long position on AUD/JPY at 94.85, split across 5 entries with 0.50% risk each (total risk: 2%). Stop loss is set at 92.30. Planning to hold this as a medium to long-term trade. I’ll update the take profit level later.

AUDJPY-BullishAUDJPY is in a longterm bullish uptrend.
We have a daily engulfing bullish candle.
I am expecting an upside.

AUD/JPY Bounces Back from Fresh Monthly LowAUD/USD bounces back from a fresh monthly low (94.04) to halt the recent series of lower highs and lows, and a close above the 95.10 (38.2% Fibonacci extension) to 95.20 (23.6% Fibonacci extension) region may push the exchange rate back toward the monthly high (97.07).
A breach of the July high (97.43) opens up the 97.90 (23.6% Fibonacci extension) to 98.30 (38.2% Fibonacci retracement) area, with the next region of interest coming in around the January high (99.17).
However, failure to hold/close above the 95.10 (38.2% Fibonacci extension) to 95.20 (23.6% Fibonacci extension) region may lead to a test of the July low (93.97), with the next area of interest coming in around 92.80 (50% Fibonacci extension) to 93.30 (23.6% Fibonacci extension).
--- Written by David Song, Senior Strategist at FOREX.com

AUDJPY support at 94.37The AUDJPY remains in a bullish trend, with recent price action showing signs of a corrective pullback within the broader uptrend.
Support Zone: 94.37 – a key level from previous consolidation. Price is currently testing or approaching this level.
A bullish rebound from 94.37 would confirm ongoing upside momentum, with potential targets at:
96.60 – initial resistance
97.00 – psychological and structural level
97.35 – extended resistance on the longer-term chart
Bearish Scenario:
A confirmed break and daily close below 94.37 would weaken the bullish outlook and suggest deeper downside risk toward:
93.95 – minor support
93.55 – stronger support and potential demand zone
Outlook:
Bullish bias remains intact while the AUDJPY holds above 94.37. A sustained break below this level could shift momentum to the downside in the short term.
This communication is for informational purposes only and should not be viewed as any form of recommendation as to a particular course of action or as investment advice. It is not intended as an offer or solicitation for the purchase or sale of any financial instrument or as an official confirmation of any transaction. Opinions, estimates and assumptions expressed herein are made as of the date of this communication and are subject to change without notice. This communication has been prepared based upon information, including market prices, data and other information, believed to be reliable; however, Trade Nation does not warrant its completeness or accuracy. All market prices and market data contained in or attached to this communication are indicative and subject to change without notice.

AUDJPY Long Setup – 1H TimeframeAUDJPY is showing signs of reversal after a strong bearish move. Price respected the 94.55 support zone and has since broken back above 95.00 minor resistance, signaling possible bullish momentum.
Entry: Around 94.87 – 95.00
Stop Loss: Below 94.55 (recent support)
Take Profit 1: 95.60
Take Profit 2: 96.20
Extended Target: 96.50
AUDJPY to continue bearishAUDJPY is likely to continue down movement.
i'm short at current market price.
calculate your own risk & reward
Good Luck


Beautiful AUD/JPY Setup – VMS Rules AlignedThis AUD/JPY trade is a perfect example of why I trust the VMS Strategy. The market gave us a clean head & shoulders with a pullback right into strong support/resistance. Volume confirmed, momentum aligned, and an engulfing candle triggered entry during my 5–11am window. I set my target at the recent swing low, and price delivered beautifully.
This was an A+ setup using the VMS Strategy. Rule-based execution with structure, volume, and momentum all aligned. Patience paid off. #VMSTrading #ForexDiscipline #AlignedExecution

AUD/JPY Approaches Monthly LowAUD/USD gives back the advance from the start of the week to approach the monthly low (94.91), and a move/close below the 95.10 (38.2% Fibonacci extension) to 95.20 (23.6% Fibonacci extension) region may lead to a test of the July low (93.97).
Next area of interest comes in around 92.80 (50% Fibonacci extension) to 93.30 (23.6% Fibonacci extension), but the decline in AUD/JPY may turn out to be temporary should it defend the rebound from the monthly low (94.91).
Need a move above the monthly high (97.07) to bring the July high (97.43) on the radar, with the next area of interest coming in around 97.90 (23.6% Fibonacci extension) to 98.30 (38.2% Fibonacci retracement).
--- Written by David Song, Senior Strategist at FOREX.com

AUDJPY: Long Trading Opportunity
AUDJPY
- Classic bullish formation
- Our team expects growth
SUGGESTED TRADE:
Swing Trade
Buy AUDJPY
Entry Level - 95.574
Sl - 95.477
Tp - 95.771
Our Risk - 1%
Start protection of your profits from lower levels
Disclosure: I am part of Trade Nation's Influencer program and receive a monthly fee for using their TradingView charts in my analysis.
❤️ Please, support our work with like & comment! ❤️

Bearish drop off 50% Fibonacci resistance?AUD/JPY has rejected off the pivot and could drop to the 1st support.
Pivot: 96.14
1st Support: 95.04
1st Resistance: 96.67
Risk Warning:
Trading Forex and CFDs carries a high level of risk to your capital and you should only trade with money you can afford to lose. Trading Forex and CFDs may not be suitable for all investors, so please ensure that you fully understand the risks involved and seek independent advice if necessary.
Disclaimer:
The above opinions given constitute general market commentary, and do not constitute the opinion or advice of IC Markets or any form of personal or investment advice.
Any opinions, news, research, analyses, prices, other information, or links to third-party sites contained on this website are provided on an "as-is" basis, are intended only to be informative, is not an advice nor a recommendation, nor research, or a record of our trading prices, or an offer of, or solicitation for a transaction in any financial instrument and thus should not be treated as such. The information provided does not involve any specific investment objectives, financial situation and needs of any specific person who may receive it. Please be aware, that past performance is not a reliable indicator of future performance and/or results. Past Performance or Forward-looking scenarios based upon the reasonable beliefs of the third-party provider are not a guarantee of future performance. Actual results may differ materially from those anticipated in forward-looking or past performance statements. IC Markets makes no representation or warranty and assumes no liability as to the accuracy or completeness of the information provided, nor any loss arising from any investment based on a recommendation, forecast or any information supplied by any third-party.

AUDJPY Intraday BuyAUDJPY – Buy Limit
Entry: 95.50
Target: 96.25
Stop Loss: 95.15
Type: Intraday
Trade Idea:
Indecisive price action has resulted in sideways congestion on the intraday chart.
Pivot support is at 95.50.
Risk/reward would be poor to call a buy from current levels, but a move through 96.00 will confirm the bullish momentum.
The measured move target is 96.50.
Preferred trade is to buy on dips.
Resistance Levels: 96.00 / 96.25 / 96.50
Support Levels: 95.50 / 95.25 / 95.15
Next Volatile Events:
No events in the next 24 hours
Disclosure: I am part of Trade Nation's Influencer program and receive a monthly fee for using their TradingView charts in my analysis.

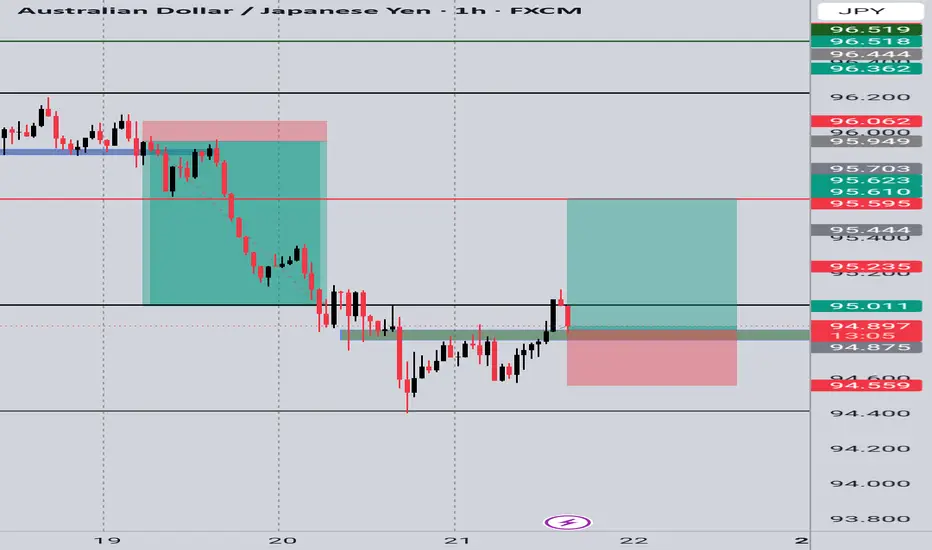
Sell idea on AudJpyPrice continues in the direction of order flow. Expecting a bullish move up to clear out buy side liquidity and then sell down towards the equal lows and potentially towards the weekly candle wick

AUDJPY – DAILY FORECAST Q3 | W34 | D19 | Y25📊 AUDJPY – DAILY FORECAST
Q3 | W34 | D19 | Y25
Daily Forecast 🔍📅
Here’s a short diagnosis of the current chart setup 🧠📈
Higher time frame order blocks have been identified — these are our patient points of interest 🎯🧭.
It’s crucial to wait for a confirmed break of structure 🧱✅ before forming a directional bias.
This keeps us disciplined and aligned with what price action is truly telling us.
📈 Risk Management Protocols
🔑 Core principles:
Max 1% risk per trade
Only execute at pre-identified levels
Use alerts, not emotion
Stick to your RR plan — minimum 1:2
🧠 You’re not paid for how many trades you take, you’re paid for how well you manage risk.
🧠 Weekly FRGNT Insight
"Trade what the market gives, not what your ego wants."
Stay mechanical. Stay focused. Let the probabilities work.
FX:AUDJPY

