AUD)USD) resistance level back down Read The ChaptianSMC Trading point update
Technical analysis for the AUD/USD pair on the 1-hour timeframe. Here's a breakdown of the idea presented:
Key Elements:
1. Resistance Level (0.65000 - 0.65200 area):
Price is approaching this strong resistance zone.
RSI is in the overbought zone (above 70), indicating potential reversal or correction.
2. Expected Price Action:
The chart suggests that price may spike into the resistance area (possibly a liquidity grab).
After hitting resistance, a drop is expected toward the FVG (Fair Value Gap) zone.
3. FVG and Target Zone (~0.64059):
There’s a highlighted Fair Value Gap that may attract price for mitigation.
Target point is near the EMA200 level and inside a previous structure zone.
This area also aligns with the RSI cooling off.
4. Support Level (~0.63600):
Marked as a stronger support area, though the current trade setup doesn't expect price to reach there soon.
5. EMA200 (blue line around 0.64202):
Acts as dynamic support.
Target is slightly below this EMA, potentially a liquidity sweep before a bounce.
Mr SMC Trading point
---
Summary of the Idea:
Bearish bias after a resistance rejection.
Look for short opportunities around the resistance zone (0.6500 area).
Target near 0.6405–0.6420 (FVG + EMA200).
Overbought RSI supports this pullback expectation.
Pelas support boost 🚀 analysis follow)
AUDUSD trade ideas

AUD/USD) Technical Analysis Read The ChaptianSMC-Trading Point update
Technical analysis of the AUD/USD currency pair on the 1-hour timeframe. Here's the idea behind the analysis:
Key Elements:
1. Support and Resistance Levels:
Resistance zone: Around 0.64350–0.64450
Support zone: Around 0.63450–0.63550
2. EMA (200):
The price is currently below the 200 EMA (0.64259), indicating bearish momentum.
3. RSI (Relative Strength Index):
RSI is around 50, indicating neutral momentum, but recently crossed down, hinting potential bearish continuation.
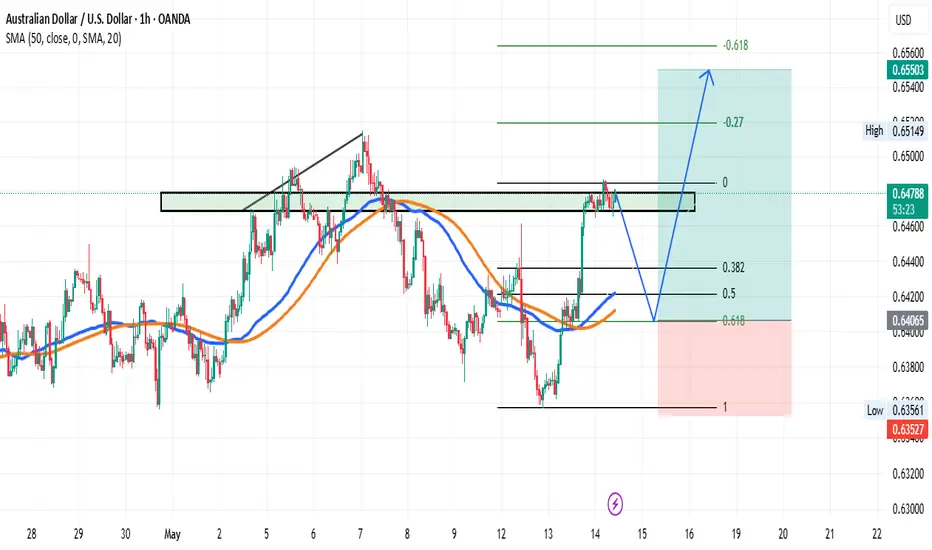
4. Two Scenarios Proposed:
Bullish Scenario:
If the price breaks above the resistance zone (~0.64400), a bullish rally toward the upper target at 0.65139 is expected.
Bearish Scenario:
If the price gets rejected from the resistance and breaks below the current support zone, a bearish move toward 0.63461 is expected.
5. Current Bias:
Slight bearish bias as the price is below both the resistance zone and the 200 EMA, with a possible setup for a breakdown.
Mr SMC Trading point
Conclusion:
This is a classic breakout or breakdown setup. The price is near a decision point, and the next move will likely depend on whether it breaks above the resistance or below the support zone.
Pales support boost 🚀 analysis follow

AUDUSD Is Very Bullish! Buy!
Take a look at our analysis for AUDUSD.
Time Frame: 30m
Current Trend: Bullish
Sentiment: Oversold (based on 7-period RSI)
Forecast: Bullish
The market is on a crucial zone of demand 0.640.
The oversold market condition in a combination with key structure gives us a relatively strong bullish signal with goal 0.641 level.
P.S
We determine oversold/overbought condition with RSI indicator.
When it drops below 30 - the market is considered to be oversold.
When it bounces above 70 - the market is considered to be overbought.
Disclosure: I am part of Trade Nation's Influencer program and receive a monthly fee for using their TradingView charts in my analysis.
Like and subscribe and comment my ideas if you enjoy them!

AUDUSD Order Block Set Up📊 AUD/USD Trade Setup Breakdown 🔍
Here’s a clean Order Block to Order Block setup on AUD/USD using multiple time frames and stacking several confluences for higher probability.
🎯 Entry Trigger:
Bullish Order Block + Key Support Zones (as marked on the chart)
These levels have held previously and align perfectly with the bullish OB for a potential long.
🧠 Strategy:
I’m planning multiple entries for partial TPs, with the final take profit set at the bearish order block on the 2H chart. The setup offers a strong Risk:Reward ratio.
🛡️ Risk Managed:
The trade is structured to be a “set and forget” with solid risk management in place. High-quality setup based on my analysis—now it’s about letting the market do its thing. 👀
Let’s see how it plays out. 📈
#AUDUSD #ForexTrading #OrderBlock #SmartMoney #FXSetup #PriceAction #RiskReward #TradingAnalysis

AUDUSD Analysis Today: Technical and Order Flow Analysis !In this video I will be sharing my AUDUSD analysis today, by providing my complete technical and order flow analysis, so you can watch it to possibly improve your forex trading skillset. The video is structured in 3 parts, first I will be performing my complete technical analysis, then I will be moving to the COT data analysis, so how the big payers in market are moving their orders, and to do this I will be using my customized proprietary software and then I will be putting together these two different types of analysis.

VIEWS ON AUD USD We are reacting from a weekly supply zone so i headed to the the 4hour time zone for confirmation which we reacted again to a 4hour supply zone which gave further confirmation for a sell signal on 30 minute forcasting the entire week for sells

AUD/USD Buy Zone – Targeting Further UpsideAUD/USD Buy Idea:
Expecting bullish momentum on AUD/USD driven by improved risk sentiment, potential RBA hawkish stance, and commodity strength. Favoring longs while above support.
AUDUSD MOVES UPTREND.....?AUDUSD market moves towards bullish according to my analysis the momentum has shown that market's momentum is going up
It shows the specific target
Target: 🎯. 0.66350
Entry point. 0.64050
Trade according to my analysis if you want to make more money then use proper money management.

AUDUSD: Bullish Move After Breakout 🇦🇺🇺🇸
AUDUSD broke and closed above a key horizontal resistance yesterday.
Retesting the broken structure, the price formed a tiny ascending
triangle pattern on an hourly time frame.
I expect a bullish continuation now.
Goal - 0.6492
❤️Please, support my work with like, thank you!❤️
I am part of Trade Nation's Influencer program and receive a monthly fee for using their TradingView charts in my analysis.

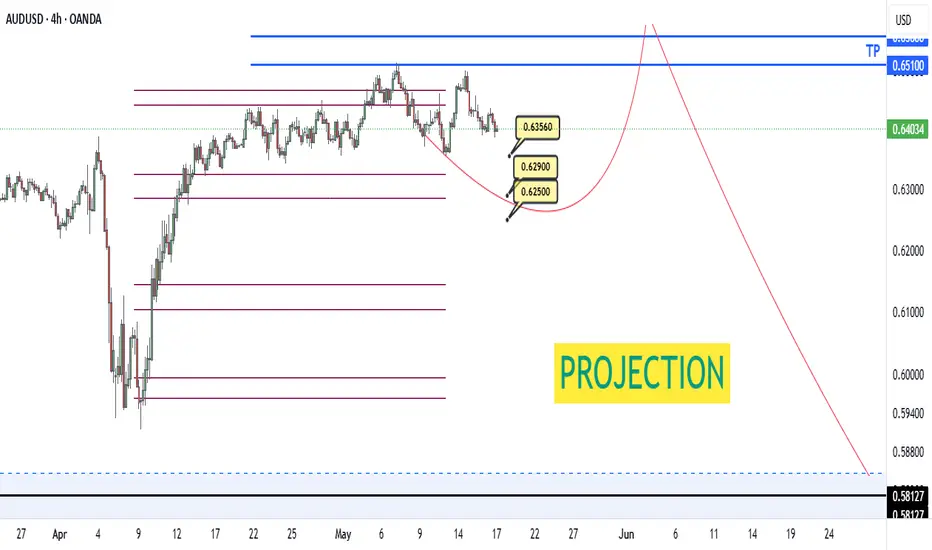
AUDUSD 4HFollowing our previous analysis, buyers failed to sustain momentum, leading to a confirmed bearish move.
The market is now progressing toward the predefined mathematical targets:
0.6356
0.6290 Main target
0.6250 potential final target
The zone around 0.6250 is a key area where we will re-evaluate the price action for a possible reversal, depending on updated market structure and data.
As always, we rely on geometric principles and calculated movement — not guesswork.
Let the market confirm the math.
AUDUSD Short on this trade AUDUSD has been moving to the downside where we saw price breaking the daily high and pushing back to the downside.
where we started to see price creating an impulsive move to the downside on the 4hour timeframe and a three touch ascending channel first touch second touch which is the middle section waiting for the last touch to complete the channel.
now we wait for price to sweep the $ hour timeframe hook point and take a short position
or wait for a push flag either 1 hour or 15min flag stop loss in place 0.40% would be better to move price to the downside.

AUDUSDThe interest rate differential between the U.S. and Australia is a key driver of the AUD/USD exchange rate, influencing capital flows, investor demand, and currency valuation. Here’s how it impacts AUD/USD:
How Interest Rate Differential Affects AUD/USD
Higher Australian Rates vs. U.S. Rates Strengthen AUD:
When the Reserve Bank of Australia (RBA) sets interest rates higher than the U.S. Federal Reserve (Fed), the yield advantage attracts global investors seeking better returns. This leads to increased demand for the Australian dollar, causing AUD/USD to rise as investors sell USD to buy AUD. This phenomenon is often called the "carry trade."
Higher U.S. Rates vs. Australian Rates Strengthen USD:
Conversely, when the Fed’s rates are higher than the RBA’s, investors shift capital into U.S. assets for better yields, boosting the USD and weakening AUD/USD. Since 2022, Fed rate hikes relative to the RBA have correlated with AUD weakness.
Capital Flows and Market Expectations:
The interest rate differential influences international capital flows. Expectations of future rate changes by either central bank, reflected in futures markets and rate trackers, can cause AUD/USD to move ahead of actual policy shifts. For example, anticipated RBA cuts or Fed hikes typically weaken the AUD/USD.
Trade and Economic Context:
The impact of interest rate differentials is moderated by other factors such as commodity prices (Australia’s major exports), trade relations, and global risk sentiment. For instance, U.S. tariffs on China and other countries indirectly pressure the AUD by affecting Australia’s trade environment.
Summary
Scenario AUD/USD Impact Explanation
RBA rates higher than Fed rates AUD/USD rises Higher Australian yields attract capital
Fed rates higher than RBA rates AUD/USD falls Higher U.S. yields attract capital
Market expects RBA cuts AUD/USD falls Anticipated lower yields reduce AUD appeal
Market expects Fed hikes AUD/USD falls Anticipated higher yields boost USD
In essence:
The interest rate differential between Australia and the U.S. is a fundamental determinant of AUD/USD movements. A wider gap favoring the U.S. dollar tends to weaken the AUD/USD pair, while a narrowing or reversal in this gap can support AUD gains. Traders closely should monitor central bank policies, inflation data, and rate expectations to anticipate shifts in this differential and its effect on the currency pair.

Potential bearish drop?AUD/USD is reacting off the resistance level which is an overlap resistance that lines up with the 38.2% Fibonacci retracement and could drop from this level to our take profit.
Entry: 0.6431
Why we like it:
There is an overlap resistance that lines up with the 38.2% Fibonacci retracement.
Stop loss: 0.6349
Why we like it:
There is a pullback support level.
Take profit: 0.6349
Why we like it:
There is a pullback support level.
Enjoying your TradingView experience? Review us!
Please be advised that the information presented on TradingView is provided to Vantage (‘Vantage Global Limited’, ‘we’) by a third-party provider (‘Everest Fortune Group’). Please be reminded that you are solely responsible for the trading decisions on your account. There is a very high degree of risk involved in trading. Any information and/or content is intended entirely for research, educational and informational purposes only and does not constitute investment or consultation advice or investment strategy. The information is not tailored to the investment needs of any specific person and therefore does not involve a consideration of any of the investment objectives, financial situation or needs of any viewer that may receive it. Kindly also note that past performance is not a reliable indicator of future results. Actual results may differ materially from those anticipated in forward-looking or past performance statements. We assume no liability as to the accuracy or completeness of any of the information and/or content provided herein and the Company cannot be held responsible for any omission, mistake nor for any loss or damage including without limitation to any loss of profit which may arise from reliance on any information supplied by Everest Fortune Group.

Bullish momentum to extend?The Aussie (AUD/USD) is falling towards the pivot, which has been identified as a pullback support and could bounce to the 1st resistance, which aligns with the 145% Fibonacci extension.
Pivot: 0.6445
1st Support: 0.6408z
1st Resistance: 0.6514
Risk Warning:
Trading Forex and CFDs carries a high level of risk to your capital and you should only trade with money you can afford to lose. Trading Forex and CFDs may not be suitable for all investors, so please ensure that you fully understand the risks involved and seek independent advice if necessary.
Disclaimer:
The above opinions given constitute general market commentary, and do not constitute the opinion or advice of IC Markets or any form of personal or investment advice.
Any opinions, news, research, analyses, prices, other information, or links to third-party sites contained on this website are provided on an "as-is" basis, are intended only to be informative, is not an advice nor a recommendation, nor research, or a record of our trading prices, or an offer of, or solicitation for a transaction in any financial instrument and thus should not be treated as such. The information provided does not involve any specific investment objectives, financial situation and needs of any specific person who may receive it. Please be aware, that past performance is not a reliable indicator of future performance and/or results. Past Performance or Forward-looking scenarios based upon the reasonable beliefs of the third-party provider are not a guarantee of future performance. Actual results may differ materially from those anticipated in forward-looking or past performance statements. IC Markets makes no representation or warranty and assumes no liability as to the accuracy or completeness of the information provided, nor any loss arising from any investment based on a recommendation, forecast or any information supplied by any third-party.

Long-Term Buy On The AussieThe most straightforward interpretation is that the down move that started back in February 2021 (red rectangle) was a correction of the previous rally (green rectangle) and ended at 0.5914. If this is correct, then we are in the early stages of a large upward move on the Aussie in the long-term that should reach at least the previous highs of 2021. This view will be in jeopardy if we break back below the previously mentioned support and will be completely negated on a break of the 2020 lows at 0.5510.

Bullish bounce for the Aussi?The price is falling towards the pivot and could bounce to the 1st, pullback resistance.
Pivot: 0.6352
1st Support: 0.6292
1st Resistance: 0.6502
Risk Warning:
Trading Forex and CFDs carries a high level of risk to your capital and you should only trade with money you can afford to lose. Trading Forex and CFDs may not be suitable for all investors, so please ensure that you fully understand the risks involved and seek independent advice if necessary.
Disclaimer:
The above opinions given constitute general market commentary, and do not constitute the opinion or advice of IC Markets or any form of personal or investment advice.
Any opinions, news, research, analyses, prices, other information, or links to third-party sites contained on this website are provided on an "as-is" basis, are intended only to be informative, is not an advice nor a recommendation, nor research, or a record of our trading prices, or an offer of, or solicitation for a transaction in any financial instrument and thus should not be treated as such. The information provided does not involve any specific investment objectives, financial situation and needs of any specific person who may receive it. Please be aware, that past performance is not a reliable indicator of future performance and/or results. Past Performance or Forward-looking scenarios based upon the reasonable beliefs of the third-party provider are not a guarantee of future performance. Actual results may differ materially from those anticipated in forward-looking or past performance statements. IC Markets makes no representation or warranty and assumes no liability as to the accuracy or completeness of the information provided, nor any loss arising from any investment based on a recommendation, forecast or any information supplied by any third-party.

Bearish drop off pullback resistance?The Aussie (AUD/USD) is rising towards the pivot, which aligns with the 50% Fibonacci retracement, and could reverse to the 1st support.
Pivot: 0.6460
1st Support: 0.6399
1st Resistance: 0.6491
Risk Warning:
Trading Forex and CFDs carries a high level of risk to your capital and you should only trade with money you can afford to lose. Trading Forex and CFDs may not be suitable for all investors, so please ensure that you fully understand the risks involved and seek independent advice if necessary.
Disclaimer:
The above opinions given constitute general market commentary, and do not constitute the opinion or advice of IC Markets or any form of personal or investment advice.
Any opinions, news, research, analyses, prices, other information, or links to third-party sites contained on this website are provided on an "as-is" basis, are intended only to be informative, is not an advice nor a recommendation, nor research, or a record of our trading prices, or an offer of, or solicitation for a transaction in any financial instrument and thus should not be treated as such. The information provided does not involve any specific investment objectives, financial situation and needs of any specific person who may receive it. Please be aware, that past performance is not a reliable indicator of future performance and/or results. Past Performance or Forward-looking scenarios based upon the reasonable beliefs of the third-party provider are not a guarantee of future performance. Actual results may differ materially from those anticipated in forward-looking or past performance statements. IC Markets makes no representation or warranty and assumes no liability as to the accuracy or completeness of the information provided, nor any loss arising from any investment based on a recommendation, forecast or any information supplied by any third-party.

Could the Aussie bounce from here?The price is falling towards the support level which is a pullback support that lines up with the 71% Fibonacci retracement and the 78.6% Fibonacci projection and could bounce from this level to our take profit.
Entry: 0.6386
Why we like it:
There is a pullback support level that lines up with the 71% Fibonacci retracement and the 78.6% Fibonacci projection.
Stop loss: 0.6356
Why we like it:
There is a pullback support level.
Take profit: 0.6436
Why we like it:
There is a pullback resistance level.
Enjoying your TradingView experience? Review us!
Please be advised that the information presented on TradingView is provided to Vantage (‘Vantage Global Limited’, ‘we’) by a third-party provider (‘Everest Fortune Group’). Please be reminded that you are solely responsible for the trading decisions on your account. There is a very high degree of risk involved in trading. Any information and/or content is intended entirely for research, educational and informational purposes only and does not constitute investment or consultation advice or investment strategy. The information is not tailored to the investment needs of any specific person and therefore does not involve a consideration of any of the investment objectives, financial situation or needs of any viewer that may receive it. Kindly also note that past performance is not a reliable indicator of future results. Actual results may differ materially from those anticipated in forward-looking or past performance statements. We assume no liability as to the accuracy or completeness of any of the information and/or content provided herein and the Company cannot be held responsible for any omission, mistake nor for any loss or damage including without limitation to any loss of profit which may arise from reliance on any information supplied by Everest Fortune Group.

CHECK AUDUSD SIGNAL READ CAPTAIN audusd signal technical analysis satup 👇🏼
(audusd) buy zone
( TRADE SATUP)
ENTRY POINT (0.64050) to (0.64000) 📊
FIRST TP (0.64250)📊
2ND TARGET (0.64450) 📊
LAST TARGET (0.64650) 📊
STOP LOOS (0.63800)❌
FALLOW RISK MANAGMENT

AUD/USD BEARS WILL DOMINATE THE MARKET|SHORT
Hello, Friends!
It makes sense for us to go short on AUD/USD right now from the resistance line above with the target of 0.638 because of the confluence of the two strong factors which are the general downtrend on the previous 1W candle and the overbought situation on the lower TF determined by it’s proximity to the upper BB band.
Disclosure: I am part of Trade Nation's Influencer program and receive a monthly fee for using their TradingView charts in my analysis.
✅LIKE AND COMMENT MY IDEAS✅

AUDUSD Massive Short! SELL!
My dear friends,
My technical analysis for AUDUSD is below:
The market is trading on 0.6454 pivot level.
Bias - Bearish
Technical Indicators: Both Super Trend & Pivot HL indicate a highly probable Bearish continuation.
Target - 0.6420
About Used Indicators:
A pivot point is a technical analysis indicator, or calculations, used to determine the overall trend of the market over different time frames.
Disclosure: I am part of Trade Nation's Influencer program and receive a monthly fee for using their TradingView charts in my analysis.
———————————
WISH YOU ALL LUCK

Bullish bounce for the Aussie?The price has bounced off the support level which is a pullback support and could rise from this level to our take profit.
Entry: 0.6386
Why we like it:
There is a pullback support level.
Stop loss: 0.6356
Why we like it:
There is a pullback support level that aligns with the 161.8% Fibonacci extension.
Take profit: 0.6436
Why we like it:
There is a pullback resistance level that is slightly above the 38.2% Fibonacci retracement.
Enjoying your TradingView experience? Review us!
Please be advised that the information presented on TradingView is provided to Vantage (‘Vantage Global Limited’, ‘we’) by a third-party provider (‘Everest Fortune Group’). Please be reminded that you are solely responsible for the trading decisions on your account. There is a very high degree of risk involved in trading. Any information and/or content is intended entirely for research, educational and informational purposes only and does not constitute investment or consultation advice or investment strategy. The information is not tailored to the investment needs of any specific person and therefore does not involve a consideration of any of the investment objectives, financial situation or needs of any viewer that may receive it. Kindly also note that past performance is not a reliable indicator of future results. Actual results may differ materially from those anticipated in forward-looking or past performance statements. We assume no liability as to the accuracy or completeness of any of the information and/or content provided herein and the Company cannot be held responsible for any omission, mistake nor for any loss or damage including without limitation to any loss of profit which may arise from reliance on any information supplied by Everest Fortune Group.

So much SUCCESS going down the Swing; BEARISH APPETITE!Can you the reader give us a prayer, brief one please as we salivate on this AUDUSD course meal. Call the Doc, obesity on the way, been eating way too many Pips with cream.
Bearish trend has been so graceful after all with well trimmed entries (except one which almost gave me a heart attack, just kidding).
As usual, we've conditioned ourselves to wait for the right moment to catch the sardines in the net, we should be seeing some major retracements pretty soon but positioning yourself requires PATIENCE and FOCUS.
We wait!
