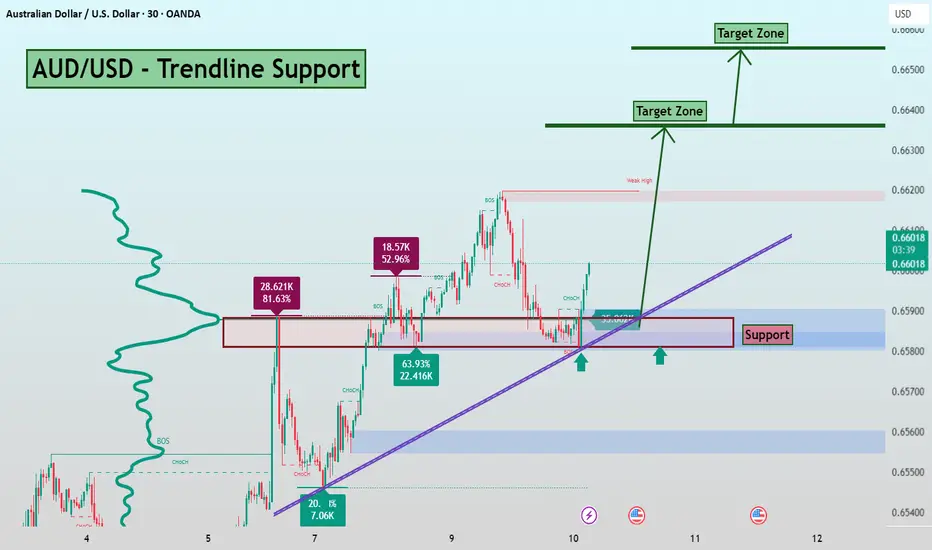
AUD/USD - Bullish Channel (10.09.2025) The AUD/USD pair on the M30 timeframe presents a Potential Buying Opportunity due to a recent Formation of a Bullish Channel Pattern.
This suggests a shift in momentum towards the upside and a higher likelihood of further advances in the coming hours.
Possible Long Trade:
Entry: Consider Entering A Long Position around Trendline Of The Pattern.
Target Levels:
1st Resistance – 0.6636
2nd Resistance – 0.6658
🎁 Please hit the like button and
🎁 Leave a comment to support for My Post !
Your likes and comments are incredibly motivating and will encourage me to share more analysis with you.
Best Regards, KABHI_TA_TRADING
Thank you.
Disclosure: I am part of Trade Nation's Influencer program and receive a monthly fee for using their TradingView charts in my analysis.
AUDUSD trade ideas

Lingrid | AUDUSD Bullish Continuation Potential The price perfectly fulfilled my previous idea . OANDA:AUDUSD is consolidating inside an upward channel after rejecting resistance near 0.6600. The structure shows a corrective pullback into the 0.6515–0.6520 zone while holding above the rising support trendline. If buyers defend this zone, price could extend back toward 0.6560. Momentum remains bullish as long as the higher-low structure is respected.
📉 Key Levels
Buy trigger: Rebound from 0.6520 support
Buy zone: 0.6515–0.6520
Target: 0.6560
Invalidation: Break below 0.6482
💡 Risks
A breakdown below 0.6482 would signal bearish reversal against the channel.
USD macro data surprises may trigger volatility against the bias.
Global risk sentiment shifts could weaken AUD momentum.
If this idea resonates with you or you have your own opinion, traders, hit the comments. I’m excited to read your thoughts!

Lingrid | AUDUSD Major Resistance Short - Monthly LevelThe price perfectly fulfilled my previous idea . FX:AUDUSD has rallied strongly from the double-bottom formation near 0.6460 and is now testing the resistance zone around 0.6627. The market structure shows bullish momentum fueled by a breakout from the triangle pattern, lifting price toward prior highs. Price action is stalling at the upper boundary, where sellers may look to fade the move, opening potential retracement back toward 0.6550. If buyers defend that zone, another attempt at resistance could follow, but failure there may shift momentum in favor of sellers. The broader setup suggests a battle between trend continuation and near-term exhaustion.
💡 Risks:
A stronger-than-expected US PPI could boost the dollar and push AUDUSD lower.
A dovish RBA stance or weak Australian economic data may undercut recent bullish momentum.
Global risk sentiment shifts, particularly weakness in equities or commodities, could weigh on AUD demand.
If this idea resonates with you or you have your own opinion, traders, hit the comments. I’m excited to read your thoughts!

AUD/USD – Upward Channel Weakness | Possible Reversal SetupAUD/USD has been moving inside a clear upward channel on the 2H timeframe. Multiple Breaks of Structure (BOS) and Change of Character (CHoCH) patterns confirm short-term bullish momentum.
Currently, price is testing the upper boundary of the channel, where rejection signs are visible. If the structure holds, we may see a short-term pullback toward the lower channel support and demand zones around 0.6560 – 0.6480.
Structure: Upward channel in play
BOS + CHoCH confirm shifts in momentum
Watch for bearish rejection near resistance
First support: 0.6560 | Second support: 0.6480
This analysis is for educational purposes only and not financial advice. Always manage your risk before entering any trade.

AUDUSD Potential UpsidesHey Traders, in today's trading session we are monitoring AUDUSD for a buying opportunity around 0.65900 zone, AUDUSD is trading in an uptrend and currently is in a correction phase in which it is approaching the trend at 0.65900 support and resistance area.
Trade safe, Joe.

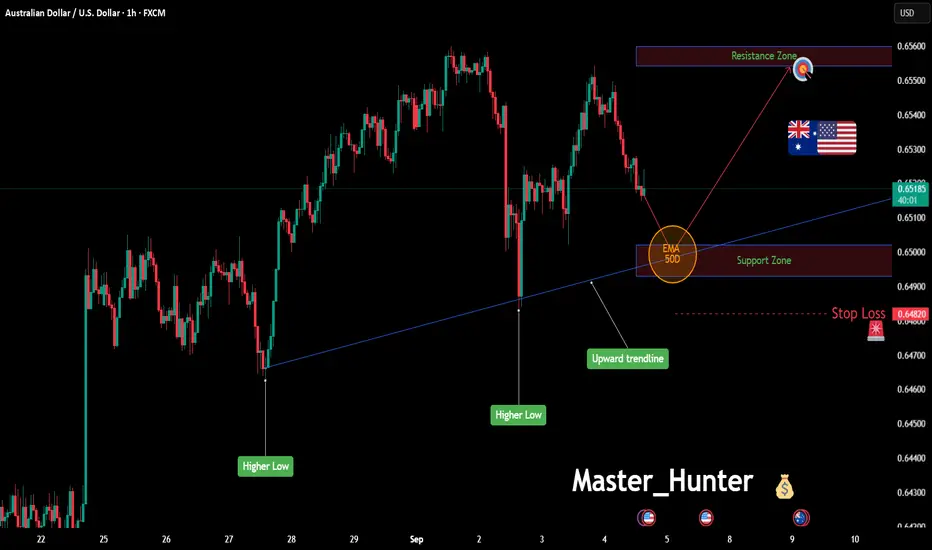
AUD/USD - (Upcoming PPI & CPI makes USD Weak)Buy AUD/USD - Trendline support makes bullish movement
Expecting strong movement in upcoming PPI & CPI data for US.. USD Weak in upcoming days.
Thank you. Support buy Likes and Comments
AUD/USD Ready for a Short Squeeze? COT Divergence Signals1. Retail Sentiment
73% of retail traders are short versus 27% long. Such an unbalanced positioning usually suggests short squeeze potential, as the market often moves against retail flows, especially when technical levels confirm the bias.
2. COT Report
USD Index: Non-Commercials remain skewed to the short side (+18.6k short vs. +13.6k long), with a slight reduction. This indicates the dollar is losing part of its net strength.
AUD Futures: Non-Commercials are heavily short (112k vs. 29k long), adding –16,930 new shorts. However, Commercials (hedgers) increased their longs (+11,908). Historically, commercials are more accurate at market turning points. This divergence may point to a bottom forming in AUD.
3. Seasonality (September)
September has historically been neutral to slightly negative for AUD/USD: flat performance over 20 years, and weaker over the last 5 years. However, mid-to-late September seasonality stabilizes, setting the stage for an October recovery. Bearish pressure may start fading, leaving room for upside.
4. Technical Outlook
Demand Zone: 0.6450–0.6500 has repeatedly rejected price, confirming strong support.
Supply Zone: 0.6650–0.6700, recently tested, represents the first upside target.
Structure: Price is printing higher lows and showing signs of a potential bullish structure shift. RSI is neutral, with no overbought signals.
Possible Scenario: A short pullback into 0.6520–0.6540 before accelerating toward 0.6680–0.6700.
5. Trading Summary
Bias: Moderately bullish in the short-to-medium term.
Key Drivers:
Extreme retail short positioning → potential squeeze.
COT divergence (specs heavily short, commercials long) → possible bottom.
Weak but improving seasonality.
Technical structure favoring upside continuation.
👉 Bottom line: AUD/USD favors long setups, but heavy Non-Commercial short exposure implies volatility could remain elevated.

AUDUSD Given the current range-bound movement, a trader could capitalize by exploiting the price oscillations within this zone. Enter long positions near the lower boundary of the range around 0.6415 to 0.6388 and consider short positions as price approaches the upper boundary around 0.6625. A tight stop-loss just outside the entry levels can help mitigate risk, aiming for a favorable risk-reward ratio. Monitor for a breakout to adjust strategies accordingly, as breakouts could signify the beginning of a new trend.

08-09-2025 AUDUSDAs shown in the figure: 4H Bearish Gartley
The market is not always chaotic and disorderly, and there is a precise geometric beauty hidden in price fluctuations. The harmonic form long strategy is a powerful tool for accurately identifying potential market reversal points based on the Fibonacci ratio. When the form forms perfectly at the key support level, it often indicates the depletion of bearish momentum and the initiation of bullish trends.

AUD/USD Rally Attempts, Will Buyers Stay in Charge?Market Analysis: AUD/USD Rally Attempts, Will Buyers Stay in Charge?
AUD/USD started a decent increase above 0.6580.
Important Takeaways for AUD USD Analysis Today
- The Aussie Dollar started a decent increase above 0.6545 against the US Dollar.
- There was a break above a contracting triangle with resistance at 0.6530 on the hourly chart of AUD/USD.
AUD/USD Technical Analysis
On the hourly chart of AUD/USD at FXOpen, the pair started a fresh increase from 0.6500. The Aussie Dollar was able to clear 0.6520 to move into a positive zone against the US Dollar.
The bulls cleared a contracting triangle with resistance at 0.6530. There was a close above the 0.6550 resistance and the 50-hour simple moving average. Finally, the pair tested 0.6585. A high was formed near 0.6588 and the pair recently started a consolidation phase.
There was a move below the 23.6% Fib retracement level of the upward move from the 0.6501 swing low to the 0.6588 high. On the upside, the AUD/USD chart indicates that the pair is now facing resistance near 0.6585.
An upside break above 0.6585 might send the pair further higher. The next stop is near 0.6640. Any more gains could clear the path for a move toward the 0.6700 handle.
On the downside, initial support is near the 50% Fib retracement at 0.6545. The next area of interest could be near the 50-hour simple moving average at 0.6535.
If there is a downside break below 0.6535, the pair could extend its decline toward the 0.6500 zone. Any more losses might signal a move toward 0.6485.
This article represents the opinion of the Companies operating under the FXOpen brand only. It is not to be construed as an offer, solicitation, or recommendation with respect to products and services provided by the Companies operating under the FXOpen brand, nor is it to be considered financial advice.

AUDUSD Will Go Down From Resistance! Short!
Take a look at our analysis for AUDUSD.
Time Frame: 1h
Current Trend: Bearish
Sentiment: Overbought (based on 7-period RSI)
Forecast: Bearish
The market is approaching a key horizontal level 0.660.
Considering the today's price action, probabilities will be high to see a movement to 0.658.
P.S
The term oversold refers to a condition where an asset has traded lower in price and has the potential for a price bounce.
Overbought refers to market scenarios where the instrument is traded considerably higher than its fair value. Overvaluation is caused by market sentiments when there is positive news.
Disclosure: I am part of Trade Nation's Influencer program and receive a monthly fee for using their TradingView charts in my analysis.
Like and subscribe and comment my ideas if you enjoy them!

$AUDUSD Buyers are regrouping about to push the pair to the .664The buyers are on the move, about to push the pair higher. Supported by stronger commodities and a softer U.S. dollar, the pair created a new support area around .06565. Any pullback to this area will confirm further buying, pushing the pair to the .6640 area, then back down to the new support area.

AUDUSD InsightHello to all subscribers, glad to have you here.
Please share your personal opinions in the comments. Don’t forget to boost and subscribe.
Key Points
- On the 10th, a large-scale “National Paralysis” movement broke out across France in protest against the government’s emergency fiscal policies.
- In Poland, reports came out that 3–4 Russian drones intruding into its airspace were shot down, and the EU has begun discussions on strengthening air defense systems in response.
- According to the U.S. Department of Labor, the Producer Price Index (PPI) for August was -0.1%, far below the forecast of 0.3%, and on a yearly basis it rose 2.6%, well under the expected 3.3%. This decline was due to wholesale and retail trade margins plunging 1.7% month-over-month, suggesting that companies refrained from excessive price hikes despite U.S. tariff policies.
Major Economic Events This Week
+ September 11: ECB interest rate decision, U.S. August CPI
+ September 12: U.K. July GDP, Germany August CPI
AUDUSD Chart Analysis
There is another attempt to break through the 0.66000 level, which has acted as resistance multiple times. If this resistance zone is breached, conditions may align for a medium- to long-term rise toward the 0.69000 level. However, if the pair fails to break through this resistance, the 0.65000 support line is expected to collapse, with a possible retreat as far as the 0.62000 level.


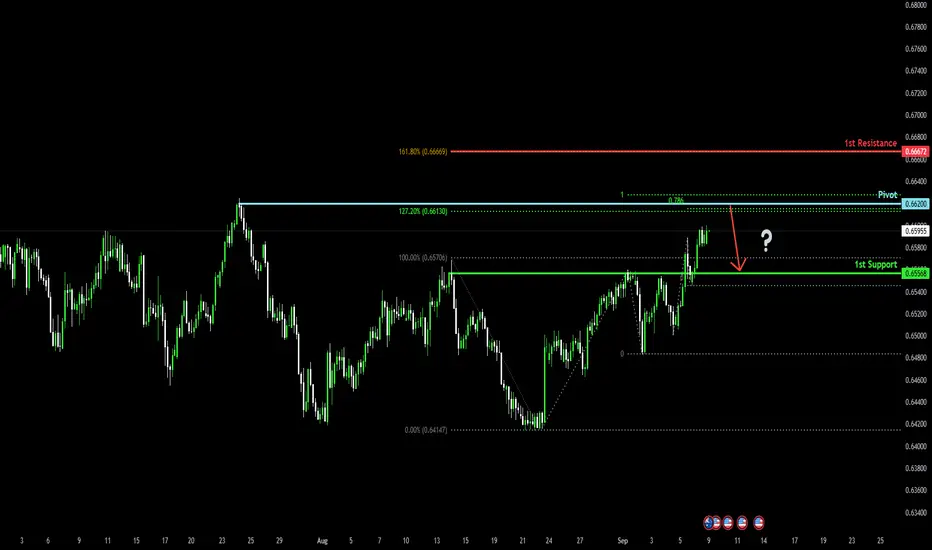
Approaching Fibonacci confluence level?The Aussie (AUD/USD) is rising towards the pivot, which acts as a swing high resistance and could reverse to the overlap support.
Pivot: 0.6620
1st Support: 0.6556
1st Resistance: 0.6667
Disclaimer:
The above opinions given constitute general market commentary and do not constitute the opinion or advice of IC Markets or any form of personal or investment advice.
Any opinions, news, research, analyses, prices, other information, or links to third-party sites contained on this website are provided on an "as-is" basis, are intended only to be informative, is not an advice nor a recommendation, nor research, or a record of our trading prices, or an offer of, or solicitation for a transaction in any financial instrument and thus should not be treated as such. The information provided does not involve any specific investment objectives, financial situation and needs of any specific person who may receive it. Please be aware, that past performance is not a reliable indicator of future performance and/or results. Past Performance or Forward-looking scenarios based upon the reasonable beliefs of the third-party provider are not a guarantee of future performance. Actual results may differ materially from those anticipated in forward-looking or past performance statements. IC Markets makes no representation or warranty and assumes no liability as to the accuracy or completeness of the information provided, nor any loss arising from any investment based on a recommendation, forecast or any information supplied by any third-party.
Sharp Rejection+Fair Value Gap = Strong AUD/USD Support (0.6493)On AUD/USD, a sharp rejection of lower prices has formed a significant support at 0.6493. The Volume Profile shows a clear volume cluster inside the rejection, where buyers became active and turned the sell-off around.The plan is to wait for a pullback to 0.6493 and look for a long entry from there.

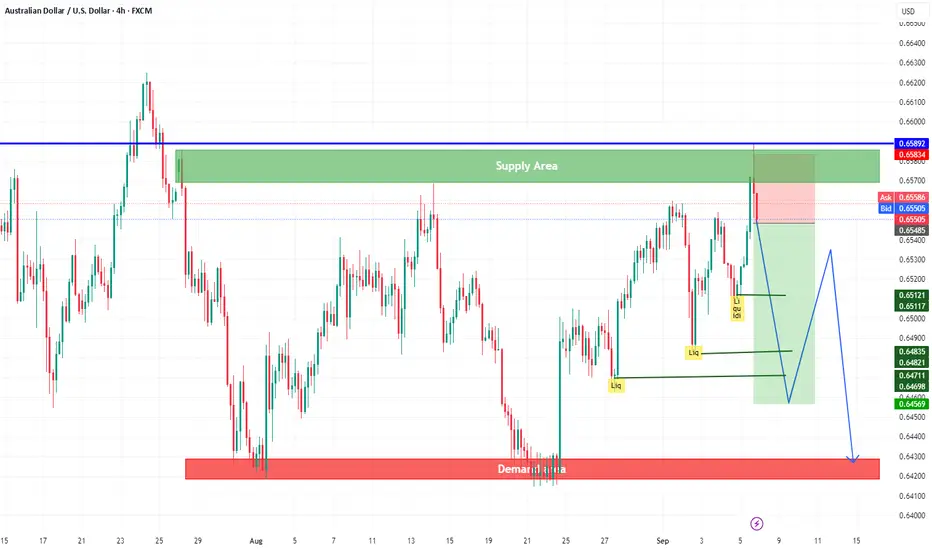
AUDUSD bearishWe have 3 liquidity areas, not sweep, and the price rebounds from the supply area to continue bearish and sweep the liquidity.
AUDUSD H4 | Reversal signal at swing high resistanceThe Aussie (AUD/USD) is rising towards the sell entry, which acts as a swing high resistance that aligns with the 78.6% Fibonacci projection and could reverse from this level to the downside.
Sell entry is at 0.6620, which is a swing high resistance that lines up with the 78.6% Fibonacci projection.
Stop loss is at 0.6638, a resistance that aligns with the 100% Fibonacci projection.
Take profit is at 0.6558, which is a pullback support.
High Risk Investment Warning
Trading Forex/CFDs on margin carries a high level of risk and may not be suitable for all investors. Leverage can work against you.
Stratos Markets Limited (tradu.com ):
CFDs are complex instruments and come with a high risk of losing money rapidly due to leverage. 65% of retail investor accounts lose money when trading CFDs with this provider. You should consider whether you understand how CFDs work and whether you can afford to take the high risk of losing your money.
Stratos Europe Ltd (tradu.com ):
CFDs are complex instruments and come with a high risk of losing money rapidly due to leverage. 66% of retail investor accounts lose money when trading CFDs with this provider. You should consider whether you understand how CFDs work and whether you can afford to take the high risk of losing your money.
Stratos Global LLC (tradu.com ):
Losses can exceed deposits.
Please be advised that the information presented on TradingView is provided to Tradu (‘Company’, ‘we’) by a third-party provider (‘TFA Global Pte Ltd’). Please be reminded that you are solely responsible for the trading decisions on your account. There is a very high degree of risk involved in trading. Any information and/or content is intended entirely for research, educational and informational purposes only and does not constitute investment or consultation advice or investment strategy. The information is not tailored to the investment needs of any specific person and therefore does not involve a consideration of any of the investment objectives, financial situation or needs of any viewer that may receive it. Kindly also note that past performance is not a reliable indicator of future results. Actual results may differ materially from those anticipated in forward-looking or past performance statements. We assume no liability as to the accuracy or completeness of any of the information and/or content provided herein and the Company cannot be held responsible for any omission, mistake nor for any loss or damage including without limitation to any loss of profit which may arise from reliance on any information supplied by TFA Global Pte Ltd.
The speaker(s) is neither an employee, agent nor representative of Tradu and is therefore acting independently. The opinions given are their own, constitute general market commentary, and do not constitute the opinion or advice of Tradu or any form of personal or investment advice. Tradu neither endorses nor guarantees offerings of third-party speakers, nor is Tradu responsible for the content, veracity or opinions of third-party speakers, presenters or participants.

AUDUSD – Testing Key ResistanceAUDUSD has extended its recovery from the 0.6420 channel base and is now testing a significant resistance band at 0.6660. The breakout from the channel has underpinned a constructive near-term bias, but price action is showing signs of fatigue as it approaches prior supply.
We see limited risk-reward in chasing longs at current levels. A rejection from resistance would open scope for a corrective pullback toward 0.6450. Conversely, a sustained defense of that zone would provide the platform for another test of 0.6660. A clear break above would re-establish upside momentum, whereas repeated failure would likely tilt near-term flows back toward sellers.
Overall, AUDUSD sits at an inflection point, with positioning now sensitive to headline risk and broader USD dynamics.

AUD/USD: Bullish Push to 0.65543?As the previous analysis worked exactly as predicted, FX:AUDUSD is setting up for a bullish move on the 1-hour chart , with an entry zone between 0.64930-0.65020 near a key support level.
The target at 0.65543 aligns with the next resistance, offering a solid upside play. Set a stop loss on a close below 0.6482 to manage risk effectively. 🌟
Watch economic data! 💡
📝 Trade Plan:
✅ Entry Zone: 0.64930 – 0.65020 (support area)
❌ Stop Loss: Daily close below 0.6482 to manage risk
🎯 Target: 0.65543 (next resistance)
Ready for this move? Drop your take below! 👇
AUD/USD Ascending Triangle Breakout – Bulls Eyeing 0.6600AUD/USD is forming an Ascending Triangle on the 4H chart, showing bullish pressure building after multiple Change of Character (CHoCH) and Break of Structure (BOS) confirmations.
Support Level: 0.6400
Support Zone: 0.6450 – 0.6470
Resistance Area: 0.6600
Currently, price has broken above the descending trendline, suggesting bullish continuation if momentum holds. A retest of the breakout zone could provide a potential long opportunity, with targets toward the 0.6600 resistance area.
Breakout from Ascending Triangle
Higher highs with strong demand at support
Bullish continuation expected if price holds above 0.6500
This is not financial advice. Always manage risk and use proper risk-reward ratios before entering trades.

AUD/USD there is still potential for AUD weakening...According to my indicators and filters that I use in my strategy, everything points to SHORT MOVEMENT !
- real volume
- divergence on RSI
- Order Blocks
- Area Of Interest
- price action

AUDUSD Daily Forecast Q3 | W37 | D8 | Y25📊 AUDUSD Daily Forecast Q3 | W37 | D8 | Y25
🔍 Analysis Approach:
I’m applying Smart Money Concepts, focusing on:
Identifying Points of Interest on the Higher Time Frames (HTFs) 🕰️
Using those POIs to define a clear trading range 📐
Refining those zones on Lower Time Frames (LTFs) 🔎
Waiting for a Break of Structure (BoS) for confirmation ✅
This method allows me to stay precise, disciplined, and aligned with the market narrative, rather than chasing price.
💡 My Motto:
"Capital management, discipline, and consistency in your trading edge."
A positive risk-to-reward ratio, paired with a high win rate, is the backbone of any solid trading plan 📈🔐
⚠️ Losses?
They’re part of the mathematical game of trading 🎲
They don’t define you — they’re necessary, they happen, and we move forward 📊➡️
🙏 I appreciate you taking the time to review my Daily Forecast.
Stay sharp, stay consistent, and protect your capital
— FRNGT 🚀
