AUDUSD FRGNT Daily Forecast -Q4 | W48| D25 | Y25 |📅 Q4 | W48| D25 | Y25 |
📊 AUDUSD FRGNT Daily Forecast
🔍 Analysis Approach:
I’m applying Smart Money Concepts, focusing on:
Identifying Points of Interest on the Higher Time Frames (HTFs) 🕰️
Using those POIs to define a clear trading range 📐
Refining those zones on Lower Time Frames (LTFs) 🔎
Waiting for a Break of Structure (BoS) for confirmation ✅
This method allows me to stay precise, disciplined, and aligned with the market narrative, rather than chasing price.
💡 My Motto:
"Capital management, discipline, and consistency in your trading edge."
A positive risk-to-reward ratio, paired with a high win rate, is the backbone of any solid trading plan 📈🔐
⚠️ Losses?
They’re part of the mathematical game of trading 🎲
They don’t define you — they’re necessary, they happen, and we move forward 📊➡️
🙏 I appreciate you taking the time to review my Daily Forecast.
Stay sharp, stay consistent, and protect your capital
— FRNGT 🚀
FX:AUDUSD
Australian Dollar / U.S. Dollar
No trades
Market insights

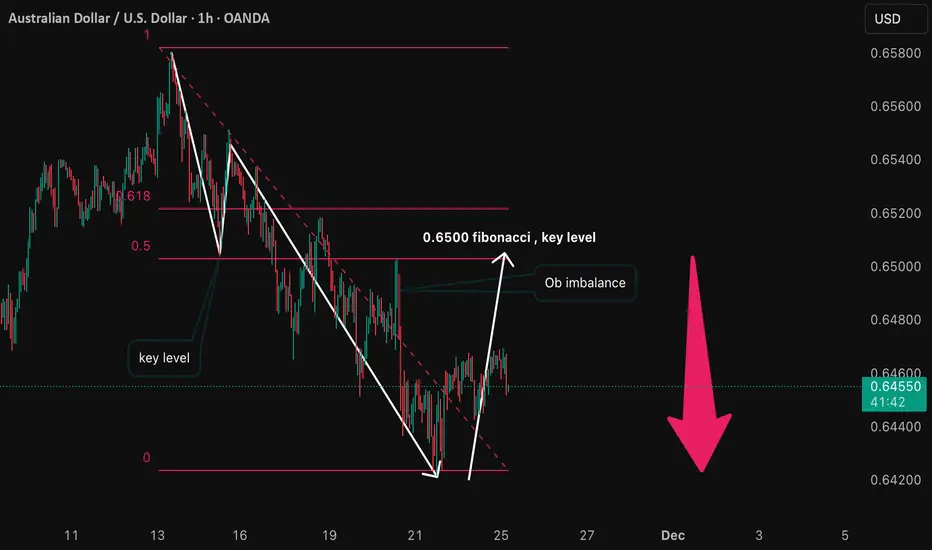
AUDUSD Wave Analysis – 25 November 2025
- AUDUSD reversed from support area
- Likely to rise to resistance level 0.6500
AUDUSD currency pair recently reversed from support area between the key support level 0.6420 (which has been reversing the price from May) and the lower daily Bollinger Band.
This support area was further strengthened by the 38.2% Fibonacci correction of the previous sharp upward ABC correction B from April.
Given the clear daily uptrend, AUDUSD currency pair can be expected to rise to the next resistance level 0.6500.

AUD/USD Rises from Multi-Month LowsAUD/USD is trading near 0.6465 this Tuesday as the Australian Dollar comes under pressure amid heightened geopolitical tensions in the Asia-Pacific. The Aussie dipped briefly below 0.6450 earlier in the week after comments from Japan’s top diplomatic official suggesting a strong response to a Chinese move over Taiwan triggered a sharp risk-off tone in Asian markets. That risk-off shift ended the modest rebound in the Aussie following last week’s positive PMI prints.
Looking ahead, the key drag on the pair is the lack of follow-through on Australia’s improved manufacturing and services data, while the greenback remains supported even as Fed rate-cut expectations face re-assessment. Unless risk sentiment recovers or Australia delivers a fresh positive surprise, AUD/USD is more likely to drift lower than break higher in the near term.
In the above chart, AUD/USD rates remain in the multi-month range that’s defined price action for the better part of the past seven months; the recent rebound finds the pair moving off of intermediate lows carved out in July and August. Momentum has a slightly bearish tilt, insofar as MACD continues to trend deeper beneath its signal line as each of the 20-day, 50-day, and 100-day exponential moving averages (EMA) sustain a negative slope.

AUDUSD — CLS Daily vs 1H Chart AUDUSD — Daily vs 1H Chart 📈
Price has purged into a key level on both the Weekly and Daily timeframes, then formed a CLS range on the Daily chart.
Once price pulls back into the Daily Gap on the 1H, I’ll look to go long toward the Daily 50% level.
🎯 Target → 0.64695
OANDA:AUDUSD

AUDUSD bullish ideaThe price is near the weekly low and I think the probability is high that it will reverse.

AUD/USD 2-hour chart Pattern.....AUD/USD 2-hour chart open, with trend lines, Ichimoku cloud, and two “Target Point” markers drawn. From what’s visible:
1. First Target: Around 0.6518 (marked on the chart as the lower target line).
2. Second Target: Around 0.6575 (the higher target line).
These targets appear to be based on a breakout from the descending trendline, with projected upward moves indicated by the vertical arrows.

AUDUSD Is Very Bearish! Sell!
Here is our detailed technical review for AUDUSD.
Time Frame: 4h
Current Trend: Bearish
Sentiment: Overbought (based on 7-period RSI)
Forecast: Bearish
The market is testing a major horizontal structure 0.645.
Taking into consideration the structure & trend analysis, I believe that the market will reach 0.641 level soon.
P.S
We determine oversold/overbought condition with RSI indicator.
When it drops below 30 - the market is considered to be oversold.
When it bounces above 70 - the market is considered to be overbought.
Like and subscribe and comment my ideas if you enjoy them!

AUDUSD Bullish MoveAUDUSD looks bullish this Tuesday. A falling channel is forming on the 1hr and m15 chart. Price could bounce from 0.6444 towards 0.649, a 500 pip move.

AUDUSD H1 | Bearish Reaction Off Key ResistanceMomentum: Bearish
Price is currently within the bearish ichimoku cloud.
Sell entry: 0.64842
- Strong Pullback resistance
- 78.6% Fib retracement
- 161.8% Fib extension
- Fair Value Gap
Stop Loss: 0.65060
- Swing high resistance
Take Profit: 0.64514
- Overlap support
High Risk Investment Warning
Stratos Markets Limited (tradu.com/uk ), Stratos Europe Ltd (tradu.com/eu ):
CFDs are complex instruments and come with a high risk of losing money rapidly due to leverage. 70% of retail investor accounts lose money when trading CFDs with this provider. You should consider whether you understand how CFDs work and whether you can afford to take the high risk of losing your money.
Stratos Global LLC (tradu.com/en ): Losses can exceed deposits.
Please be advised that the information presented on TradingView is provided to Tradu (‘Company’, ‘we’) by a third-party provider (‘TFA Global Pte Ltd’). Please be reminded that you are solely responsible for the trading decisions on your account. Any information and/or content is intended entirely for research, educational and informational purposes only and does not constitute investment or consultation advice or investment strategy. The information is not tailored to the investment needs of any specific person and therefore does not involve a consideration of any of the investment objectives, financial situation or needs of any viewer that may receive it. Past performance is not a reliable indicator of future results. Actual results may differ materially from those anticipated in forward-looking or past performance statements. We assume no liability as to the accuracy or completeness of any of the information and/or content provided herein and the Company cannot be held responsible for any omission, mistake nor for any loss or damage including without limitation to any loss of profit which may arise from reliance on any information supplied by TFA Global Pte Ltd.

AUD/USD Fibonacci Overlap method 0.6494 AUD/USD – Analyzed using the Fibonacci Overlap method.
Price pulled back into the 0.6494 confluence area and then reacted lower, continuing its bearish movement.
AUDUSD Short - 25th Nov25AUDUSD Pair shows movement towards 0.65 Resistance Zone , I expect bearish movement once it has entered 0.65 zone.
Expected Entry Price = 0.65000
Expected TP = 0.64700 / 30 PIPS
Risk Management/ SL = 0.65100 / 10 PIPS

EURUSD LONG(in a Range)EURUSD on a daily Timeframe is currently trading in a range, but there is a buying opportunity i spotted earlier today. Still waiting for confirmation to enter the market. Patience plays a big part in the game called Forex ✌

AUDUSD Bearish Bias!
HI,Traders !
#AUDUSD is making a
Retest of the horizontal
Resistance of 0.64759
So as we are locally
Bearish biased we will
Be expecting a further
Bearish move down !
Comment and subscribe to help us grow !

AUD/USD Holds 200-Day SMA - All Eyes on 0.6425 SupportThe Australian Dollar continues to hover near a key support area, with AUD/USD stabilizing around 0.6450 after several sessions of downside pressure. The pair is currently testing the 200-day simple moving average (SMA) at 0.6461, which has provided a temporary floor despite broader weakness.
The 50-day SMA sits slightly above at 0.6541, forming a short-term resistance zone. The MACD remains marginally below the signal line, showing a weak bearish bias with limited downside acceleration. Meanwhile, the RSI hovers near 40, reflecting subdued momentum and suggesting the pair is neither oversold nor showing strong recovery signs yet.
From a broader technical perspective, the pair remains trapped between key Fibonacci retracement levels — support around 0.6425 and resistance near 0.6730. Sustained closes below the 200-day SMA could open the door for a deeper pullback, while a rebound above the 50-day SMA would signal renewed buying interest within the longer-term consolidation.
-MW

AUDUSD Bearish below 0.6500 resistanceThe AUDUSD currency pair continues to display a bearish outlook, in line with the prevailing downward trend. Recent price action suggests a corrective pullback, potentially setting up for another move lower if resistance holds.
Key Level: 0.6500
This zone, previously a consolidation area, now acts as a significant resistance level.
Bearish Scenario (rejection at 0.6500):
A failed test and rejection at 0.6500 would likely resume the bearish momentum.
Downside targets include:
0.6425 – Initial support
0.6400 – Intermediate support
0.6380 – Longer-term support level
Bullish Scenario (breakout above 0.6500):
A confirmed breakout and daily close above 0.6500 would invalidate the bearish setup.
In that case, potential upside resistance levels are:
0.6520 – First resistance
0.6550 – Further upside target
Conclusion
AUDUSD remains under bearish pressure, with the 0.6500 level acting as a key inflection point. As long as price remains below this level, the bias favours further downside. Traders should watch for price confirmation around that level to assess the next move.
This communication is for informational purposes only and should not be viewed as any form of recommendation as to a particular course of action or as investment advice. It is not intended as an offer or solicitation for the purchase or sale of any financial instrument or as an official confirmation of any transaction. Opinions, estimates and assumptions expressed herein are made as of the date of this communication and are subject to change without notice. This communication has been prepared based upon information, including market prices, data and other information, believed to be reliable; however, Trade Nation does not warrant its completeness or accuracy. All market prices and market data contained in or attached to this communication are indicative and subject to change without notice.

AUD/USD may reverse from channel resistance.The Australian dollar rose slightly near 0.6500 on Tuesday after hitting a near two-week low earlier in the session, as the Reserve Bank of Australia signaled caution and emphasized a data-dependent approach to future monetary policy in its latest minutes. Additionally, the RBA recently kept the cash rate at 3.60%, highlighting its reluctance to ease policy further amid persistently high inflation and exaggerated concerns about a weakening labor market.
Technically, AUD/USD is trading within a downward support and resistance channel, forming a lower low and lower high pattern. It is currently near the channel resistance level and is expected to reverse from this level to continue trading downward.
AUD/USD is trading below its 100-day Exponential Moving Average (EMA) and is currently near the 50-day EMA. If the pair continues to trade below the 100-day EMA, it is very likely to maintain the lower low lower high pattern within the support and resistance channels and is expected to reach the support zone near the 0.6470 level.

AUD/USD – Fundamentals Driving Downtrend | 24.11.2025Bearish Channel + Rate-Cut Expectation Pressure = Downside Continuation Setup
🔍 Technical Setup
AUD/USD continues to trade inside a falling channel, respecting the trendline resistance (multiple rejections marked). Price is currently moving toward the resistance zone, offering a potential sell-on-retest opportunity before further downside.
📌 Bias remains bearish as long as price stays below the channel resistance + Ichimoku cloud.
🎯 Trading Plan :
📌 Targets (Support Levels):
1st Support: 0.64130
2nd Support: 0.63912
📌 Invalidation / Risk:
A breakout above 0.6480 would reduce bearish bias.
⚠️ Today’s Fundamental Drivers :
1️⃣ Rate-cut expectations surged:
Markets now price 69% chance of a December rate cut, up from 44% last week → weakens AUD.
2️⃣ New York Fed statement shook sentiment:
Fed official highlighted weak job market as a bigger risk than high inflation, increasing probability of monetary easing → USD firming vs risk currencies like AUD.
➡️ When fundamentals + technical trend align, continuation move is likely.
AUDUSD analysis, AUD/USD forecast, AUDUSD sell setup, Forex signals, Australian dollar outlook, Rate cut impact on forex, AUD technical analysis, price action strategy
⚠️ Disclaimer
This chart is for educational purposes only — not financial advice.
Always manage risk and follow your own trading plan.
❤️ Support the Analysis
If you found this helpful — LIKE 👍 & COMMENT 💬
Your support motivates more daily high-quality chart setups!

AUDUSD LONGAfter a BOS on 4 h create a new LL
we wait for BOS on 1 H create a HH
After take a BUY trade on DEMAND create on 15 MN

AUDUSD FRGNT Daily Forecast -Q4 | W48| D24 | Y25 |📅 Q4 | W48| D24 | Y25 |
📊 AUDUSD FRGNT Daily Forecast
🔍 Analysis Approach:
I’m applying Smart Money Concepts, focusing on:
Identifying Points of Interest on the Higher Time Frames (HTFs) 🕰️
Using those POIs to define a clear trading range 📐
Refining those zones on Lower Time Frames (LTFs) 🔎
Waiting for a Break of Structure (BoS) for confirmation ✅
This method allows me to stay precise, disciplined, and aligned with the market narrative, rather than chasing price.
💡 My Motto:
"Capital management, discipline, and consistency in your trading edge."
A positive risk-to-reward ratio, paired with a high win rate, is the backbone of any solid trading plan 📈🔐
⚠️ Losses?
They’re part of the mathematical game of trading 🎲
They don’t define you — they’re necessary, they happen, and we move forward 📊➡️
🙏 I appreciate you taking the time to review my Daily Forecast.
Stay sharp, stay consistent, and protect your capital
— FRNGT 🚀
OANDA:AUDUSD

AUD-USD Correction Ahead! Sell!
Hello, Traders!
AUDUSD swept the lows beneath the demand boundary, grabbing sell-side liquidity before shifting order flow. A corrective pullback into the mitigation zone may fuel a continuation toward the target imbalance. Time Frame 3H.
Sell!
Comment and subscribe to help us grow!
Check out other forecasts below too!
Disclosure: I am part of Trade Nation's Influencer program and receive a monthly fee for using their TradingView charts in my analysis.

AUDUSD FREE SIGNAL|SHORT|
✅AUDUSD price purged liquidity above the internal high and tapped into the H1 supply block. With displacement shifting bearish, I expect a draw towards the next inefficiency before any reaction.
————————————
Entry: 0.64550
Stop Loss: 0.64710
Take Profit: 0.64400
Time Frame: 1H
————————————
SHORT🔥
✅Like and subscribe to never miss a new idea!✅

Could we see a bearish reversal from here?Aussie (AUD/USD) is falling towards the pivot and could bounce to the 1st resistance.
Pivot: 0.6384
1st Support: 0.6275
1st Resistance: 0.6540
Disclaimer:
The opinions given above constitute general market commentary and do not constitute the opinion or advice of IC Markets or any form of personal or investment advice.
Any opinions, news, research, analyses, prices, other information, or links to third-party sites contained on this website are provided on an "as-is" basis, are intended to be informative only, and are not advice, a recommendation, research, a record of our trading prices, an offer of, or solicitation for, a transaction in any financial instrument and thus should not be treated as such. The information provided does not involve any specific investment objectives, financial situation, or needs of any specific person who may receive it. Please be aware that past performance is not a reliable indicator of future performance and/or results. Past performance or forward-looking scenarios based upon the reasonable beliefs of the third-party provider are not a guarantee of future performance. Actual results may differ materially from those anticipated in forward-looking or past performance statements. IC Markets makes no representation or warranty and assumes no liability as to the accuracy or completeness of the information provided, nor any loss arising from any investment based on a recommendation, forecast, or any information supplied by any third party.

AUDUSD Idea 23.11.2025For audusd I am approaching the set sfp level which could probably be at a price of 0.64, then I would put a possible long below the next low that the market gives us or at least a local low, if I were to consider a short then at a level around the monthly level at a price of 0.663 where the price could be surprised but I would wait for a reaction at a level around the golden pocket level of 0.660
