AUDUSD Daily Forecast -Q3 | W36 | D4 | Y25📅 Q3 | W36 | D4 | Y25
📊 AUDUSD Daily Forecast
🔍 Analysis Approach:
I’m applying Smart Money Concepts, focusing on:
Identifying Points of Interest on the Higher Time Frames (HTFs) 🕰️
Using those POIs to define a clear trading range 📐
Refining those zones on Lower Time Frames (LTFs) 🔎
Waiting for a Break of Structure (BoS) for confirmation ✅
This method allows me to stay precise, disciplined, and aligned with the market narrative, rather than chasing price.
💡 My Motto:
"Capital management, discipline, and consistency in your trading edge."
A positive risk-to-reward ratio, paired with a high win rate, is the backbone of any solid trading plan 📈🔐
⚠️ Losses?
They’re part of the mathematical game of trading 🎲
They don’t define you — they’re necessary, they happen, and we move forward 📊➡️
🙏 I appreciate you taking the time to review my Daily Forecast.
Stay sharp, stay consistent, and protect your capital
— FRNGT 🚀
FX:AUDUSD
AUDUSD trade ideas

AUDUSD – Market Sentiment & Short-Term PlanThe Australian Dollar has lifted higher, supported by stronger-than-expected GDP data and improving global sentiment, while the US Dollar loses momentum. Optimism around China’s recovery adds further fuel, reinforcing AUD’s resilience despite broader market uncertainty.
🔹 Key Drivers:
Australian GDP surprise: Q2 growth at 0.6%, double the previous quarter and above forecasts, signals robust domestic demand and business confidence.
China’s rebound: Stronger services data points to recovery in Australia’s top export market, boosting trade outlook.
US Dollar softness: Concerns about slowing US growth and weaker labor market indicators weigh on the Greenback.
Global sentiment: Easing fears around debt and fiscal risks reduce safe-haven demand, favoring risk currencies like the Aussie.
📉 AUDUSD H1 Technical Outlook (Descending Channel):
Price action is contained within a lower highs / lower lows structure.
Resistance trendline: 0.6550 – 0.6560
Support trendline: 0.6420 – 0.6440
🎯 Short-Term Trading Plan:
🔽 Sell Setup: Watch for rejection near 0.6550 – 0.6560, SL above 0.6580, TP1: 0.6480, TP2: 0.6440.
🔼 Buy Setup: Aggressive longs near channel support 0.6420 – 0.6440, SL below 0.6400, TP1: 0.6500, TP2: 0.6550.
Breakout scenario: A sustained close above 0.6560 could signal bullish reversal, while a drop under 0.6420 would confirm extended downside.
⚠️ Key Watch: US labor data and China’s growth indicators remain critical drivers. Volatility likely around high-impact releases.

HOW BULLS ARE STEPPING-IN ON AUDUSD Price has tapped into a demand zone around 0.65250 after a strong sell-off during Frankfurt and NY sessions. We’re now seeing signs of reaction from this level, with a possible upside continuation towards 0.65350 and 0.65527.
🔹 Key levels to watch:
Demand zone: 0.65145 – 0.65250
Short-term target: 0.65350
Main target: 0.65527
💡 Idea: Waiting for confirmation around the demand zone before going long. If buyers hold this level, we could see a clean move to the upside.
⚠️ Risk: If 0.65145 breaks, bearish momentum may extend further.
👉 What’s your bias here? Are you looking to buy the dip or ride the continuation down? Drop your thoughts in the comments!
🔥 Follow me for more chart updates, setups, and live market insights.

AUDUSD Daily Forecast -Q3 | W36 | D3 | Y25 NY FORECAST 📅 Q3 | W36 | D3 | Y25
📊 AUDUSD Daily Forecast
🔍 Analysis Approach:
I’m applying Smart Money Concepts, focusing on:
Identifying Points of Interest on the Higher Time Frames (HTFs) 🕰️
Using those POIs to define a clear trading range 📐
Refining those zones on Lower Time Frames (LTFs) 🔎
Waiting for a Break of Structure (BoS) for confirmation ✅
This method allows me to stay precise, disciplined, and aligned with the market narrative, rather than chasing price.
💡 My Motto:
"Capital management, discipline, and consistency in your trading edge."
A positive risk-to-reward ratio, paired with a high win rate, is the backbone of any solid trading plan 📈🔐
⚠️ Losses?
They’re part of the mathematical game of trading 🎲
They don’t define you — they’re necessary, they happen, and we move forward 📊➡️
🙏 I appreciate you taking the time to review my Daily Forecast.
Stay sharp, stay consistent, and protect your capital
— FRNGT 🚀
FX:AUDUSD

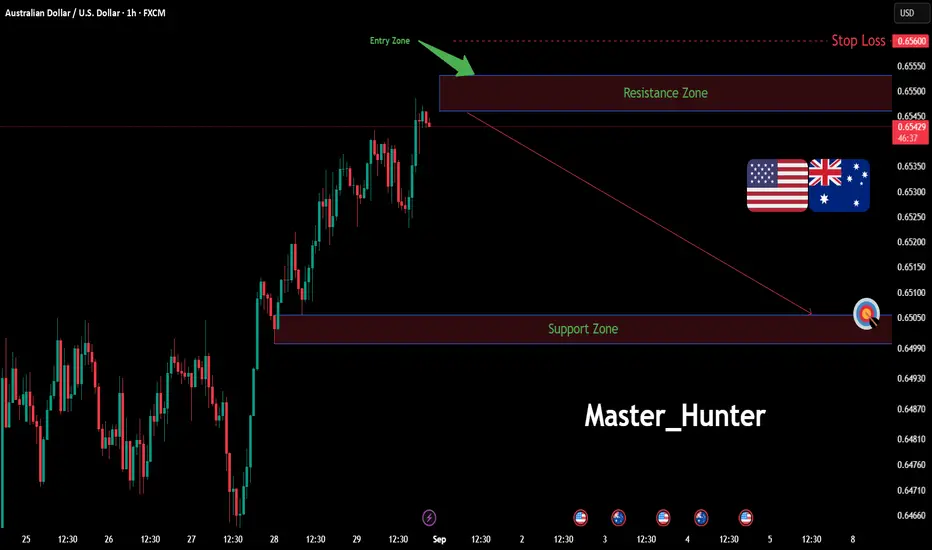
AUD/USD: Bearish Drop to 0.6506? FX:AUDUSD is signaling a bearish move on the 1-hour chart , with an entry zone between 0.6546-0.6553 near a resistance level.
The target at 0.6506 aligns with key support , offering a solid downside play. Set a stop loss at 0.6560 on a close above to manage risk.
This trade boasts an excellent risk-to-reward ratio, making it a compelling opportunity. 🌟 A break below 0.6540 with volume could confirm this drop, driven by USD strength and AUD weakness. Watch U.S. data releases!
💡 Traders can even enter now with proper risk management—adjust position size accordingly. Ready for this move? Drop your take below! 👇
📝 Trade Plan:
✅ Entry Zone: 0.6546 – 0.6553 (resistance area)
❌ Stop Loss: Close above 0.6560 to manage risk
🎯 Target: 0.6506 (key support zone)
Ready for this move? Drop your take below! 👇
AUDUSD - LONG🚀 Yo Edgeflow — Bias for today is live!
🎯 100% model-driven.
No trend-line art, no gut calls. Just a repeatable institutional process delivered every day at London Open
🧠 What Chronex does (bird’s-eye view)
- Scans all 28 major FX pairs every session.
- Ranks each currency’s relative strength / weakness from multi-TF data.
- Pairs strongest vs. weakest to create a tight outlook list.
- Adds built-in risk filters → posts one clean table: *Direction · Conviction · Entry zone · SL*.
📍 Today’s Playbook:
Checklist
H1 Structure: Bullish
H1 Orderflow: Bullish
m15 Orderflow: Bullish
Entry Model: Chain
Risks
1. Do we have economic high impact news release? Later NY
2. Any higher-timeframe counter-trend zones? None
3. Has better zone above/below? None
💬 Drop questions, challenge the outlook, or share your own setups below!

AUD/USD – SNR SetupPrice holding strong support at 0.6512–0.6520.
Upside potential toward 0.6578 resistance with solid RRR.
⚖️ Bias: Bullish above support | Watch for rejection near resistance.
#AUDUSD #Forex #Trading #SNR #PriceAction

AUD/USD BEST PLACE TO SELL FROM|SHORT
AUD/USD SIGNAL
Trade Direction: short
Entry Level: 0.652
Target Level: 0.649
Stop Loss: 0.655
RISK PROFILE
Risk level: medium
Suggested risk: 1%
Timeframe: 1h
Disclosure: I am part of Trade Nation's Influencer program and receive a monthly fee for using their TradingView charts in my analysis.
✅LIKE AND COMMENT MY IDEAS✅

What Are Commodity Currencies and How Do They Correlate?What Are Commodity Currencies and How Do They Correlate?
Commodity currencies are those tied to the value of a country’s key exports, such as oil, metals, or agricultural goods. Their movements are influenced by shifts in global demand, supply disruptions, and economic policies. In this article, we will explore how commodity prices impact commodity-linked currencies and what traders may need to consider.
What Is a Commodity Currency?
The commodity currency definition refers to currencies issued by countries whose economies rely heavily on exporting natural resources. Their value tends to fluctuate in line with the prices of key commodities like oil, metals, and agricultural goods. When these exports become more valuable, the national economy benefits, often leading to a stronger currency. Conversely, when commodity prices fall, these currencies tend to weaken due to declining export revenues. Several well-known commodity-based currencies fall into this category.
Canadian Dollar (CAD) – Oil and Trade with the US
Canada is one of the world’s largest crude oil exporters, making CAD highly sensitive to oil price fluctuations. A rise in oil prices typically strengthens CAD, as higher revenues improve Canada’s trade balance and economic outlook. CAD also reacts to US economic performance, given that over 75% of Canadian exports go to the US. If US demand weakens, CAD can struggle even if oil prices move in a narrow range.
Australian Dollar (AUD) – Iron Ore, Coal, and China’s Economy
Australia is a major supplier of iron ore and coal, with China as its biggest buyer. AUD often moves in response to Chinese industrial activity and infrastructure investment. If China’s economy slows, reduced demand for raw materials can weigh on AUD. Interest rate decisions from the Reserve Bank of Australia (RBA) also play a role, particularly when rates diverge from global peers.
New Zealand Dollar (NZD) – Dairy and Agricultural Exports
New Zealand is the world’s largest dairy exporter, with milk products accounting for a significant portion of its trade. NZD tends to strengthen when global dairy prices rise, especially when demand from Asia is strong. However, because New Zealand has a smaller, more trade-dependent economy than Australia, NZD is also influenced by broader market sentiment and risk appetite.
Norwegian Krone (NOK) – Oil and Energy Markets
Like CAD, NOK moves with oil prices, but its sensitivity is heightened by Norway’s reliance on offshore oil production. Shifts in European energy policy, such as demand for alternative fuels, can also impact NOK beyond direct oil price movements.
Brazilian Real (BRL) – Agriculture and Metals
BRL is driven by Brazil’s exports of petroleum oils, iron ore, soybeans, and other agricultural products. Political stability and investor confidence in emerging markets also affect BRL, making it more volatile than some other commodity currencies.
Key Drivers of Commodity Prices
Commodities fluctuate based on a range of global economic forces, from supply and demand dynamics to geopolitical shifts and financial market activity. Understanding these factors may help traders analyse price trends and their potential impact on commodity-linked currencies.
1. Global Supply and Demand
The fundamental driver of commodity prices is the balance between production and consumption. When supply is tight due to poor harvests, mining disruptions, or oil production cuts, prices tend to rise. Conversely, oversupply—such as when oil producers flood the market—can push prices lower.
2. Economic Growth and Industrial Activity
The demand for commodities is closely tied to economic expansion. Rapid industrial growth increases demand for raw materials like iron ore, copper, and oil. China, for example, is the world’s largest commodity consumer, meaning its economic cycles have a major impact on global prices. A slowdown in Chinese manufacturing can weaken demand, driving commodities and related currencies lower.
3. Geopolitical Risks and Trade Policies
Wars, sanctions, and trade agreements can disrupt supply chains, affecting commodity availability and prices. Sanctions on oil-producing nations or conflicts in key mining regions can tighten supply, driving prices higher. On the other hand, trade agreements that reduce tariffs can boost commodity exports, influencing prices.
4. Central Bank Policy and Inflation
Higher inflation often pushes commodity prices up, as investors turn to raw materials as a hedge against currency devaluation. Central banks responding with interest rate hikes can curb inflation but may also reduce economic activity, lowering commodity demand.
5. Speculation and Market Sentiment
Commodities are heavily traded in futures markets, where speculative activity can cause price swings. Traders believing in higher future demand can drive up prices, while negative sentiment—such as recession fears—can lead to sell-offs.
How Commodity Prices Influence Commodity Currencies
Commodity currencies don’t just track export price movements—they react to broader economic shifts. Here’s how changes in commodity prices correlate with these currencies:
1. Trade Balance and Export Revenues
When commodity prices rise, exporting nations see higher revenues, improving their trade balance and strengthening their currency. Foreign buyers need to exchange their currency for AUD, CAD, or NOK to purchase commodities, increasing demand. When prices fall, the reverse happens, weakening a commodity currency.
2. Economic Growth and Investment
Higher commodity prices often stimulate economic growth in resource-rich countries, leading to increased business investment and job creation. This can improve confidence in the currency. However, if rising prices contribute to inflation, central banks may intervene, affecting currency performance.
3. Interest Rates and Inflation Control
If commodity price increases drive inflation, central banks may consider raising interest rates to stabilise the economy. These higher interest rates tend to attract investors and create buying pressure in the currency. However, if commodity prices drop sharply, central banks may lower rates to support economic growth, putting downward pressure on the currency.
4. Risk Sentiment and Capital Flows
Commodity currencies are often tied to investor risk appetite. In strong market conditions, investors seek higher yields and favour currencies like AUD, NZD, and CAD. But in times of uncertainty—such as economic downturns or geopolitical crises—investors typically move into so-called safe-haven assets, causing commodity currencies to weaken.
5. Global Supply Chain Disruptions
Natural disasters, political instability, or trade restrictions can disrupt commodity supplies. If this leads to higher commodity prices, it often strengthens commodity currencies. However, if demand falls due to economic downturns, both commodity prices and related currencies can suffer.
Implications for Traders
Understanding how commodity prices affect currencies provides traders with insights into market dynamics. For example, traders regularly track oil price reports, iron ore demand forecasts, or global agricultural market updates.
Because commodity currencies often reflect underlying shifts in global economics, traders frequently monitor economic indicators. Economic indicators from major commodity-importing nations—like China’s manufacturing data—are particularly influential, as they provide clues about future demand trends.
Additionally, commodity-linked currencies often respond strongly to shifts in risk appetite. Traders recognise that positive market sentiment typically lifts these currencies, while concerns about global growth or market instability can trigger weakness. This relationship helps traders assess broader market conditions, including when investors might favour riskier or so-called safer assets.
Interest rate differentials between commodity-exporting countries and other major economies are also closely observed. Traders believe that rising interest rates may attract capital inflows and support currency appreciation, especially if commodity prices remain firm.
The Bottom Line
Commodity currencies are closely tied to global economic trends, supply and demand shifts, and market sentiment. Awareness of these relationships may support traders in creating their forex and commodity trading strategies Monitoring commodity markets, interest rate decisions, and geopolitical events may be helpful when navigating commodity currencies.
FAQ
What Are Commodity Currency Pairs?
Commodity currency pairs consist of a commodity-linked currency traded against another currency, typically a major one like the US dollar. Examples include USD/CAD, AUD/USD, and NZD/USD, where CAD, AUD, and NZD are influenced by commodity prices.
What Is Forex and Commodity Trading?
Forex trading involves exchanging currencies, while commodity trading focuses on raw materials like oil, metals, and agricultural products. Since some currencies are tied to commodities, both markets often move together.
What Is the Most Traded Commodity Currency Pair in Forex?
USD/CAD is known as one of the most traded commodity currency pairs. Canada’s reliance on oil exports makes CAD highly responsive to crude oil prices, resulting in notable currency correlations with oil market movements.
This article represents the opinion of the Companies operating under the FXOpen brand only. It is not to be construed as an offer, solicitation, or recommendation with respect to products and services provided by the Companies operating under the FXOpen brand, nor is it to be considered financial advice.
Australian dollar extends gains, hits three-week highThe Australian dollar is coming off a positive week and has extended its gains on Monday. In the North American session, AUD/USD is trading at 0.6556, up 0.27% on the day. Earlier, the Aussie rose as high as 0.6560, its highest level since August 11. With US markets closed for Labor Day, we're unlikely to see stronger movement from AUD/USD during the day.
China's manufacturing sector continues to contract and that could spell trouble for the Australian economy and the Aussie. China's manufacturing PMI for August inched higher to 49.4 from 49.3 in August. This missed the market forecast of 49.5 and marked the fight straight month of contraction in manufacturing.
The manufacturing industry has been dampened by weak global demand and US tariffs on Chinese products. The drop in manufacturing activity means there has been less demand for iron ore from Australia, which is used in the production of steel. This has resulted in a decline in iron ore prices, which has weighed on the Australian dollar and dampened Australia's export-reliant economy.
The US core personal consumption expenditures price index (core PCE), the Federal Reserve's preferred inflation indicator, ticked higher to 2.9% in July, up from 2.8% in June. This matched the market estimate and was a five-month high. Monthly, core PCE rose 0.3%, unchanged from June and in line with the market estimate. The slight rise in US core inflation has raised expectations of a rate cut at the Fed's September 17 meeting to 89%, up from 86% just before the core PCE release on Friday.
AUD/USD is testing resistance at 06552. Above, there is resistance at 0.6563 and 0.6578
0.6537 and 0.6526 are providing support

Long trade
📓 Trade Journal Entry
Pair: AUD/USD
Date: Friday, 29th August 2025
Session: London → New York AM
Timeframe: 4 Hour
🟢 Trade Type
Buyside Trade (Long Position)
📌 Entry Details
Entry: 0.65270
Profit Target: 0.65653 (+0.59%)
Stop Loss: 0.65233 (−0.06%)
Risk-to-Reward (RR): 10.3
📊 Technical Confluence
EMA/WMA Levels:
EMA: 0.65346
WMA: 0.65223
Key Structure:
Price reclaimed mid-range following deep retracement (0.75 fib zone).
Strong accumulation seen on prior sessions, indicating breakout potential.
Entry aligns with EMA/WMA confluence and bullish breakout above liquidity base.
Volume Profile:
Volume: 7.72k ticks — strong confirmation for bullish continuation.
Buying pressure consistent into London → NY transition.
🔎 Narrative / Trade Idea
AUD/USD has been consolidating after sweeping lows earlier in August.
Price reclaimed structure above 0.6523 and EMA/WMA, validating bullish continuation. Entry taken on confirmation at 0.6527, targeting 0.6565 supply.

Long trade
Trade Journal Entry – AUD/USD
Pair: AUD/USD
Timeframe: 30 minute
Session Context: London → New York AM
🟢 Trade Setup
Type: Buyside
Date: Wed 3rd Sept 25
Session: 5:30 am, London to NY AM
Entry: 0.65293
Stop Loss: 0.65251 (0.06%)
Take Profit: 0.65586 (0.45%)
Risk per Trade: 1.0%
R: R Ratio: 6.98
🔑 Observations
Strong rejection of the prior demand zone before the London open.
Clean Fair Value Gap (FVG) fill followed by an impulsive bullish drive.
Entry positioned at retracement inside London → NY handoff volatility window.
Tight stop management enhances RR by nearly 7:1. The trade aligns with intraday session bias, favouring a liquidity sweep below the Asian low before moving higher.

AUDUSD InsightWelcome, subscribers!
Please share your personal opinions in the comments. Don’t forget to like and subscribe.
Key Points
- The final reading of the Eurozone Services PMI for August came in at 50.5, slightly below the flash estimate of 50.7, but still above the 50 threshold that separates expansion from contraction.
- U.S. job openings in July stood at 7.181 million, the lowest level in ten months since September last year, down 176,000 from the previous month and below market expectations of 7.4 million.
- Australia’s Q2 GDP growth was 0.6%, beating market expectations of 0.5%. The growth was driven by a recovery in consumption supported by interest rate cuts and government tax relief measures. Compared with the same period last year, GDP grew 1.8%, the highest since 2023, though still well below the normal level of 2.5%.
Major Economic Events This Week
+ September 4: U.S. August ADP Nonfarm Employment Change
+ September 5: U.S. August Nonfarm Payrolls, U.S. August Unemployment Rate
AUDUSD Chart Analysis
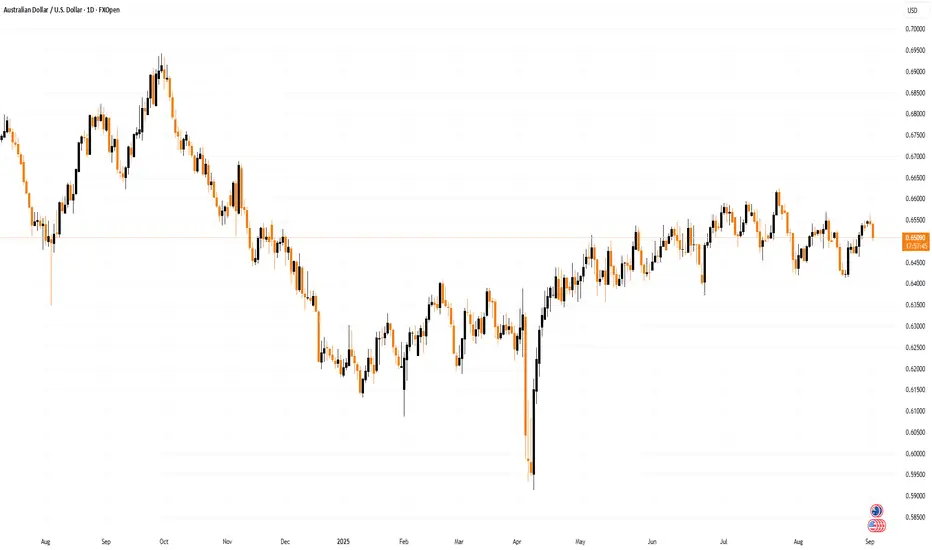
The price is showing small movements around the 0.65000 level near the trend line. While there is still room for upward potential, the lack of supporting catalysts seems to be limiting the rise. If positive drivers emerge, the pair is expected to break through the 0.66000 level and continue its upward trend toward 0.69000. However, if downward pressure strengthens due to external factors, it will be important to watch whether the pair breaks below the 0.64000 level. A break below this level could open the way down to 0.62000.


AUDUSD| Bullish Bias - Momentum Holding Strong🔹 HTF (4H): Structure shows clear bullish intent with strong momentum to the upside. Large bullish candles confirm continuation potential.
🔹 MTF (30M): Price cleared liquidity, mitigated the OB, and refined structure for continuation longs.
🔹 LTF (5M): A CHoCH confirmed directional shift, leading to bullish runs toward the highs.
🔹 Execution Plan: Waiting for price to mitigate my marked OB before reloading longs to target major highs. Until then, patience — let smart money defend the level before we step back in.
🔹 Mindset Note: The market is delivering. Our role is to wait for the OB to be tapped and then execute with precision.

AUDUSD SELLUsing support and resistance tool. i like price to rise to resistance and drop to support zone

AUDUSD Daily Forecast -Q3 | W35 | D2 | Y25
📅 Q3 | W35 | D2 | Y25
📊 AUDUSD Daily Forecast
🔍 Analysis Approach:
I’m applying Smart Money Concepts, focusing on:
Identifying Points of Interest on the Higher Time Frames (HTFs) 🕰️
Using those POIs to define a clear trading range 📐
Refining those zones on Lower Time Frames (LTFs) 🔎
Waiting for a Break of Structure (BoS) for confirmation ✅
This method allows me to stay precise, disciplined, and aligned with the market narrative, rather than chasing price.
💡 My Motto:
"Capital management, discipline, and consistency in your trading edge."
A positive risk-to-reward ratio, paired with a high win rate, is the backbone of any solid trading plan 📈🔐
⚠️ Losses?
They’re part of the mathematical game of trading 🎲
They don’t define you — they’re necessary, they happen, and we move forward 📊➡️
🙏 I appreciate you taking the time to review my Daily Forecast.
Stay sharp, stay consistent, and protect your capital
— FRNGT 🚀
FX:AUDUSD

AUD/USD Watching the Ceiling and FloorThis is just my analysis, not financial advice.
On this 4H AUD/USD chart, I see two important levels:
Ceiling (Red Line – 0.65688): Price is testing this zone. Often, markets slow down or turn here, but sometimes they break through.
Floor (Green Line – 0.64146): If price falls to this area, it has bounced before, so I’m watching it as a possible reaction point.
Right now, price is sitting closer to the ceiling. I’ll be watching to see if it breaks higher or if sellers step in.
I’m not telling anyone what to do—this is just how I see the chart and a simple way to mark levels that matter to me.

29-08-2025 AUDUSDThe market is not always chaotic and disorderly, and there is a precise geometric beauty hidden in price fluctuations. The harmonic form long strategy is a powerful tool for accurately identifying potential market reversal points based on the Fibonacci ratio. When the form forms perfectly at the key support level, it often indicates the depletion of bearish momentum and the initiation of bullish trends.
As shown in the figure: 4H bearish Bat

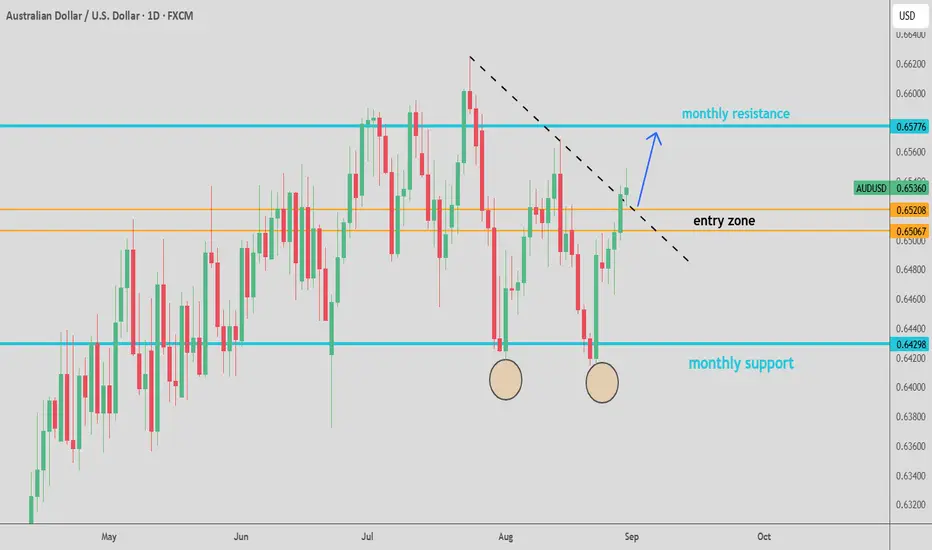
AUD/USD – Last Push Before September Weakness?1. Retail Sentiment
77% of retail traders are currently short on AUD/USD, with an average entry around 0.6459. Historically, when retail positioning is heavily skewed to one side, the market often moves in the opposite direction. This suggests short-term upside potential (contrarian perspective).
2. COT Report (AUD & USD Index)
AUD (CME): Non-Commercials remain heavily short (129k vs 28k long), keeping speculative positioning bearish on AUD. However, Commercials significantly increased their long exposure (+10,892), indicating institutional accumulation.
USD Index (ICE): Non-Commercials hold 19k shorts vs 13k longs, showing a bearish tilt on USD, with additional shorts added (+1,916). Commercials remain net long (12k vs 6k short), defending dollar strength.
➡️ COT Takeaway: Speculators remain bearish on AUD and moderately bearish on USD. This divergence suggests potential sideways movement or consolidation in the short term.
3. Seasonality (September)
Historically, September has been a weak month for AUD/USD, with negative performance across the past 5–15 years. Seasonal curves confirm a bearish bias, especially in the first half of the month.
4. Technical Analysis
Supply Zone: Approaching strong weekly/monthly supply at 0.6600–0.6650.
RSI: Rising toward overbought, pointing to possible exhaustion of bullish momentum.
Structure: Price may complete a test of 0.6600–0.6650 before retracing back to demand zones at 0.6450 and 0.6400.
Trend Dynamics: The medium-term trend remains bearish, with corrective rallies providing opportunities to short.
Operational Outlook
Short-term Bias (1–2 weeks): Potential final push toward 0.6600–0.6650, driven by contrarian sentiment and COT divergence.
Medium-term Bias (September): Expected weakness with downside targets at 0.6450 → 0.6400, aligned with seasonality and speculative positioning.
Strategy: Look for short reversal setups around 0.6600–0.6650 with H4/H1 confirmation (structure break or engulfing pattern). Stop above 0.6700, targets at 0.6450 / 0.6400.

Check the trend It is expected that the upward trend will continue until the specified resistance level. Then, depending on the price behavior within this range, the continuation of the trend will be determined.

AUDUSD Daily Chart Analysis -Q3 W35 D1 Y25📊 AUDUSD Daily Chart Analysis
📅 Q3 W35 D1 Y25
Good day, Traders 👋
AUDUSD is currently showing potential for both 🔼 long and 🔽 short positions, with a clearly defined trading range visible on the higher time frames 🕰️.
While the overall bias remains bullish 📈, a break in structure from the highs ⛔—paired with strong confirmation—could open the door to a short position 📉.
I trade and teach using SMC (Smart Money Concepts) 🧠💰, applying a top-down analysis 🔍 to identify high-probability areas. These zones are refined on the lower time frames ⏳, where I wait for a break of structure 🧱 that meets my entry criteria ✅ before executing any trades.
Wishing you the best on your trading journey 🚀📈
— FRGNT 🔐
FX:AUDUSD
