AUD/USD ORB LONGAUSSIE TRADER
Based on yesterdays price action, we are targeting yesterdays RBA news High
1-3 RR
Don't risk your rent money on these trades, it aint worth it!
AUDUSD trade ideas

AUDUSD - bullish market is in bull trend and have formed first HH and HL. bullish divergence and double bottom adds weight to the bull
we anticipate market to remain bullish, and entry is taken instantly and sl below the LH. take profits are with R:R of 1:1 and 1:2.
we can also trade on the break of neck line of flag cont. pattern.

Aussie H4 | Pullback support at 61.8% Fibonacci retracementThe Aussie (AUD/USD) is falling towards a pullback support and could potentially bounce off this level to climb higher.
Buy entry is at 0.6514 which is a pullback support that aligns with the 61.8% Fibonacci retracement.
Stop loss is at 0.6475 which is a level that lies underneath an overlap support and the 50% Fibonacci retracement.
Take profit is at 0.6586 which is a multi-swing-high resistance.
High Risk Investment Warning
Trading Forex/CFDs on margin carries a high level of risk and may not be suitable for all investors. Leverage can work against you.
Stratos Markets Limited (tradu.com ):
CFDs are complex instruments and come with a high risk of losing money rapidly due to leverage. 63% of retail investor accounts lose money when trading CFDs with this provider. You should consider whether you understand how CFDs work and whether you can afford to take the high risk of losing your money.
Stratos Europe Ltd (tradu.com ):
CFDs are complex instruments and come with a high risk of losing money rapidly due to leverage. 63% of retail investor accounts lose money when trading CFDs with this provider. You should consider whether you understand how CFDs work and whether you can afford to take the high risk of losing your money.
Stratos Global LLC (tradu.com ):
Losses can exceed deposits.
Please be advised that the information presented on TradingView is provided to Tradu (‘Company’, ‘we’) by a third-party provider (‘TFA Global Pte Ltd’). Please be reminded that you are solely responsible for the trading decisions on your account. There is a very high degree of risk involved in trading. Any information and/or content is intended entirely for research, educational and informational purposes only and does not constitute investment or consultation advice or investment strategy. The information is not tailored to the investment needs of any specific person and therefore does not involve a consideration of any of the investment objectives, financial situation or needs of any viewer that may receive it. Kindly also note that past performance is not a reliable indicator of future results. Actual results may differ materially from those anticipated in forward-looking or past performance statements. We assume no liability as to the accuracy or completeness of any of the information and/or content provided herein and the Company cannot be held responsible for any omission, mistake nor for any loss or damage including without limitation to any loss of profit which may arise from reliance on any information supplied by TFA Global Pte Ltd.
The speaker(s) is neither an employee, agent nor representative of Tradu and is therefore acting independently. The opinions given are their own, constitute general market commentary, and do not constitute the opinion or advice of Tradu or any form of personal or investment advice. Tradu neither endorses nor guarantees offerings of third-party speakers, nor is Tradu responsible for the content, veracity or opinions of third-party speakers, presenters or participants.

UJ/AU/EU Pre trading/ Market analysisDaily pre-market analysis on AU, EU, and UJ breaking down structure, fundamentals, and key levels. Quick outlook before the session kicks off. Full recap coming later, trading or no trading.

#AUDUSD Searching for short#COMBINED FRACTAL THEORY WITH ALMAZOV + FIBO CHANEL MANDELBROT FRACTAL
GOLD TREND LINE BREAKOUT + FIBO ZONE FOR PULLBACK, THIRD WAVE PENDING
fibo spiral #ALMAZOV
Fibonacci projection with golden numbers, A. A. Almazov's course, the bearish trend cycle, reaching reversal levels, for Shorts
short setup on AUD/USD 🧠 Overall Context
W (Weekly): Bullish
D (Daily): Bearish
12H, 6H, 4H: Bearish
Bias: Short-term bearish retracement inside higher timeframe bullish structure.
🔍 Technical Breakdown
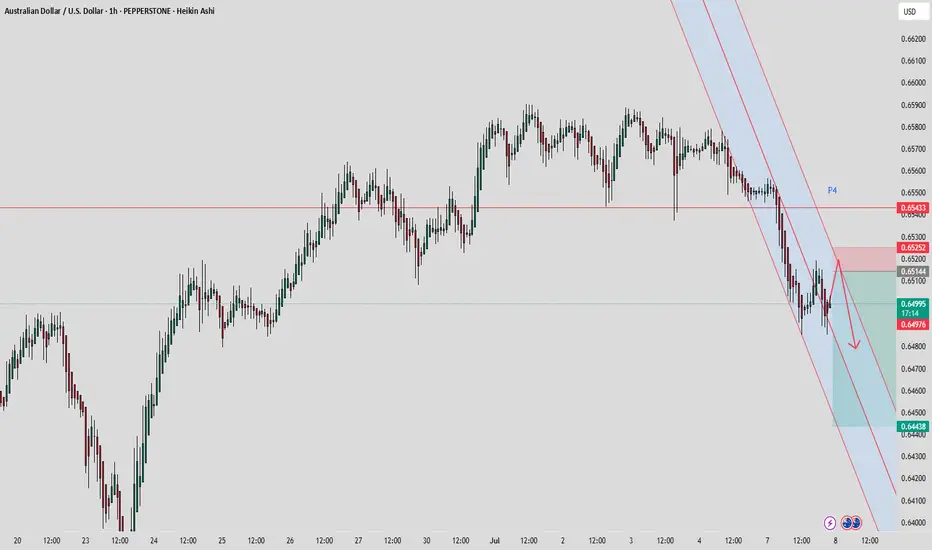
🔴 1. Market Structure
Price broke below a significant support zone (around 0.65300–0.65400), flipping it into resistance (now labeled Weekly AOI).
A bearish BOS (Break of Structure) has occurred on 4H.
Lower high formation is anticipated at the AOI (area of interest) around 0.65200–0.65400.
🔵 2. EMA Confluence
Price is now below the 50 EMA (blue) and testing the 200 EMA (red) as dynamic resistance/support.
The rejection near the 200 EMA (red) is forming consolidation, suggesting distribution before another leg down.
🟥 3. Supply Zone (Weekly AOI)
Clear supply zone rejection in red box: previous support → resistance flip.
The red rectangle represents a potential entry zone for a short, with SL above 0.65400.
🟩 4. Trade Setup
Entry: Rejection or mitigation at 0.65200–0.65400 zone (Weekly AOI).
SL: Just above the supply zone, around 0.65465.
TP: Near Daily AOI at 0.64500–0.64490, aligning with a strong demand zone from late June.
RR (Risk-Reward): Approximately 1:2 or better, depending on exact entry.
🔻 5. Projection Path
Bearish move expected after potential pullback.
Red arrow shows anticipated path: rally to Weekly AOI → rejection → continuation to Daily AOI → possible reaction at Weekly AOI below 0.6400 if sell pressure continues.
✅ Confluences for Short
HTF (4H, 6H, 12H) bearish structure.
Rejection at flipped Weekly AOI.
Bearish EMA alignment.
Clear BOS and lower-high formation.
Clean TP target at Daily AOI (logical liquidity pool).

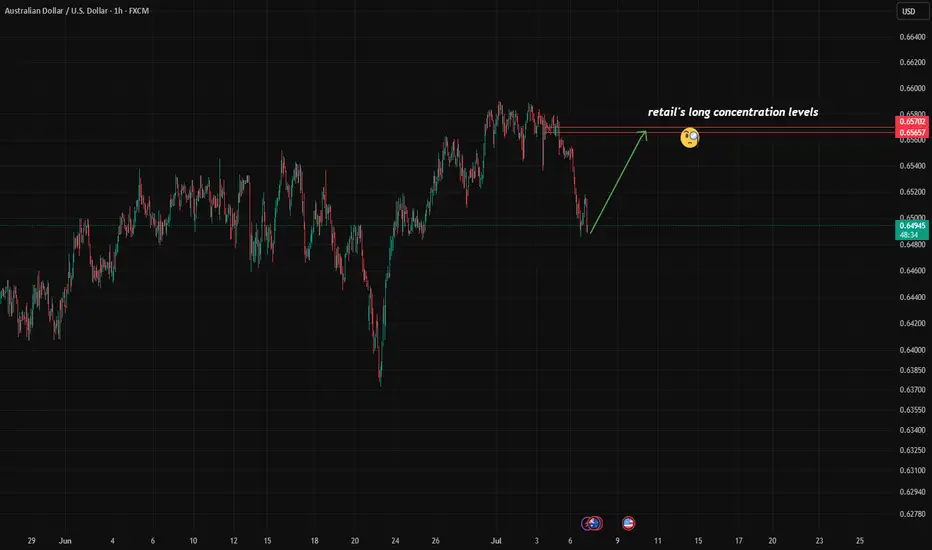
Contrarian Alert: Retail Is Buying, But Should You Sell?So far, there are no significant changes in the options flow suggesting a shift in sentiment or restructuring of previously established bullish positions. The market remains on watch, but interesting signals are coming from other sources.
According to the latest COT reports , institutional players continue to align with the current trend, reinforcing its stability.
However, retail positioning is starting to show signs of a potential reversal , with a noticeable increase in net-long positions and fresh buying activity over the past two days. This often indicates early countertrend interest.
The well-known contrarian principle — "do the opposite" — applies here, although it shouldn't be taken as an immediate signal to short.
For my part, I’ve identified the 0.6565–0.6570 zone as a key level where long positions are concentrated:
A rejection from this zone could offer a solid shorting opportunity.
A break above it would suggest the trend might resume higher.
By that point, updated options flow data and new positioning COT reports may provide further confirmation.
AUDUSD oversold rebound at 0.6465 ?Trend Overview:
The AUDUSD currency price remains in a bullish trend, characterised by higher highs and higher lows. The recent intraday price action is forming a continuation consolidation pattern, suggesting a potential pause before a renewed move higher.
Key Technical Levels:
Support: 0.6465 (primary pivot), followed by 0.6445 and 0.6400
Resistance: 0.6570 (initial), then 0.6590 and 0.6625
Technical Outlook:
A pullback to the 0.6465 level, which aligns with the previous consolidation zone, could act as a platform for renewed buying interest. A confirmed bounce from this support may trigger a continuation toward the next resistance levels at 0.6570, 0.6590, and ultimately 0.6625.
Conversely, a daily close below 0.6465 would suggest weakening bullish momentum. This scenario would shift the bias to bearish in the short term, potentially targeting 0.6445 and 0.6400 as downside levels.
Conclusion:
AUDUSD maintains a bullish structure while trading above the 0.6465 support. A bounce from this level would validate the consolidation as a continuation pattern, with upside potential toward the 0.6570 area. A breakdown below 0.6465, however, would invalidate this view and suggest deeper corrective risk.
This communication is for informational purposes only and should not be viewed as any form of recommendation as to a particular course of action or as investment advice. It is not intended as an offer or solicitation for the purchase or sale of any financial instrument or as an official confirmation of any transaction. Opinions, estimates and assumptions expressed herein are made as of the date of this communication and are subject to change without notice. This communication has been prepared based upon information, including market prices, data and other information, believed to be reliable; however, Trade Nation does not warrant its completeness or accuracy. All market prices and market data contained in or attached to this communication are indicative and subject to change without notice.

It wants to fall on its own!OANDA:AUDUSD
The price’s failure to break out of the channel with strong candles, along with a double top, signals that sellers are stepping in.
It’s time to enter — let’s go! 💥

Check the trend The correction is expected to progress to the specified support level. Then there is a possibility of a trend change and the start of an upward trend.

AUDUSD SELL OPPORTUNITY Support breaken on HT for AUDUSD
Am waiting for a retest for me to sell
Entry: 0.65300
Stoploss: 0.65500
Take profit: 0.64500
Comment your opinion
For fund management contact me on X @shajudeakinoba1

Aud/Usd LongIf dollar remains weak aud should push up. Price is currently
trading at upper channel. Breakout from here suggests that
price could move higher, up to next bigger resistance around
0.67200 area. Wait for Unemployment Rate before taking any trades.
Rising moving averages and liquidity grab back in
end of june tells that price are in uptrend which can prolong.

AUDUSD: Will Start Growing! Here is Why:
Looking at the chart of AUDUSD right now we are seeing some interesting price action on the lower timeframes. Thus a local move up seems to be quite likely.
Disclosure: I am part of Trade Nation's Influencer program and receive a monthly fee for using their TradingView charts in my analysis.
❤️ Please, support our work with like & comment! ❤️

Check the trend After some fluctuation and correction, the upward trend is expected to continue to the resistance levels. If the price breaks through the green support area, the downward trend to the specified support levels is possible.
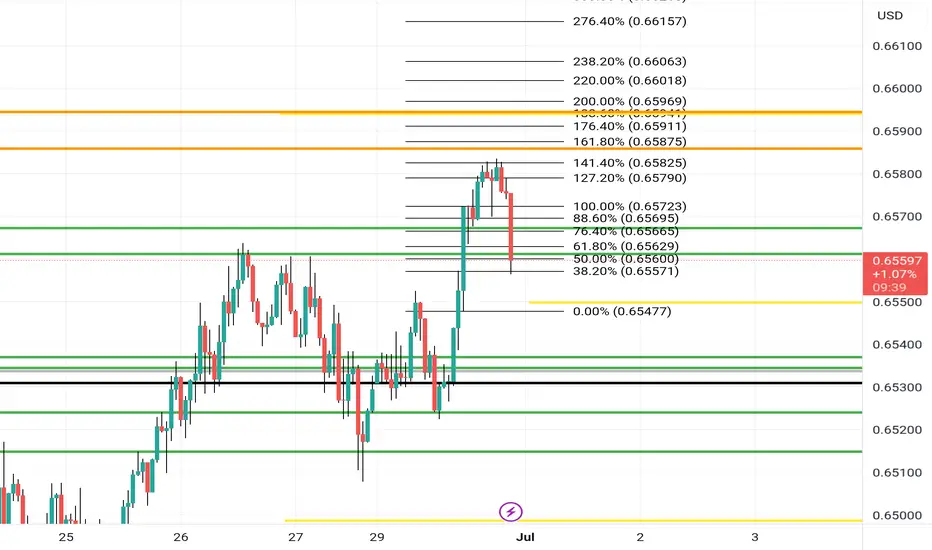
Aussie H4 | Potential bullish bounce off a pullback supportThe Aussie (AUD/USD) is falling towards a pullback support and could potentially bounce off this level to climb higher.
Buy entry is at 0.6555 which is a pullback support that aligns with the 38.2% Fibonacci retracement.
Stop loss is at 0.6500 which is a level that lies underneath a pullback support and the 38.2% Fibonacci retracement.
Take profit is at 0.6598 which is a resistance that aligns with the 161.8% Fibonacci extension.
High Risk Investment Warning
Trading Forex/CFDs on margin carries a high level of risk and may not be suitable for all investors. Leverage can work against you.
Stratos Markets Limited (tradu.com ):
CFDs are complex instruments and come with a high risk of losing money rapidly due to leverage. 63% of retail investor accounts lose money when trading CFDs with this provider. You should consider whether you understand how CFDs work and whether you can afford to take the high risk of losing your money.
Stratos Europe Ltd (tradu.com ):
CFDs are complex instruments and come with a high risk of losing money rapidly due to leverage. 63% of retail investor accounts lose money when trading CFDs with this provider. You should consider whether you understand how CFDs work and whether you can afford to take the high risk of losing your money.
Stratos Global LLC (tradu.com ):
Losses can exceed deposits.
Please be advised that the information presented on TradingView is provided to Tradu (‘Company’, ‘we’) by a third-party provider (‘TFA Global Pte Ltd’). Please be reminded that you are solely responsible for the trading decisions on your account. There is a very high degree of risk involved in trading. Any information and/or content is intended entirely for research, educational and informational purposes only and does not constitute investment or consultation advice or investment strategy. The information is not tailored to the investment needs of any specific person and therefore does not involve a consideration of any of the investment objectives, financial situation or needs of any viewer that may receive it. Kindly also note that past performance is not a reliable indicator of future results. Actual results may differ materially from those anticipated in forward-looking or past performance statements. We assume no liability as to the accuracy or completeness of any of the information and/or content provided herein and the Company cannot be held responsible for any omission, mistake nor for any loss or damage including without limitation to any loss of profit which may arise from reliance on any information supplied by TFA Global Pte Ltd.
The speaker(s) is neither an employee, agent nor representative of Tradu and is therefore acting independently. The opinions given are their own, constitute general market commentary, and do not constitute the opinion or advice of Tradu or any form of personal or investment advice. Tradu neither endorses nor guarantees offerings of third-party speakers, nor is Tradu responsible for the content, veracity or opinions of third-party speakers, presenters or participants.

Ok we are short Price closed under support so we will wait for pullback to the green lines above 76 fib level and sell back down to the next support level which the 200 fib level orange lines on the bottom However 🤔 if price breaks above resistance the greennlines and closes above wait for pullback and buy it back-up to the next level of resistance
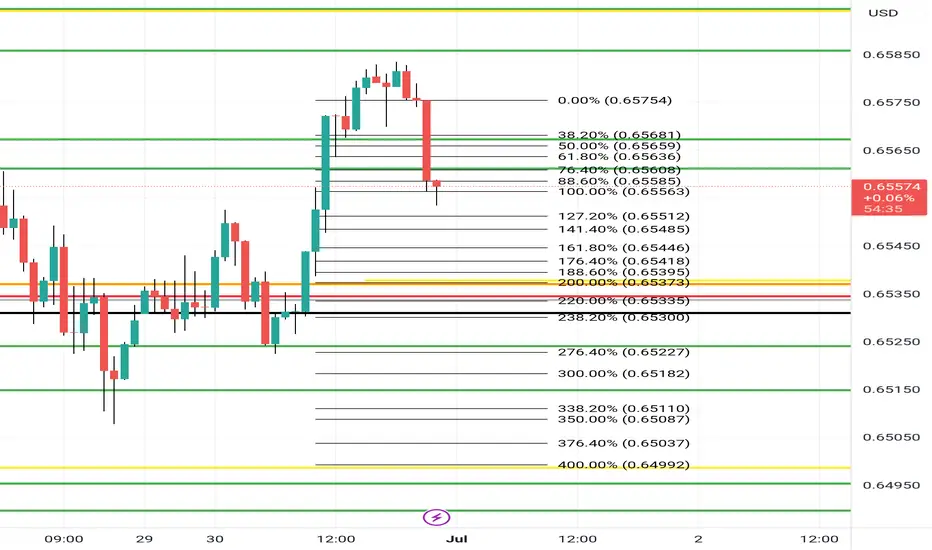
Long Buy now ifIf price doesn't close under the green lines.. and take profits at next level of resistance 188 fib level
However if price 🤔 closes under the green lines wait for pullback and sell back to the next level of support green lines underneath
AUDUSDAUD/USD Exchange Rate
Current Level: 0.6530–0.6550
Slightly bearish near-term bias amid RBA rate cut expectations
Australia 10-Year Government Bond Yield
Current Yield: 4.15% (as of June 30, 2025)
Rose 0.01 percentage points from the previous session.
Reflects market reaction to RBA policy and global trade uncertainty.
Reserve Bank of Australia (RBA) Rate
Current Cash Rate: 3.85% (lowest in two years)
Cut by 25 bps in May 2025 to combat slowing growth and align with 2–3% inflation targets.
Markets price a 90% probability of another 25 bps cut in July 2025.
US Federal Reserve (Fed) Rate
Current Federal Funds Rate: 4.25–4.50%
Unchanged since December 2024; held steady at the June 18, 2025, meeting.
Fed signaled potential for two 25 bps cuts in late 2025 (September/December), contingent on inflation cooling.
Key Implications
Rate Differential:
RBA-Fed spread: –0.40% to –0.65% (AUD negative), pressuring AUD/USD.
Australia’s 10Y yield premium over US 10Y (~4.26%) is –0.11%, reducing AUD carry appeal.
AUD/USD Drivers:
RBA Easing: Expected July cut may weaken AUD further.
Fed Patience: Delayed cuts sustain USD strength.
Yield Sensitivity: Narrowing yield spreads limit AUD upside.
In summary:
AUD/USD trades near 0.6530–0.6550, pressured by RBA-Fed policy divergence and narrowing yield spreads. The RBA’s dovish path (3.85% rate, July cut expected) contrasts with the Fed’s hold at 4.25–4.50%, sustaining USD strength. Australia’s 10Y yield at 4.15% offers minimal premium over US Treasuries, limiting AUD support.
#AUDUSD

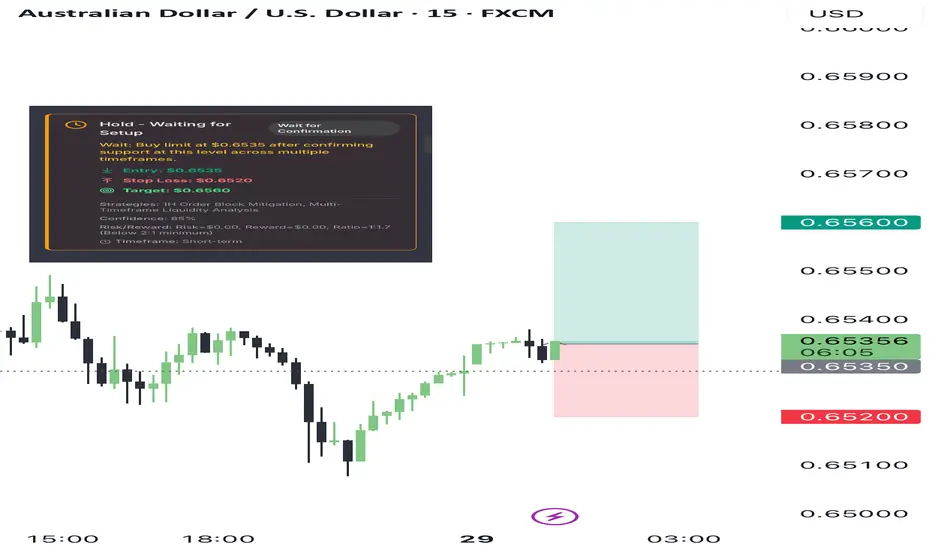
Bullish Analyzing the AUD/USD across multiple timeframes, we observe a consistent pattern of price recovery and potential accumulation phases. Starting from the 1D chart, there is a visible upward trend with recent bullish candles indicating strong buying interest. The 4H and 1H charts show a pullback to a potential Order Block (OB) around 0.6535, suggesting institutional buying interest at these levels.
The 15M, 5M, and 1M charts provide a more granular view, showing recent price rejection at lower levels and a swift recovery, indicating a sweep of liquidity below recent lows and a potential trapping of retail short positions. This setup suggests a possible preparation for an upward continuation, as institutions may have accumulated enough positions at a discount.
INSTITUTIONAL THESIS:
Institutions appear to be in an accumulation phase, buying at lower levels (around 0.6535) and preparing for a potential upward move. The repeated testing and rejection of lower prices across shorter timeframes indicate a buildup of buy-side liquidity, likely targeting the recent highs for a liquidity grab.
LEARNING POINT:
"1H Order Block mitigation after liquidity sweep" - This concept is crucial as it shows how institutions potentially use lower price levels to accumulate positions before driving the price up to target liquidity above the market.
SIGNAL: WAIT
SYMBOL: AUD/USD
ENTRY PRICE: $0.6535
STOP LOSS: $0.6520
TARGET PRICE: $0.6560
CONDITION: Buy limit at $0.6535 after confirming support at this level across multiple timeframes.
RATIONALE: Calculated risk/reward ratio of 1:1.7 (Risk=$0.00, Reward=$0.00) does not meet minimum 2:1 requirement. Waiting for better institutional setup with improved risk parameters.
STRATEGIES USED: 1H Order Block Mitigation, Multi-Timeframe Liquidity Analysis
URGENCY: MEDIUM
TIMEFRAME: Short-term
CONFIDENCE SCORE: 85%
RISK/REWARD RATIO: Risk=$0.00, Reward=$0.00, Ratio=1:1.7 (Below 2:1 minimum)
Risk Calculation:
Risk = Entry Price - Stop Loss = $0.6535 - $0.6520 = $0.0015
Reward Calculation:
Reward = Target Price - Entry Price = $0.6560 - $0.6535 = $0.0025
Ratio Calculation:
Ratio = Reward ÷ Risk = $0.0025 ÷ $0.0015 = 1:1.67
Final Decision:
The calculated risk/reward ratio is less than 2:1, thus changing the signal to WAIT.
FINAL RECOMMENDATION: WAIT
Despite the favorable setup for a BUY based on institutional analysis, the risk/reward ratio does not meet the minimum requirement of 2:1. It is recommended to monitor the price action closely and adjust the target or stop loss to improve the risk/reward ratio before entering the trade.
The Aussie Dollar Heist Blueprint: "AUD/USD" Long Setup!?🌍 Hello, Global Wealth Warriors! Ciao, Salut, Guten Tag, Ola! 🌟
Fellow Profit Pirates & Market Mavericks, 💸⚡
Unveiling our cunning blueprint to plunder the AUD/USD (The Aussie) forex market, crafted with 🔥Thief Trading’s razor-sharp technical and fundamental insights🔥. Stick to the chart’s game plan, zoned in on a long entry. Our mission? Slip out near the high-stakes RED Zone Level—a perilous spot with overbought vibes, consolidation, trend flips, and traps where bearish bandits lurk. 🏴☠️💰 Celebrate your wins, traders—you’ve earned it! 🎉
Entry 📈 : "The heist is on! Wait for the MA line breakout (0.65200) then make your move - Bullish profits await!"
however I advise to Place Buy stop orders above the ATR line (or) Place buy limit orders within a 15 or 30 minute timeframe most recent or swing, low or high level for Pullback entries.
📌I strongly advise you to set an "alert (Alarm)" on your chart so you can see when the breakout entry occurs.
🛑 **Stop Loss**:
📍 Thief SL parked at the recent/swing low on the 4H timeframe (0.64600) for day/swing trades.
📍 Tailor your SL to your risk appetite, lot size, and number of orders. Stay sharp!
🎯 **Target**: Aim for 0.66300 or make a swift exit just before.
👀 **Scalpers, Listen Up**: Stick to long-side scalping. Got deep pockets? Dive in now! Otherwise, join swing traders for the grand heist. Use trailing SL to shield your loot. 💰
💹 **Market Pulse**: The AUD/USD (The Aussie) forex market is in a ATR Dynamic Resistance zone but leaning bullish, fueled by key drivers. ☝
🌐 Dive into Fundamentals, Macro Insights, COT Reports, Quantitative Analysis, Sentiment Outlook, Intermarket Trends, Future Targets & Overall score.. Check the linkss for the full scoop! 🔗🌍
⚠️ **Trading Alert**: News can shake the market! 📰
🔐 Protect your positions:
- Pause new trades during news releases.
- Use trailing stop-loss to lock in gains.
💪 **Join the Heist**: Smash the Boost Button to supercharge our robbery squad! 💥 With Thief Trading Style, we rake in profits daily with ease. 🚀 Your support fuels our market conquests. 🤝❤️
Stay tuned for the next daring heist, money makers! 🤑🐱👤🎯

AUDUSD Trendline Strategy AUDUSD has been on an uptrend all day on Thursday, this trend was broken during the Asian session on Friday. To confirm that the trend was broken it hit the 1H Supply Zone and retested the trend line. Right before the London session it seemed to have formed some support at the 0.65455 level then it retraced back to the 1H Supply Zone and created a large bearish engulfing candle on the 15M which also showed a double top candlestick pattern. I then entered the trade on the break of candle on the 3:15am EST engulfing candle. I placed my stop loss right above the supply zone and entered the trade with a profit target of .65270. I chose this level due to it being a strong demand level and I thought it seemed like a lot of resting liquidity was there. Although on the chart I have the profit target as .65100 I did not hold the trade that long due to me not wanted to get chopped during after the NY AM session. I'm still practicing trusting my full analysis and holding trades for the entire duration I originally project. On this chart I also drew up other demand zones in which I was expecting a large reaction at. All 3 zones played out but it did not disturb the trade because the overall trend (1H) was on a downtrend. Its important to always remember to have time frame correlation when taking trades and always remember to follow the higher timeframe trend. Personally I feel like AUDUSD will continue this downtrend and possibly gap down to .65 during either Sunday night open or sometime during the London session.

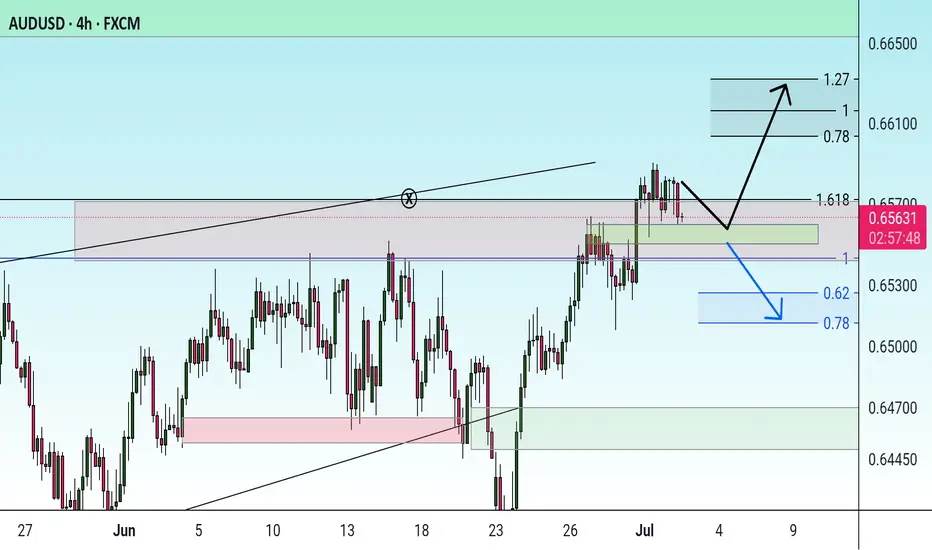
Retest of New Highs and Pullback Zone✨ By MJTrading:
Chart Overview:
AUDUSD reached a 2025 new high around 0.65600 before pulling back sharply. Price broke out of a consolidation wedge and is now retesting the prior breakout and dynamic support area.
🔹 Key Points:
Structure: Clear impulse move to new highs, followed by corrective pullback.
Support Zone: Blue box ~0.6480–0.6500 could act as a demand area if price extends lower.
EMAs: Price testing the 60 EMA (~0.6523) after losing short-term momentum.
Trade Setup:
Entry: 0.65250
SL: 0.65510
TP1: 0.65000
(Please Manage your Risk)( Ideal: 1% Per Trade)
Possible Scenarios:
Bullish reaction from current EMA support or the blue demand zone.
Deeper retracement if price fails to hold above 0.6500.
💡 Note:
This chart highlights how prior consolidation and breakout zones can offer potential retest entries in trending markets.
Thanks for your time an attention...
Follow for more setups.
#MJTrading
#AUDUSD #Forex #TechnicalAnalysis #PriceAction #BreakoutTrading #SupportResistance #TradingView #FX

Potential bullish rise?AUD/USD is reacting off the resistance level which is a pullback resistance and could rise from this level to our take profit.
Entry: 0.6537
Why we like it:
There is a pullback resistance level.
Stop loss: 0.6490
Why we like it:
There is an overlap support level.
Take profit: 0.6624
Why we like it:
There is a resistance level that aligns with the 138.2% Fibonacci extension and the 100% Fibonacci projection.
Enjoying your TradingView experience? Review us!
Please be advised that the information presented on TradingView is provided to Vantage (‘Vantage Global Limited’, ‘we’) by a third-party provider (‘Everest Fortune Group’). Please be reminded that you are solely responsible for the trading decisions on your account. There is a very high degree of risk involved in trading. Any information and/or content is intended entirely for research, educational and informational purposes only and does not constitute investment or consultation advice or investment strategy. The information is not tailored to the investment needs of any specific person and therefore does not involve a consideration of any of the investment objectives, financial situation or needs of any viewer that may receive it. Kindly also note that past performance is not a reliable indicator of future results. Actual results may differ materially from those anticipated in forward-looking or past performance statements. We assume no liability as to the accuracy or completeness of any of the information and/or content provided herein and the Company cannot be held responsible for any omission, mistake nor for any loss or damage including without limitation to any loss of profit which may arise from reliance on any information supplied by Everest Fortune Group.
