Long trade Wed 26th Nov 25 — 3:25 PM
NY Session PM
Entry TF: 5-Min
🟩 1. Trade Parameters
Pair: AVAXUSDT
Direction: Buy-Side
Entry: 14.557
Stop Loss: 14.400
Take Profit: 15.577
Risk–Reward: 8.43R
🟨 2. Higher-Timeframe Context
HTF (1H / 4H) market structure:
Market has been in a multi-day downtrend, forming successive lower-lows and lower-highs.
A major demand zone between 13.12 – 13.30 was reclaimed on 23rd Nov.
Strong NY expansion candle broke above compression on 25th Nov, signalling a likely HTF shift.
Price pulled back into discount, forming a textbook re-accumulation structure.
30min TF overview
🟧 3. Liquidity
Liquidity Taken (Before Entry)
Sweep of Sunday–Monday lows around 13.12.
Deep purge into demand zone engineered equal-lows → liquidity grab.
Market created inducement wicks at 14.12, which were later swept.
Liquidity Above (Targets)
Buy-side liquidity pool at 15.57 (clear cluster of prior highs).
Multiple FVGs above price requiring rebalancing.
Void left from the sharp selloff on Nov 18th → price required re-pricing into inefficiency.
Liquidity narrative:
Sweep → Accumulation → Reclaim → Displacement to inefficiency.
5min Chart
🟥 4. SMC / ICT Technical Model Breakdown
✔ Model Type: BOS + FVG + Re-Accumulation Breakout
BOS at ~14.25 confirms shift back to bullish orderflow.
Clean FVG (14.22–14.28) formed after displacement.
Price returned to the FVG → mitigated OB → tapped equilibrium.
Strong continuation displacement candle printed → ideal entry timing.
Key Confluences:
Demand zone → BOS → FVG → OB alignment
EMA/WMA bullish crossover
Tight SL under engineered liquidity
🟦 5. Entry Logic
The entry at 14.557 acted as the:
Re-accumulation breakout confirmation
Retest of micro FVG
Retest of prior resistance turned support
SL placement below 14.400 protected under:
✓ Equal lows
✓ OB mitigation
✓ Structural swing low
🟫 7. Trade Outcome
Status: In session
Market insights

AVAXUSDT 1D#AVAX has broken above the falling wedge pattern on the daily chart. In case of a successful retest, the potential upside targets are:
🎯 $16.96
🎯 $18.32
🎯 $19.68
🎯 $21.61
🎯 $24.07
⚠️ Always remember to use a tight stop-loss and maintain proper risk management.

AVAXUSDT spot investment or swing tradeThere was a massive bullish news on AVAX blockchain, "In the New York suburb of Bergen, one of the wealthiest counties in the United States, the country's largest real estate tokenization project on the Avalanche blockchain is launching.
Over the next five years, it is planned to transfer 370,000 property deeds, which in total will amount to about $240 billion." This is a long standing asset that recommended itself as a reliable blockchaing and survived in a tight competitiveness. Waiting for $70+ on a bullish market is a bare minimum for me.

FireHoseReel | AVAX: Building Energy Below Resistance🔥 Welcome To FireHoseReel !
Let’s dive into the analysis of AVAX (Avalanche).
👀 AVAX – 4H Market Structure Overview
On the 4-hour timeframe, after breaking its descending trendline, AVAX showed very strong bullish bias.
Even the pullback after the breakout was very shallow. Price then compressed like a spring and pushed away from the breakout zone with large whale-sized candles.
AVAX is now ranging just below a major resistance.
If this resistance breaks and price holds above it, we can say AVAX is likely to continue its bullish trend.
📊 Volume Analysis
Pay close attention to volume:
• The first volume spike came right after the bearish trendline breakout.
• The second volume increase appeared during the pullback completion at the $13.94 support.
• Now we are seeing the third wave of rising buy volume below resistance. This structure suggests that AVAX may be preparing for another multi-timeframe bullish rally, potentially transferring this momentum into higher timeframes.
✔️ AVAX/BTC – Additional Confirmation Looking at AVAX/BTC gives us a different perspective.
This pair is strongly bullish, confirming that AVAX deserves to stay on our watchlist for potential positions.
AVAX/BTC completed its correction while staying above a bullish curve structure and, just like AVAX/USDT, it is now sitting below resistance.
This resistance creates a trigger at 0.0001654, which is a key breakout level for confirmation.
📌 Trading Scenarios for AVAX, Below are the scenarios you can use alongside your own trading strategy. 👇🏻
🟢 Long Scenario
A breakout above the current AVAX resistance at $13.94, supported by rising buy volume, could start another bullish rally.
However, keep in mind:
• This is still the first direct test of resistance
• Any immediate entry here would be considered high risk
The safer approach is to:
• Wait for a pullback and consolidation
• Then enter after buy volume increases and the pullback structure completes
🔴 Short Scenario
A strong rejection from resistance, followed by:
• A lower high compared to the previous top
• A break of the new local low
• And the appearance of bearish patterns such as Failure Swing or Non-Failure Swing
can offer a valid short entry.
Even if we see equal highs, a confirmed break of the local low can still provide a short opportunity.
🛞 Risk Management & Disclaimer
Please remember to always use proper risk management and position sizing. Nothing in this analysis is financial advice. The market can change quickly, so always trade based on your own strategy, research, and risk tolerance. You are fully responsible for your own trades.

Long trade📘 TRADE JOURNAL ENTRY — AVAXUSDT (5m)
Pair: AVAXUSDT
Direction: Buyside
Session: NY AM
Entry TF: 5m
Entry: 13.521
Take Profit: 14.557 (+7.23%)
Stop Loss: 13.437 (-0.25%)
Risk-to-Reward: RR 20.86
🟩 2. HTF Context (Structure & Liquidity)
HTF market (1H–4H) was in macro discount, aligning with a bullish retracement model.
Prior days show deep displacement down into a demand zone 13.12 – 13.30.
Clear liquidity sweep of the Friday low, followed by compression and accumulation.
London session earlier in the day created a swing low BOS → signalling bullish continuation.
🟧 3. Model Identification (ICT / SMC Confluence)
ICT Model Used: Buyside Reversal → Displacement → FVG Entry
Confluences: Accumulation wedge → breakout → retest entry.
Liquidity grab below the structural low (13.18 zone).
Break of Structure (BOS) on the 5m confirming short-term trend reversal.
FVG (Fair Value Gap) aligned with entry zone.
Demand zone MITIGATED, validating the bullish bias.
EMA/WMA stack inversion (blue above yellow) signalling bullish strength.
🟪 4. Entry Logic
Entry triggered at 13.521, which aligned with:
Rebalanced FVG
Retest of breaker block inside the premium/discount boundary
Trendline retest + micro BOS confirmation
Volume shift from selling to buying pressure
Stop loss placed logically below the inefficiency + OB low at 13.437
🟥 5. Liquidity Targets (Upside Objectives)
Local buy-side liquidity above 13.897 – cleared
HTF supply zone 13.97 – 14.25 – approached
Full imbalance toward 14.557 – completed
Continuation target: 14.92 (HTF liquidity pool)
🟫 6. Sentiment & Narrative
Tokyo PM session provided clean reaccumulating, typical for continuation plays.
Broader crypto market in a risk-on phase, assisting directional bias.
Retail trapped short after breakdown of London low, providing fuel for the upside run.
Market moved strongly from discount → equilibrium → premium, validating execution.
🟨 7. Outcome Summary
Status: In Session

Avax Turning PointAvax turning point.
At least some of the cash needed for the markets was provided by the sale of digital assets. All I can say from now on is that digital assets have always overcome all these challenges. In fact, they've even surpassed periods of worsening, even complete rejection. Now, they're also receiving institutional and political support. We're at a turning point. Customers are always needed, and I don't think there will be any further outflow from digital assets because that would lead to an irreversible loss of trust, which market players don't want. I think some of the necessary liquidity should now be obtained by selling metals to meet the market's remaining liquid needs. We'll wait and see, but it won't be long.
Not financial advice. the fabrications of a madman.

AVAX/USDT - Heads Into Major Demand Zone — Bounce or Breakdown?AVAX is currently standing at one of its most critical decision points since 2023. After failing to hold its multi-year ascending trendline, the price finally broke down and closed the weekly candle below the structural level at $15.7. This isn’t a normal correction — this is a signal that the market structure has shifted, and AVAX is entering a survival phase.
But the story is far from over. Price is now sliding into a zone that has historically acted as a deep accumulation region:
$10.7 – $8.5
This yellow block is where large-volume buyers previously stepped in during the 2022 crash and later consolidated before major moves.
The long wick sweeping into this zone indicates early buyer activity — but not enough to reclaim structural levels yet.
Right now, AVAX is in the middle of a high-timeframe battlefield between two major outcomes:
Bullish Reversal Scenario → Price reclaims $15.7 and climbs back above the broken trendline.
Bearish Breakdown Scenario → Price loses $10.7, falls deeper into the accumulation block, and risks testing historical lows near $5.7.
---
Bullish Scenario — (Reversal Trigger: $15.7)
A bullish reversal starts to form if AVAX can:
1. Bounce strongly from $10.7–$8.5, and
2. Close a weekly candle back above $15.7.
This would signal that significant accumulation has taken place and that smart money is re-entering the market.
Major upside targets become:
$20.80 → First structural resistance
$32.90 → Mid-range breakout
$54.30 → High-timeframe trend reversal confirmed
This is the “comeback path” for AVAX.
---
Bearish Scenario — (Breakdown Trigger: $10.7)
If AVAX fails to hold above $10.7 on the weekly, the long-standing demand zone collapses.
Downside implications:
Immediate drop toward $8.5
If $8.5 also breaks →
Price opens the door to a deeper decline toward the historical low around $5.7
This would confirm a major redistribution phase, not just a pullback.
---
Price Action & Market Structure
AVAX is forming lower highs and lower lows, confirming a weekly downtrend.
Breaking the ascending trendline marks a clear character shift.
The $10.7–$8.5 zone now acts as the final defense for bulls before entering a multi-year lower range.
Expect liquidity sweeps & stop hunts in this region — patience and weekly confirmation are key.
---
AVAX is now sitting inside a make-or-break zone that will determine its multi-month direction.
Hold $10.7–$8.5 → Potential strong reversal back toward $20–$30
Break below $10.7 → Deeper bearish continuation toward the $5.7 region
This is the type of price zone where professional traders wait for confirmation, not quick reactions.
---
#AVAX #Avalanche #CryptoTA #AVAXUSDT #TechnicalAnalysis #Altcoins #PriceAction #MarketStructure #CryptoOutlook #SupportAndResistance

Long trade 🟦 TRADE SUMMARY
Pair: AVAXUSDT.P
Direction: Buyside
Date: Sun, 23rd Nov 2025
Time: 7:00 PM
Session: Tokyo PM
Timeframe: 1H
---
🟩 TRADE PARAMETERS
Entry Price: 13.221
Profit Target:13.735 (+3.88%)
Stop Loss: 13.146 (–0.57%)
Risk-to-Reward Ratio: 6.78 R
---
🟨 MARKET CONTEXT & STRUCTURE
1. Higher-Timeframe Context
AVAX was in a deep markdown leg after heavy distribution on Nov 20–21 (visible volume spike at the selling climax)—a micro-accumulation range formed between 13.05 and 13.25, with repeated liquidity sweeps. The 1H BOS above 13.32 confirms the shift from bearish → bullish order flow.
1Hr TF
2. Intraday Structure
A clean BOS occurred after the NY Session (Nov 23) when the price broke above the structure at 13.28. EMAs show: 50 EMA reclaim, 200 EMA flattening → early bullish alignment.
Price retests:
FVG (13.18–13.23)
Bullish OB at 13.21
Accumulation range low
🟪 LIQUIDITY STORY
Sell-Side Liquidity Clears
London + NY sessions swept liquidity below 13.15 and 13.05.
A deeper liquidity purge into 12.26–12.28 formed the structural low zone.
Buy-Side Liquidity Above
Internal liquidity targets:
13.42
13.56
HTF inefficiencies inside 13.70–13.85
Major buyside magnet: supply zone at 13.77–13.87
🟫 WYCKOFF ALIGNMENT
We assume we are heading towards Phase D (LPS → SOS).
🟩 VOLUME & CONFIRMATION
High volume candle marks the selling climax.
Accumulation shows low-volume downward tests → bullish absorption.
Displacement up from 13.18 shows volume expansion, confirming algorithmic buying.
🟥 OUTLOOK / CONTINUATION
Above 13.32, bullish continuation remains valid.
Key continuation targets:
13.85
14.05
14.30
Invalidation:
Break below 13.12 invalidates the bullish structure.

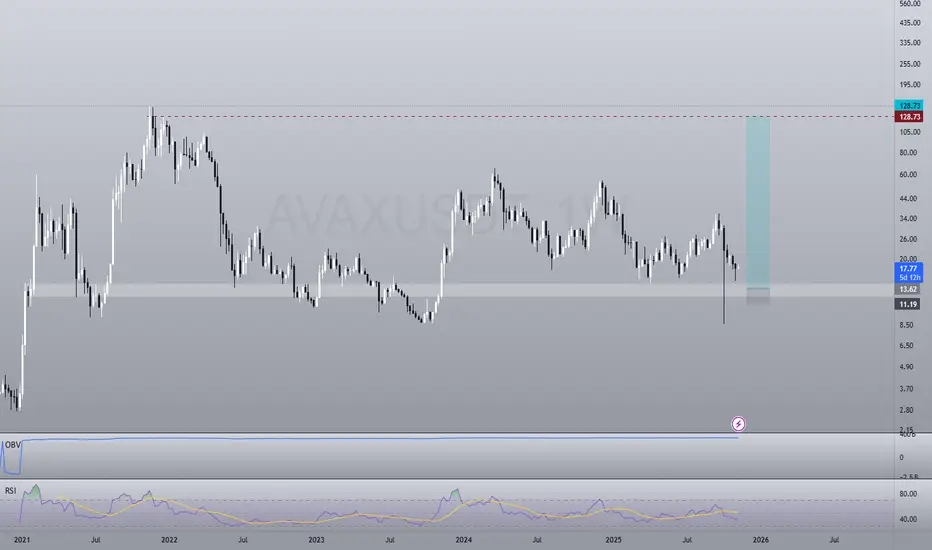
$AVAX at last and crucial support!CRYPTOCAP:AVAX has dropped back into a major multi-year support zone after a sharp weekly selloff. This level has held the range multiple times since 2021, and the price is now reacting around the same support + long-term trendline.
If AVAX manages to hold this area, a bounce toward the mid-range levels ($21.40 → $33.22) becomes possible. Failure to hold support would expose lower targets.
This zone is critical — CRYPTOCAP:AVAX either stabilizes here or breaks structure for a deeper move.
Fundamental Analysis:
BINANCE:AVAXUSDT stands out as a leading Layer-1 blockchain, known for speed, scalability, and growing real-world asset (RWA) adoption. Subnet activity is rising, DeFi liquidity is improving, and the network’s decentralized finance ecosystem is gaining fresh momentum. Exchange reserves continue to decline, showing healthy on-chain fundamentals and liquid supply trends.
Latest Updates:
- Avalanche recently completed a major network upgrade, temporarily suspending AVAX C-Chain deposits and withdrawals for enhanced security.
- Its DeFi roadmap features the V1 launch on Sepolia testnet (Q4 2025), including new liquidity pools and support for ETH and USDT.
- Recent audits and a $50k bug bounty solidify Avalanche’s reputation for security and reliability.

$AVAX USDT 4H CHART UPDATECRYPTOCAP:AVAX USDT 4H CHART UPDATE ✅
📌 CRYPTOCAP:AVAX USDT is currently in a bearish trend ✅
📌It has been continuously rejected by a trend line ✅
📌If there is a bullish reversal from the level I have marked below, I would expect a price increase again. ($10.60 - $9.30) 🚀

LongAccording to the analysis of the waves and the help of the Gann method, it can be expected that the price will return to the green zone again.
This is my personal opinion. Please don't use it as your trading criteria. Good luck

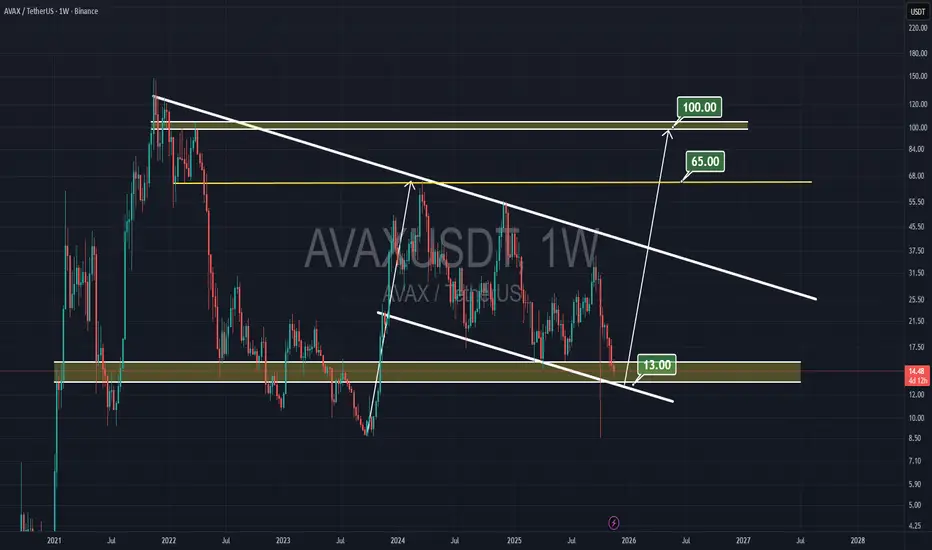
AVAX to rally againAVAX is at a very low level, it can hold support here and rally over the next few months to around $100.
AVAX USDT LONG SIGNAL---
📢 Trade Signal – AVAX/USDT
📈 Position Type: Long
💰 Entry Price: 14.725
---
🎯 Take-Profit Targets (Partial Exits)
TP1 = 14.977
TP2 = 15.226
TP3 = 15.449
TP4 = 15.716
TP5 = —
TP6 = —
---
🛑 Stop-Loss: 14.295
📊 Timeframe: —
⚖️ Risk/Reward Ratio: 2.30
💥 Suggested Leverage: 5× – 10×
---
🧠 Technical Analysis Summary
AVAX is rebounding from a strong intraday support zone around 14.30 – 14.50, where buyers previously stepped in aggressively.
Price has formed a short-term bullish structure and is currently reclaiming liquidity above 14.70.
Momentum indicators are showing fresh bullish pressure, with clean upside continuation potential toward 15.22 – 15.45.
A decisive move above 15.45 can open room toward the mid-range resistance at 15.71.
---
⚙️ Trade Management
✔️ Partial profit at TP1
✔️ Move SL → Break Even after TP1 hits
✔️ Consider trailing SL if price reaches TP2 or higher
✔️ Avoid re-entry if price closes below 14.295
---
⚠️ Disclaimer
This signal is for educational purposes only — always manage your risk.
---
📌 Hashtags for TradingView
#AVAXUSDT #Avalanche #CryptoSignal #TradingView #FuturesTrading #Altcoins #TechnicalAnalysis
---

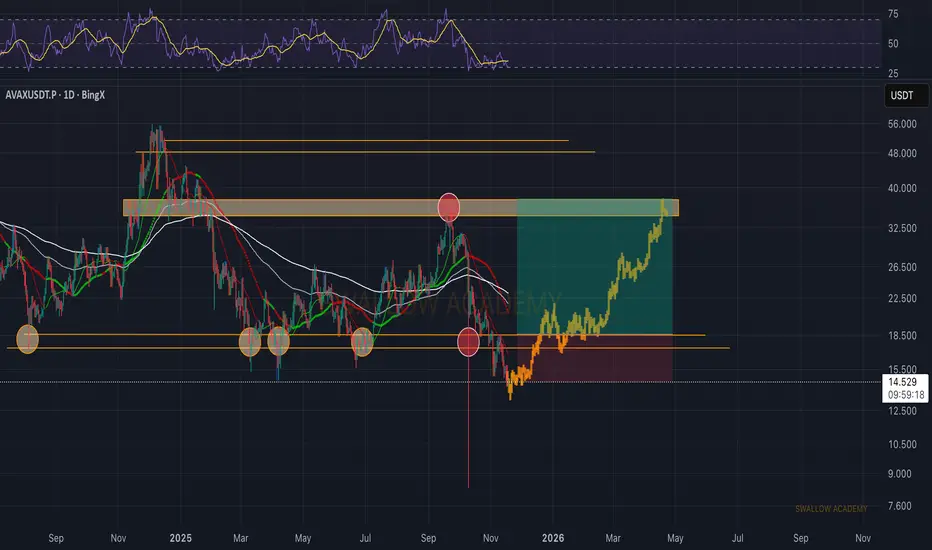
Avalanche (AVAX): Waiting For Perfect SetupAVAX is in an interesting spot. We can’t say for sure whether the bottom is in, but the chart looks promising. After breaking below the recent lower-lows zone, price didn’t push much deeper — which tells us sellers might be exhausted.
If we start seeing signs of reversal, we’ll be looking for a shift in structure and buildup toward that upper zone. Until then, patience. No chasing.
Swallow Academy

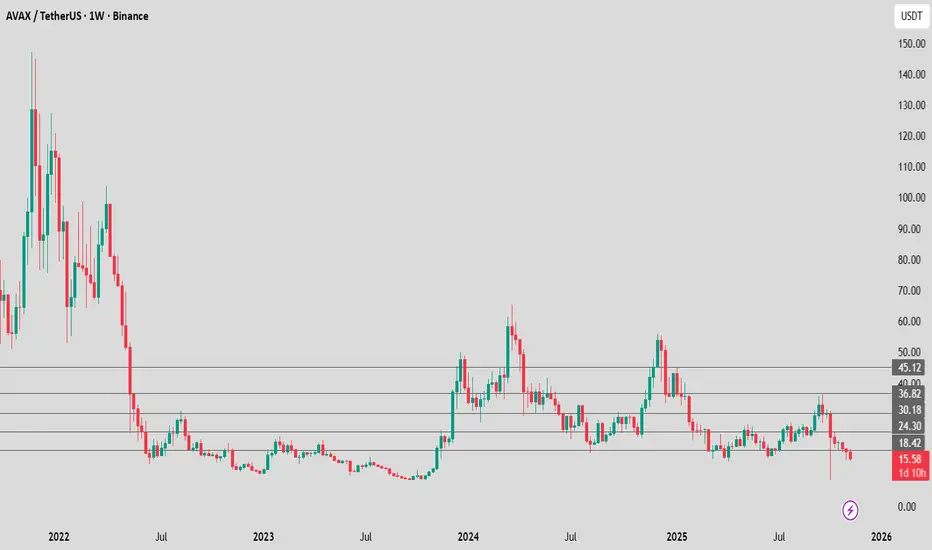
AVAXCurrent signal: bearish.
If AVAX stays below 18.4 USDT, there is a real possibility of a continuation of the decline toward 13–14 USDT.
For a reversal into a bullish trend, AVAX would need to:
break above 24.30 USDT,
hold a weekly higher low,
increase buying volume.
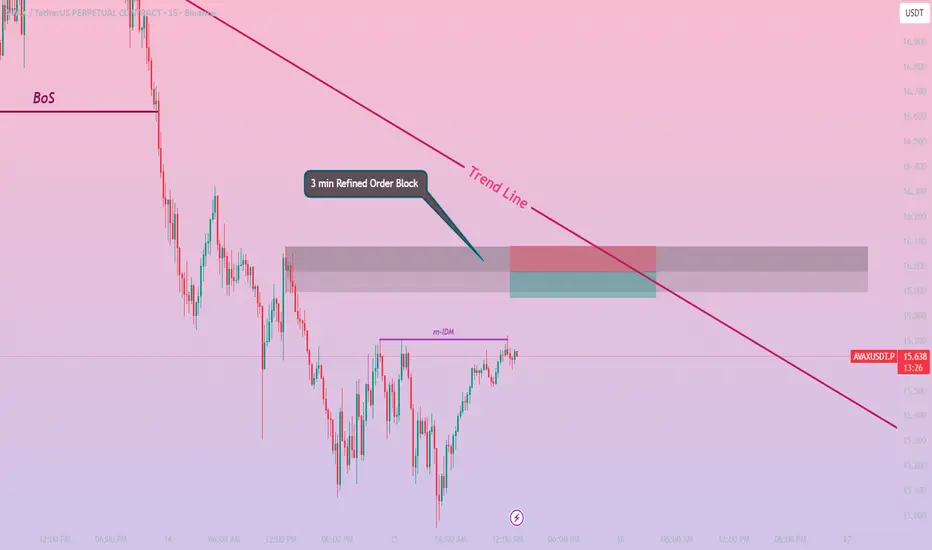
AVAXUSDT Analysis (SMC + Price Action)AVAX is clearly in a downtrend, creating clean impulsive and corrective legs. I marked the 15-minute OB along with a refined 3-minute OB.
The refined OB gives the highest probability setup, as it aligns perfectly with the overall bearish structure and the trendline.
Now we just wait to see how price reacts when it taps into that zone.
Trade setup
Entry: 15.977
Stop Loss: 16.080
Take Profit: 15.875
Risk–Reward: 1:1
I’ve used both SMC and price action to build this setup. Let’s see how it plays out.
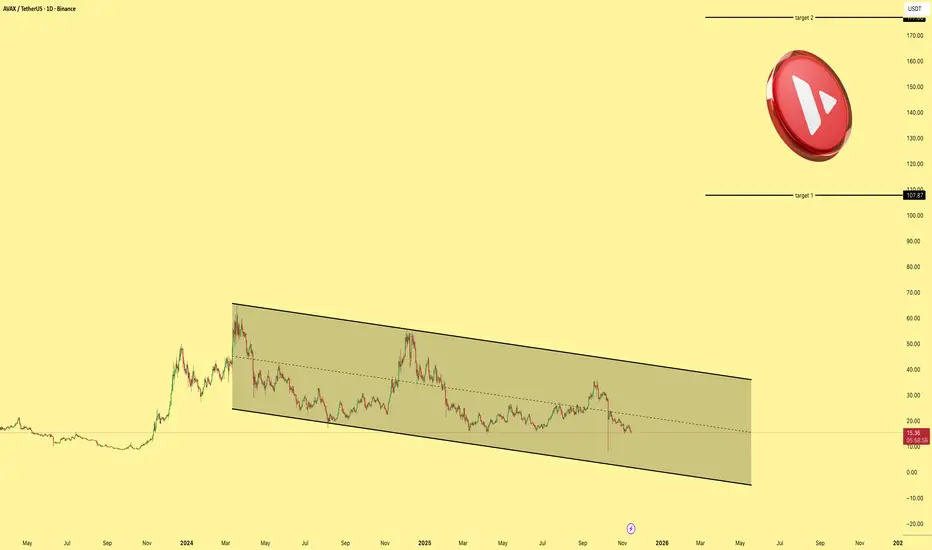
AVAXCRYPTOCAP:AVAX is trading inside a clean descending channel pattern and building pressure for a major move. From the current price to target two, there is a potential 1000 percent gain on the table once the breakout confirms. Structure looks strong and momentum is starting to shift.
AVAX on Track — Ready for a ComebackFor me, AVAXUSDT is starting to show clear signs of growth 🚀
The chart structure looks encouraging — I like the way bulls are slowly stepping in and building momentum for a potential move to the upside.
🎯 Target: 18,400
❌ Invalidation zone (stop): 16,789
Let’s see how the market plays it out — the setup looks promising!
⚠️ Disclaimer:
This is not a financial signal. Trade according to your own risk management and never trade without stop-losses.
💬 Drop your reactions and comments below — and hit follow if you’d like me to post regular updates and forecasts on AVAX!

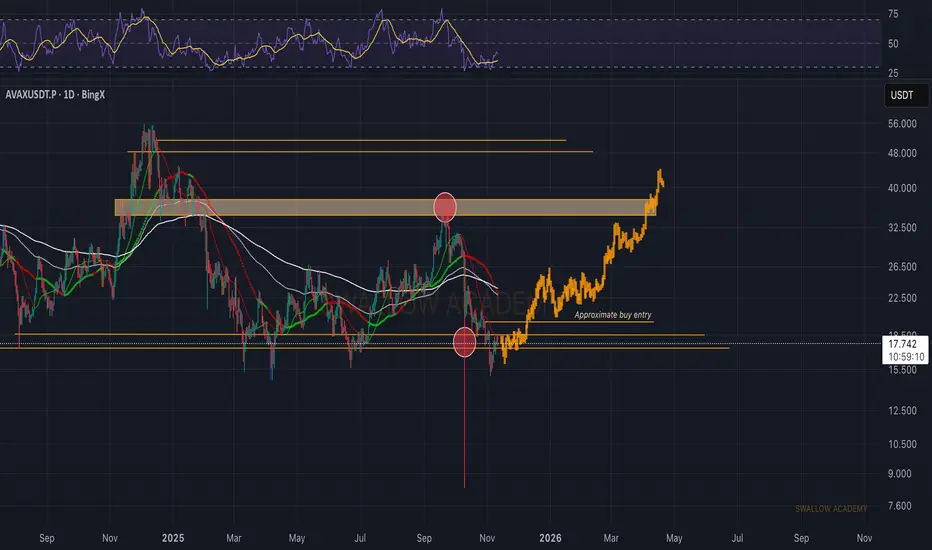
Avalanche (AVAX): Might Be a Good Buy Entry Soon!AVAX is sitting at the same zone where we saw a strong reversal earlier. Right now, we’re watching for a BOS — that’s the key signal needed before looking for any continuation setup. If buyers manage to break structure cleanly, momentum should shift back up fast.
Swallow Academy
Hello $Avax, glad your in buying zone againYeah, it's coming. The weekly zone to add or buy. Big wicks below, stopping all prev longs. But retest of the area sounds solid.
Swing long, no leverage (too wide stop). DCA between 16 & 13 , depending on your preferences.
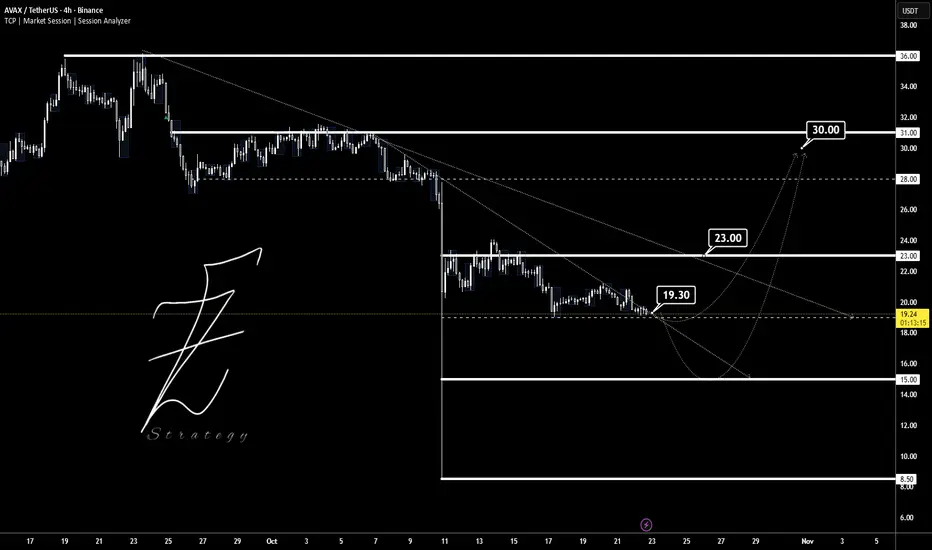
AVAXUSDTThis chart is The try that breakout trendline to way in 30$ target.
Supports: 19 - 15 -8.5
Resistance: 23 - 30 - 36
⚠️ Please control money management.
BINANCE:AVAXUSDT
AVAX USDT SHORT SIGNAL---
📢 Signal Alert
🔹 Pair: AVAX / USDT
📉Trade Type: Short
💰Entry Zone: 17.845
🎯 Take-Profit Targets (Partial Management):
▫️TP1 = 17.635
▫️TP2 = 17.370
▫️TP3 = 17.117
▫️TP4 = 16.850
🛑 Stop-Loss: 18.190
📊Timeframe: 15m
⚖️Risk/Reward Ratio: 2.25
📌Suggested Leverage: 5x - 10x
⚠️ Capital management is mandatory.
💬Please review the chart before entering the trade.
---
🧠 Technical Overview:
AVAX is showing potential weakness at current levels.The short entry at 17.845 suggests this is a key resistance zone. A rejection from this area could trigger a downward move toward the identified targets. The price structure indicates potential for a bearish move, with support levels marked at each take-profit target.
The R/R ratio of 2.25 provides a favorable risk-reward setup for this short position.
---
⚙️ Trade Management Tips:
· Take partial profits at TP1 and move stop-loss to breakeven
· Trail stop-loss for remaining positions as price moves downward
· Close position if price decisively breaks above 18.190
· Monitor price action closely around entry level for confirmation
· Consider scaling out profits at each target level
---
⚠️ Disclaimer:
This signal is for educational purposes only and not financial advice.
Always perform your own analysis and apply strict risk management.
---
Note: I've added TP4 at 16.850 to maintain consistency with the format. Please verify this level matches your analysis.
