TradeCityPro | AVAX Eyes Breakout Beyond Major Resistance👋 Welcome to TradeCity Pro!
In this analysis, I want to review the AVAX coin for you. It’s one of the popular crypto projects, with a market cap of $9.93 billion, currently ranked 18th on CoinMarketCap.
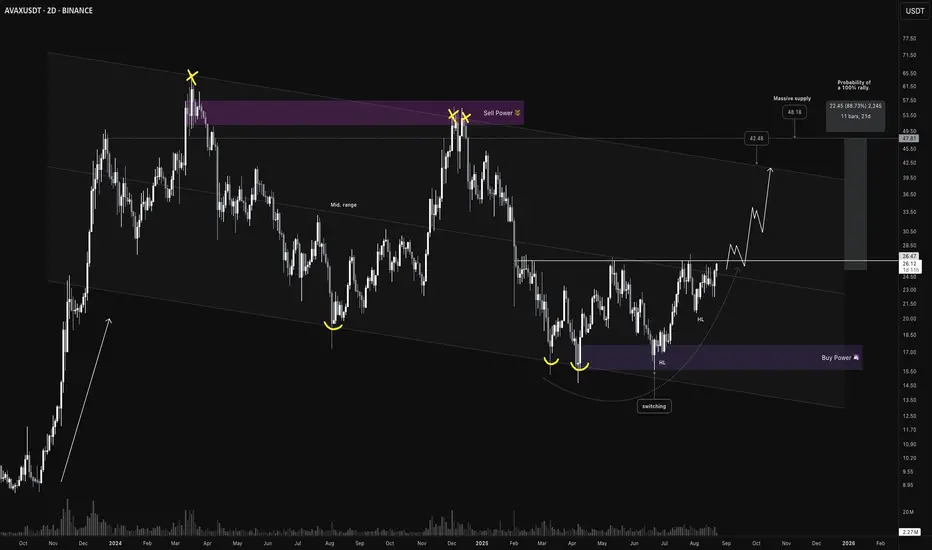
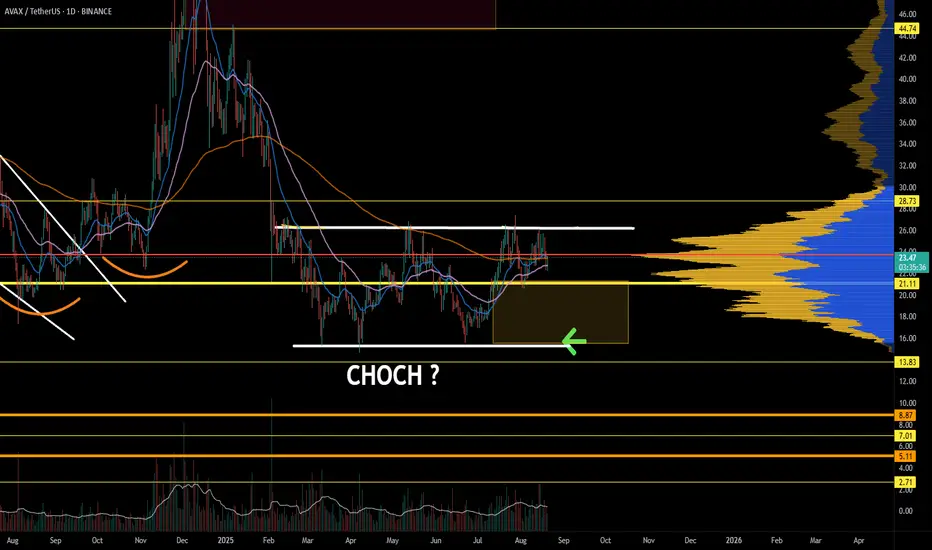
⏳ Daily Timeframe
On the daily timeframe, after AVAX was supported at the 16.46 zone and broke the 18.77 trigger, it made a bullish move up to the 26.59 high. With the break of 18.77, we could have opened a long position.
💥 There is a Maker Seller zone near the 26.59 area. This is a very important zone, and breaking it can lead to the start of the main bullish trend of AVAX.
🔔 If the 26.59 zone is broken with a trigger, I will open a long position. The first target on AVAX is 35.06, and before this area, there aren’t any major resistances.
📈 If the price does not make a lower low below 20.82, the probability of breaking 26.59 increases and the next bullish move will be easier to form.
✔️ However, if the price stabilizes below this zone, the 26.59 trigger is still valid, but we will probably have more attractive entry points. In that case, I will update the analysis for you and share those entry points.
🔽 For a short position, the first logical trigger in my opinion is breaking 16.46. Although it is far from the current price, this area is the bottom of the box, and its break could start a new bearish trend.
📝 Final Thoughts
Stay calm, trade wisely, and let's capture the market's best opportunities!
This analysis reflects our opinions and is not financial advice.
Share your thoughts in the comments, and don’t forget to share this analysis with your friends! ❤️
AVAXUSDT trade ideas

Avalanche · Early or Late? · Targets & TALook at AVAX. It traded at $18 for 21 days, three weeks, and now its price is already at $27, 50% higher. That's how it all changes in a matter of days. In just 19 days Avalanche is trading much higher and soon you won't be able to get a buy below $50. $18 will seen like an old dream. Gone so long ago but it was available just recently. The same will happen with the current price.
Avalanche is still cheap below $30. The all-time high is $147. We can easily aim for $100 just to see how things will go. We know this level can hit easily so buying below $30 should be an easy decision and choice. That is if you like this pair.
This is another strong project, another bullish chart but always focused on the long-term. If you are looking at it very close, we can have days red but nothing changes. This will not change the bigger path that is being travelled to a new all-time high. So only leveraged traders should be careful when opening a new LONG position because the market can shake the next day. If you trade spot, buy and hold; buy and accumulate with no worries necessary because it is still early.
You can do great in this bull market; we can all do great. More opportunities will continue to develop and the market will continue to heat up.
The next major target for this project mid-term is $64, followed by $96 and then the ATH.
Once we enter the price discovery phase, new all-time high territory, anything goes. The action can continue rising and hit levels hard to imagine, for months, or it can stop just after a few weeks. It all depends on how much money into the market flows.
Namaste.

AVAX/USD Trading IdeaAvalanche is still chilling below this key level. My plan has not changed. Waiting for a retest at around $42-43.
AVAX NEW INCREASE VOLUMEOn the lower time frame, AVAX appears to be building new levels, with a high probability of breaking out soon. We will be following this A-setup coin closely in the coming period
Avalanche bounced back from the support line again ┆ HolderStatBINANCE:AVAXUSDT is bouncing once more from the $22 support, continuing its series of triangle and consolidation-driven rallies. The current rebound could fuel a test of $26.78 resistance. If bulls push through, price momentum may target $30 next, with the overall channel structure favoring higher highs.
AVAX 4H – Holding Trendline, Can Bulls Retest 26?Avalanche continues to hold its ascending trendline while trading around 25.1. The previous local high sits above at 27.5, which remains the main upside target if momentum continues.
Support levels: 23.38 (Fib 0.5), 22.76 (Fib 0.618), 21.88 (Fib 0.786)
Resistance: 25.5–26.0, then 27.5 local high
Stoch RSI: Trending down, hinting at cooling momentum in the short term
As long as the trendline holds, structure remains bullish. A clean break above 25.5–26.0 would confirm continuation toward 27.5, while a breakdown below 23.3 risks deeper retracement into 22s.

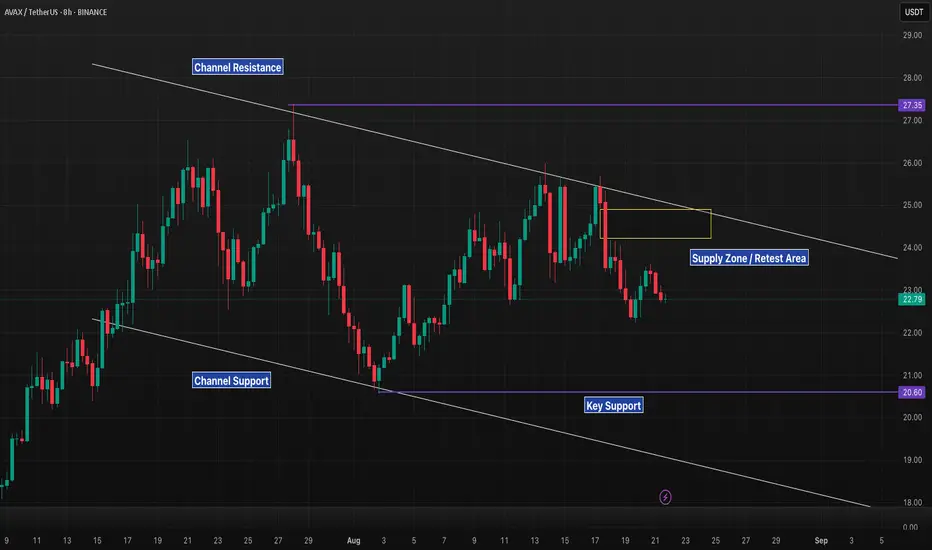
AVAX 8H – Supply Rejection, Watching 20.6 Support Inside ChannelAvalanche continues to trade inside a descending channel, with the most recent bounce failing at the 24–25 supply zone.
Current price action sits mid-channel near 22.8, leaning bearish after rejection.
If weakness persists, the next major downside level to watch is the 20.6 support.
A breakdown below 20.6 could extend toward channel support near the high teens.
Bulls must reclaim the supply zone + channel resistance to flip structure bullish.
This setup matches the broader theme across alts — supply rejections inside downtrend channels, keeping pressure to the downside unless key levels break.
Avax long to $27.5 soonavax long
Aggressive entry
Tp area: $27.35- $27.5 🎯
Sl: 25.39
Caution. I entered without confirmation so drawdown is to be expected but I think overall setup is high probability and stop likely good enough. 1hr internal HL holding. If broken I probably just early exit and wait for confirmation.

AVAX/USDT – Major Breakout on the Daily Timeframe!AVAX has finally broken out from its long-term descending trendline, signaling the potential start of a powerful bullish move. Let’s break down the setup:
🔎 Chart Analysis:
Pattern: Falling Wedge on the Daily timeframe.
Breakout Zone: Price has successfully closed above the resistance trendline around $25–26.
Support Zone: Strong accumulation support around $24–26
🎯 Trade Setup:
Entry Zone: $24–26 (current breakout retest levels)
Targets:
TP1: $35
TP2: $48
TP3: $60+
Stop Loss: $21 (below wedge & accumulation box)
📊 Risk/Reward:
R/R ratio: ~5:1
High conviction setup with breakout confirmation.
⚡ Key Takeaway:
If AVAX holds above the breakout zone, it could deliver a 2x–3x run in this cycle. Watch closely for volume confirmation on daily candles to strengthen the breakout signal.
🔥 Conclusion: AVAX looks primed for a strong bullish rally after months of consolidation. Accumulation zones are done — breakout traders could be rewarded big here!

AVAX Breakout Alert: Eyeing $35–$38 Zone$AVAX/USDT is testing a 200-day accumulation zone. A sustained breakout here could trigger an explosive move, with price potentially running quickly toward the $35–$38 zone.
Add it to your watchlist and keep an eye on a confirmed breakout and close above this level.
DYOR, NFA

AVAX.... calm before the storm AVAX is still within range. As long as price action respects the range, so should we. If the price returns to the bottom of the range, it is the best RR opportunity. However, it is essential to be aware of the maturity of this structure, as market conditions could cause AVAX to breakout.
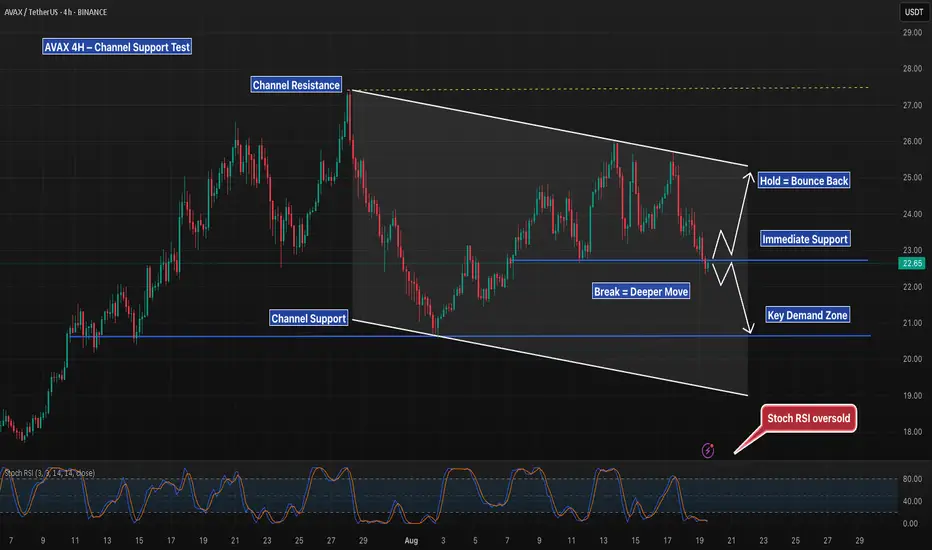
AVAX 4H Channel Support, Bounce or Breakdown?Avalanche is pressing into channel support on the 4H chart after a steady pullback. Current price is sitting at $22.6, a level that has repeatedly acted as near-term demand.
Holding $22.6 could spark a rebound toward $25 resistance.
A breakdown targets the next demand zone at $21, with channel support extending toward $19.
Stoch RSI is oversold, giving bulls a chance to defend — but the reaction here decides whether AVAX bounces or slides deeper into the channel.
AVAX 1H – Supply Tag & Imbalance BelowAVAX ran into resistance at 25.3 after a sharp rally from the liquidity grab/order block around 22.7. Price has started to stall at supply.
Key zones to watch:
Bearish case: rejection at 25.3 could drive price into the imbalance (23.9–23.4) and possibly deeper into supports at 22.76 or 22.23.
Bullish case: a breakout and close above 25.3 would invalidate supply and open higher continuation.
Momentum sits at a decision point: reclaim resistance or fill the imbalance.

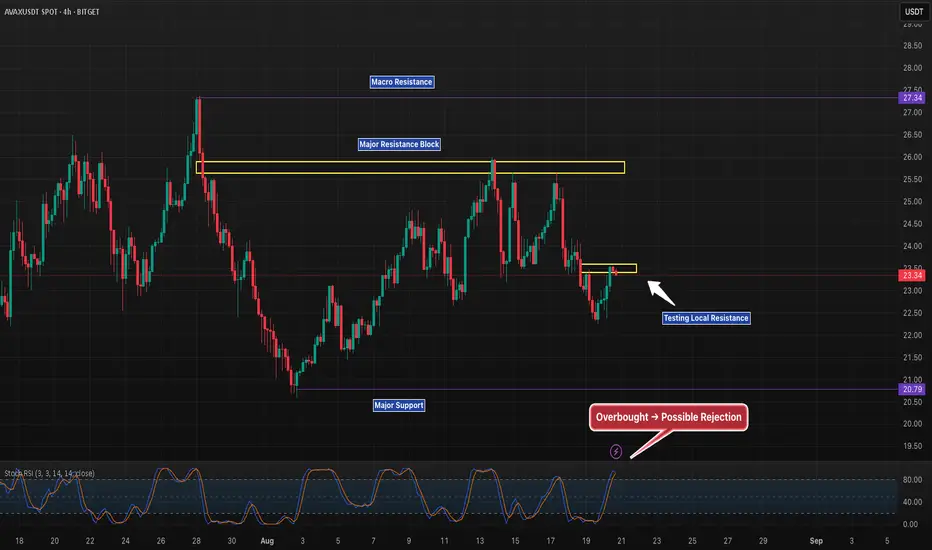
AVAX 4H – Resistance Test Ahead, Breakout or Rejection?valanche is rebounding but now faces stacked resistance levels that will determine its next move. Price is testing the 23.5–24 local resistance, while the bigger wall remains at 25.5–26.
Immediate Resistance: 23.5–24 zone is being tested.
Major Resistance: 25.5–26 remains the key level to flip for upside continuation.
Macro Target: Breakout could send price toward 27.3.
Downside Risk: Failure here reopens 20.8 support.
Momentum: Stoch RSI is in overbought territory, suggesting possible rejection before any breakout.
AVAX is sitting right at the decision line—watching whether bulls can push through or if sellers defend the range.
AVAX General TrendGeneral Trend and Fibonacci Levels
AVAX is currently consolidating around 25 USDT. Based on Fibonacci retracement, the key
resistance levels are: 0.236 level ≈ 40$ 0.382 level ≈ 60$ 0.5 level ≈ 80$ If a breakout occurs, the
first target would be 40$, followed by 60$.
MACD Analysis
The MACD histogram shows positive momentum. The signal line is about to cross upward, which
usually indicates the start of a medium-to-long term bullish trend. In the previous similar setup, the
price had a strong rally. The current pattern is developing in the same direction.
Ichimoku and Supertrend
The price is still below the Ichimoku cloud, meaning the trend reversal is not fully confirmed yet. The
Supertrend indicator is close to switching from red to green. Weekly closes above 28–30$ could
generate a buy signal.
Volume Analysis
Recent bullish attempts were supported by increasing volume, which indicates growing buyer
interest. The 20–22$ zone acts as a strong support. As long as this support holds, the bullish
scenario remains valid.
Bullish senario Breakout from 25$ → 30$ zone first target 40 main target 60$
Bearisj senario Weekly close below 22$ 18–15$ zone may come into play

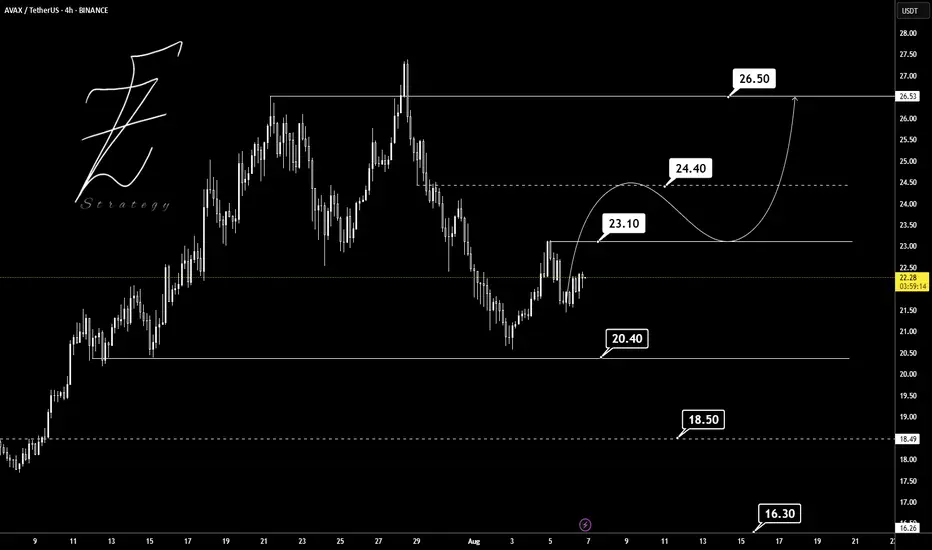
AVAXUSDT The overall trend of BINANCE:AVAXUSDT on the 4H timeframe shows signs of a potential bullish reversal, as a higher low has formed around the 20.40 support level after a strong downtrend. Currently, the price is ranging between the key support at 20.40 and the resistance at 23.10. A breakout above 23.10 could push the price toward the next major resistance at 24.40, which is a critical decision zone for the market. If buyers maintain momentum and break above 24.40, the next bullish target will be around 26.50 ✅ However, if the 20.40 support fails to hold, lower supports at 18.50 and 16.30 may come into play. The momentum currently leans slightly bullish, but price behavior between 23.10 and 24.40 will determine the next strong move. 📊
Key Support & Resistance Levels:
Supports: 20.40 – 18.50 – 16.30
Resistances: 23.10 – 24.40 – 26.50
Always remember to manage and control your risk properly. 🔒
AVAX : Low price and high potentialHello friends
Due to the decline we had, the price of this currency has decreased significantly and has reached good support areas, and the specified areas can be considered good support areas.
If it breaks through the support areas, the price can move to the specified targets.
*Trade safely with us*
AVAX/USD Trading IdeaI have been watching its structure for 3 months, aiming for the $42-$48 range. First, we need a breakout through the mid range at $26-$27, a massive resistance holding us back. Could this setup fail? Absolutely. DYOR

AVAX 1D – Breakout Watch Toward Major Trendline ResistanceAVAX is pressing against the $26 range high while riding a strong ascending support from the July low. A confirmed breakout could open room toward the $36 mid-range target, with the $44 major trendline resistance as the next key level. Above that, the March 2024 high near $65.50 remains the longer-term upside target. Failure to break $26 cleanly may lead to another pullback toward ascending support around $22. Trend remains bullish while above this trendline, with momentum building for a possible higher-timeframe breakout.

AVAXUSDT ( You think it’s out of mind , But you have to believe Hello dear traders.
Good days.
First of all thanks for your support and comments.
————————————————————————
Sometimes numbers are enormous and fist think which come in your mind is , oh my god it’s crazy . You could not believe crypto market will grow up this much ever .
But it’s real and you have to believe it .
AVAXUSDT on weekly Gann square could hold price above 0.5 Gann price zone which is a great signal for future .
End of Daily bearish Gann Square box exactly matched with weekly Gann reversal time zone and as you can see on longe term price form and wedge and collect spring for breaking up and experience new ATH .
Hope to analysis be helpful for you .
Good luck and safe trades.

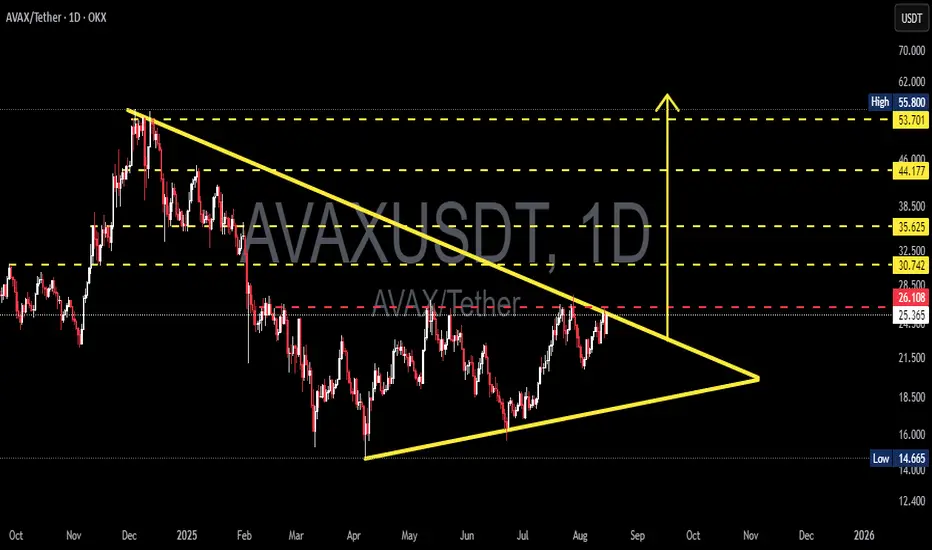
AVAX/USDT — Symmetrical Triangle Approaching Breakout?Overview:
The daily chart shows AVAX forming a symmetrical triangle (converging trendlines) since the Dec–Jan peak. Price is now testing the upper resistance trendline (~26.1 USDT) — we’re at a critical point heading toward the apex (late September). Volume behavior and a confirmed daily candle close will be key to determining the breakout direction.
---
1) Pattern Description
Pattern: Symmetrical Triangle — characterized by lower highs (descending resistance line from the peak) and higher lows (ascending support line from the April bottom). Price range is narrowing → volatility dropping → usually leads to a strong move when the pattern resolves.
Context: The broader trend before the triangle was bearish (drop from ~55.8). Symmetrical triangles can be neutral but often resolve in the direction of the prior trend — technical confirmation is essential.
---
2) Key Levels (from chart)
Upper resistance trendline / critical level: ~26.10 USDT (red dashed line), current price ≈ 25.3 USDT.
Major resistance targets: 30.74, 35.62, 44.18, 53.70 – 55.80.
Ascending support trendline: around 18–22 USDT depending on timing.
Structural low: 14.665 USDT (chart low).
(Values estimated visually from chart — verify with live data before trading.)
---
3) Bullish Scenario (if breakout upward)
Bullish Trigger
Daily close above descending trendline (~26.1) with strong volume → breakout confirmation.
Preferably supported by bullish technical indicators (RSI, MACD bullish crossover, rising OBV).
Targets
Step targets: 30.7 → 35.6 → 44.2 → 53.7 (partial profit-taking recommended).
Measured move theoretical target:
− Height ≈ 55.800 − 14.665 = 41.135.
− Added to breakout point (~26.108) → theoretical target ≈ 67.24 USDT (for reference, not guaranteed).
Risk Management
Stop-loss: daily close back below breakout trendline or under nearest swing low (e.g., conservative SL < 21–22 USDT).
Strategy: scale in — partial entry before breakout, add after confirmation. Monitor risk/reward closely.
---
4) Bearish Scenario (if rejected / breakdown)
Bearish Trigger
Rejection at upper trendline + bearish daily candle (and/or rising sell volume) → drop to ascending support.
Breakdown confirmation: daily close below ascending trendline with strong volume.
Targets
Initial drop to ascending support ~18–22 USDT.
If breakdown continues → possible retest of 14.66 USDT low.
Risk Management for Shorts / Cut-loss
SL for shorts: daily close above resistance (~>28 USDT) or above fake breakout highs.
Beware of bull traps — volume confirmation reduces risk.
---
5) Practical Trade Plans (example)
Conservative Long: Wait for daily close > 26.1 + strong volume → enter 50% position; add after retest. Targets: 30.7 / 35.6. SL under retest zone (~21–22).
Conservative Short: If clear rejection at upper trendline → short toward lower trendline. SL above recent high (~28).
Range Trading: Buy near lower trendline, sell near upper trendline until breakout confirmed.
---
6) Risk & Confluence Checks
Broader market/Bitcoin sentiment: AVAX is often correlated, which can amplify moves.
Supporting indicators: check volume, RSI, MACD, EMA(50/200) for confirmation.
Watch for false breakouts — confirm with volume + retests.
---
7) Summary
> AVAX is forming a Symmetrical Triangle. Critical resistance at ~26.1 USDT — daily close + volume will decide the next move. Valid breakout → step targets at 30.7 / 35.6 / 44.2 (measured move theoretical ~67.2). Rejection / breakdown → support at 18–22 and possible drop to 14.66. Manage risk with confirmation, stop-loss, and partial profit-taking.
#AVAX #AVAXUSDT #Crypto #TechnicalAnalysis #Triangle #Breakout #SupportResistance #Altcoin #SwingTrading
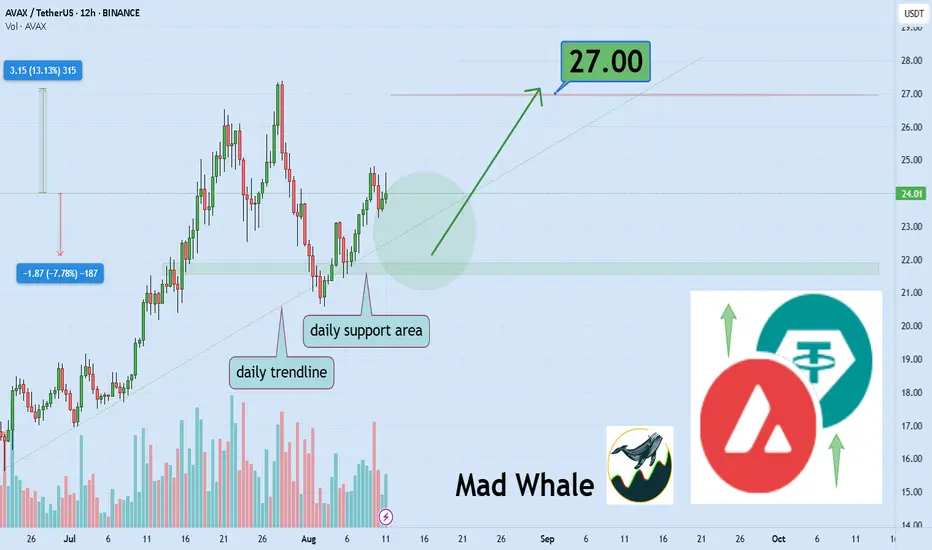
AVAX Technical Setup Signals 13% Upside Target $27Hello✌️
Let’s analyze Avalanche’s price action both technically and fundamentally 📈.
🔍Fundamental analysis:
Avalanche’s July Octane upgrade cut C-Chain fees by 98% and boosted daily transactions 170% to 10.1M. New subnets, like FIFA NFTs and VanEck’s $100M RWA fund, could lift AVAX demand. 🚀
📊Technical analysis:
BINANCE:AVAXUSDT is holding a strong daily support and a key monthly trendline 📊. If these levels hold, a 13% upside toward $27 looks likely 🚀.
✨We put love into every post!
Your support inspires us 💛 Drop a comment we’d love to hear from you! Thanks, Mad Whale
AVAXUSDT 1D#AVAX is moving inside a symmetrical triangle on the daily chart. It has already broken above the daily EMA200 and is now on the verge of breaking out above the triangle resistance. If the breakout is confirmed, the potential targets are:
🎯 $29.76
🎯 $34.43
🎯 $39.10
🎯 $45.74
⚠️ As always, use a tight stop-loss and apply proper risk management.
