AVAX/USDT#AVAX Spot Strategy 🚀
AVAX is currently at a solid buy zone for spot entries.
The coin is in the top 15 by market cap, which adds fundamental strength.
💡 Recommended DCA approach:
Split your planned allocation into 3 entries — market volatility and manipulations remain high, especially lately.
• Entry 1 — at current price
• Entry 2 — around $15
• Entry 3 — if price drops to the $7–4 zone
This gives an average entry of ~$15, creating strong upside potential.
🎯 Targets:
• Target 1 = $35 (+50% from current levels)
• Target 2 = $45 (+90%)
• Target 3 = $55 (+135%)
📌 Key resistance zone: $30–35
Once reached, we’ll monitor price action + seasonal market behavior.
If momentum supports it, additional entries could be considered in that area.
AVAXUST trade ideas

$AVAX Update – Breakout Retest Play!!CRYPTOCAP:AVAX is respecting the ascending trendline beautifully after a clean retest of the breakout zone.
The price is holding above the trendline, and the 200 EMA is in the 4H timeframe.
Multiple confluences align around the $22.5–$23 zone – a critical support area now flipped from resistance.
Targets are set at:
• 26.81
• 29.47
• 33.40
As long as we hold this support, the upside potential remains strong.

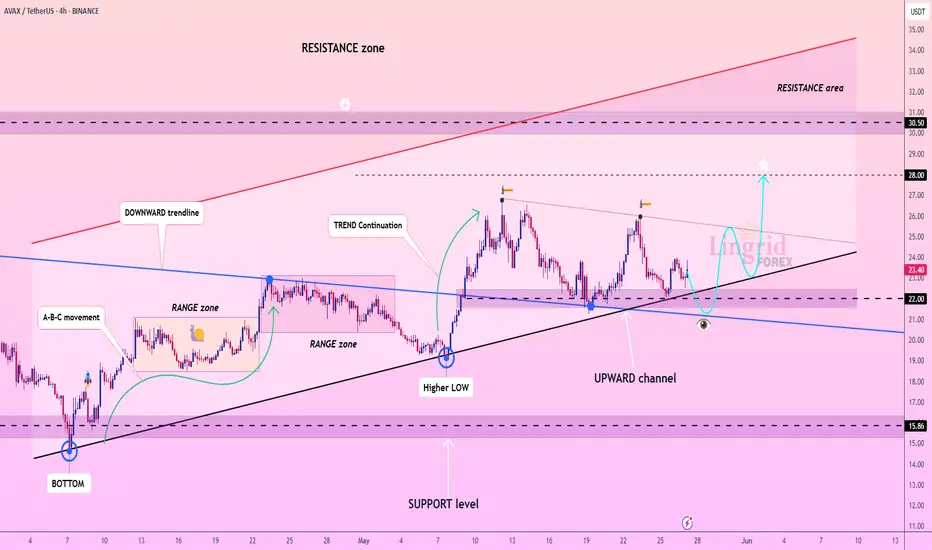
Lingrid | AVAXUSDT Compression Phase Before Upside BreakoutBINANCE:AVAXUSDT is retracing from local highs but remains inside the broader upward channel. Price is nearing the $22.00 support zone, which aligns with the uptrend line and a potential higher low area. If bulls defend this zone and trigger a bounce, we could see a continuation toward $28.00 and possibly higher into the resistance area. However, a breakdown below $22 would shift near-term structure bearish.
📈 Key Levels
Buy zone: $21.50 – $22.00
Buy trigger: bullish rejection from $22.00 with volume
Target: $28.00
Sell trigger: clean break below $21.50
💡 Risks
Crypto market sentiment remains fragile amid macro uncertainties
Failed bounce from $22 could initiate deeper correction
Loss of trendline support would invalidate bullish setup
Traders, if you liked this idea or if you have your own opinion about it, write in the comments. I will be glad 👩💻
TradeCityPro | AVAX: Watching Key Resistance in RWA Uptrend👋 Welcome to TradeCity Pro!
In this analysis, I’ll be reviewing the AVAX coin — one of the popular RWA projects in crypto with a high market cap.
🔍 This coin currently has a market cap of $9.94 billion and ranks 14th on CoinMarketCap.
⏳ 4-Hour Timeframe
As shown on the 4-hour chart, there’s a clear ascending trendline that has been tested several times. There was also a fake breakout below the trendline, and now price is reacting to it once again.
⚡️ A resistance level has formed at 23.90, which the price has reacted to. Given the recent bounce off the trendline, the probability of breaking 23.90 has increased.
✔️ A break above 23.90 offers a potential long entry, though this isn’t the main long trigger. The target for this move would be 25.78. The main long position should be considered after a breakout above 25.78.
💥 The 25.78 zone is a key resistance level that marked the top of previous bullish legs, so breaking it could lead to a strong bullish trend.
🔽 On the flip side, if the price prints a lower high below 25.78 and moves back toward the trendline, the probability of breaking the trendline increases.
✨ If the trendline breaks, the confirmation trigger would be 22.10. A break below 22.10 opens a short setup, with the next support level located at 19.23.
📊 Currently, market volume is favoring the buyers. With renewed buying volume off the trendline, if this momentum continues, the bullish scenario becomes more likely.
📝 Final Thoughts
This analysis reflects our opinions and is not financial advice.
Share your thoughts in the comments, and don’t forget to share this analysis with your friends! ❤️

AVAX - Daily Chart 🧠 Market Structure:
✅ Uptrend recovery in progress from March 2025 lows.
🟢 Break of Structure (BOS) confirmed in mid-April and early May, showing strength and higher highs.
🔄 Change of Character (CHoCH) detected multiple times — a sign of previous uncertainty now leaning bullish.
❌ Still below key supply zone (~$26–$30), facing resistance.
🔍 Zones to Watch:
Resistance Zone $26.00 – $30.00 Strong supply; price rejection possible
Local Support $20.50 – $21.00 Minor demand block formed after recent BOS
Major Support $14.66 (Weak Low) Important level to hold in case of a breakdown
📈 Momentum & Indicators:
Stochastic RSI: Near overbought, turning down. Potential short-term consolidation or retracement.
MACD (not visible but inferred): Likely still bullish from April breakout.
Volume: Tapering off slightly after recent push—needs stronger conviction to break above $25–26.
🧭 Trade Insights:
Bullish Case:
Holding above $21–22 is key for maintaining bullish market structure.
Close above $25.50–26.00 could initiate rally toward $30+, possibly testing prior highs.
Bearish Case:
Failure to hold $21.00 = potential return to deeper support around $18 or even $14.66 (major demand).
Watch for bearish divergence or breakdown signals near supply zone.
🟡 Current Sentiment:
AVAX is in a consolidation phase after a bullish breakout in April–May. Momentum is slightly fading short-term, but structure remains bullish unless $21 is lost. A clean breakout above $26 will likely attract buyers again.
----
Other Low Market Cap #RWA #RealEstate #Tokenization Platforms by FDV
SQRB $100K on PROBIT
$RNB $310K
$HTS $1.9M
$STBU $3.5M
LAND $3.6M
-----
Not for recommendations to BUY SELL any stocks, cryptos, FX or securities
Not for Financial Advise
DYOR

AVAXUSDT 📊 BINANCE:AVAXUSDT Chart Analysis
AVAX price, after breaking the key resistance at 22.20, is showing a strong upward move 📈 toward the next resistance at the end of the second leg at 30.00 USD. The 22.00 level could act as a pullback and provide strong support 🔄. If it consolidates above 30.00, the uptrend may continue to 37.00 🚀.
Support and Resistance Levels:
Supports:
• 22.20 🛡️
• 20.00 🛡️
• 17.50 🛡️
Resistances :
• 30.00 🚧
• 37.00 🚧

Avalance (AVAX): Seeing Good Market Structure DevelopmentAvalanche coin is retesting the broken neckline zone, where we are going to start looking for a good downward movement to happen soon.
We are aiming at the 200EMA line, where we might fill a few FVGs on a smaller timeframe and also the area at the neckline zone (so we can say the whole zone between those zones).
We are monitoring for any signs of weakness and most probably will be starting the DCA-ing with small sizes in this position soon!
Swallow Academy

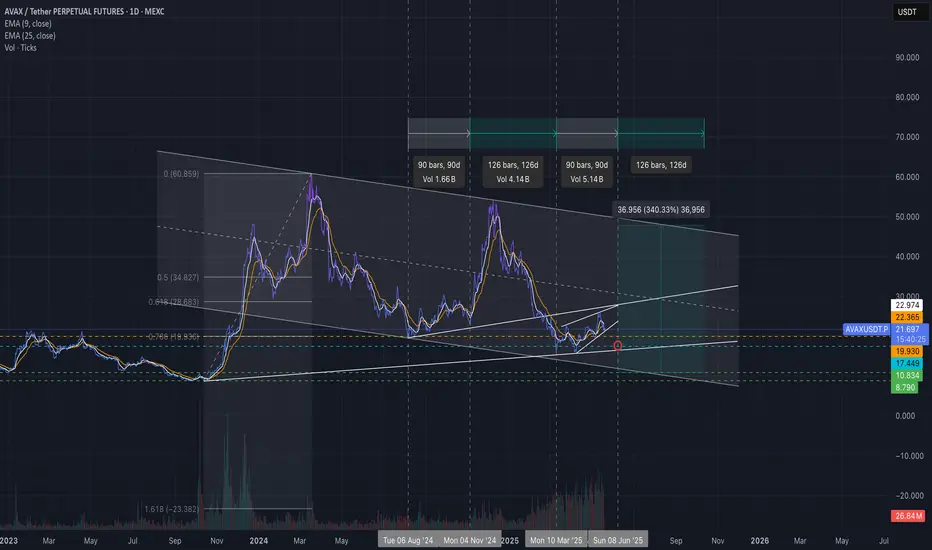
AVAX Weekly Outlook – A Potential 558% Move Ahead?CRYPTOCAP:AVAX is coiling inside a massive multi-year symmetrical triangle on the weekly chart. This is a textbook structure where volatility contracts before an explosive move, and the setup looks nearly complete!
🔹 Entry Zone: Highlighted accumulation zone around CMP- $17
🔹 Breakout Target: If AVAX breaks out, we could see a move toward $147 (a whopping +550%)
🔹 Resistance to Watch: $45-$50 range – historical supply zone
🔹 Support: The Ascending trendline from 2021 continues to act as a strong base
Fundamentals Behind the Chart:
Avalanche (AVAX) is one of the fastest smart contract platforms in terms of time-to-finality. It supports Subnets (custom blockchains), which are gaining traction for scalable enterprise and gaming solutions. With growing DeFi and NFT adoption on Avalanche, fundamentals are aligning with this technical setup.
If this breakout holds, AVAX might become one of the best large-cap performers in the next cycle.

AVAXUSDT 1D AnalysisAVAX ~ 1D Analysis
#AVAX Buy gradually from here if you still have confidence in this coin with a short term target of at least 10%+ from here.
Avalanche (AVAX): Another Fake-out Above 200EMA / Sign of DropAvalanche has formed another fake-out above the 200EMA, where sellers took over the zone and now the price is declining, forming a possible BOS.
With markets showing weakness overall, we can expect the target area for this coin to be $14.60 so eyes there! As long as sellers dominate over the 200EMA, we are good for a drop here!
Swallow Academy

#AVAXUSDTEverything you need is visible on the chart
Red resistance band and next red resistance lines
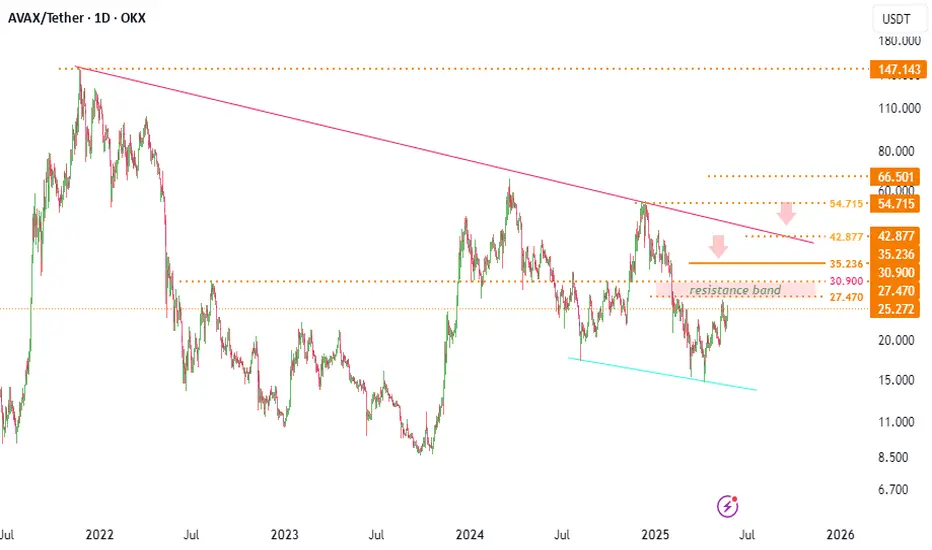
The key is whether it can find support at 24.59 and rise
Hello, traders.
If you "Follow", you can always get new information quickly.
Have a nice day today.
-------------------------------------
(AVAXUSDT 1M chart)
The key is whether the price can be maintained by rising above the M-Signal indicator on the 1M chart.
Accordingly, we need to see whether the price can be maintained by rising above 27.47.
-
(1W chart)
The important support and resistance range is the 38.93-51.54 range.
Therefore, even if the price is maintained by rising above the M-Signal indicator on the 1M chart, the uptrend can begin only if it rises above the 38.93-51.54 range.
If it falls, we need to see whether it can be supported near the volume profile range of 6.54-13.47.
-
(1D chart)
When it breaks upward around 28.67, it is expected that a breakout trade will be possible.
However, since an important support and resistance section is formed over the 38.93-51.54 section, a response is needed depending on whether there is support in this section.
Therefore, the key is whether it can be supported and rise around 24.59.
If not, it is necessary to check whether it is supported around 17.54-19.79.
-
The basic trading strategy is to buy when supported by the HA-Low indicator and sell when it meets the HA-High indicator.
However, if it is supported and rises near the HA-High indicator, it is likely to show a stepwise upward trend.
On the other hand, if it is resisted and falls near the HA-Low indicator, it is likely to show a stepwise downward trend.
Therefore, since it is currently located near the HA-High indicator, it can be seen that trading is possible depending on whether there is support.
However, since the probability of falling is higher than the probability of rising in the HA-High indicator, you should be careful about the investment ratio.
Otherwise, you may end up buying at the high point.
-
Thank you for reading to the end.
I hope you have a successful trade.
--------------------------------------------------
- Here is an explanation of the big picture.
(3-year bull market, 1-year bear market pattern)
(3-year bull market, 1-year bear market pattern)
I will explain the details again when the bear market starts.
------------------------------------------------------

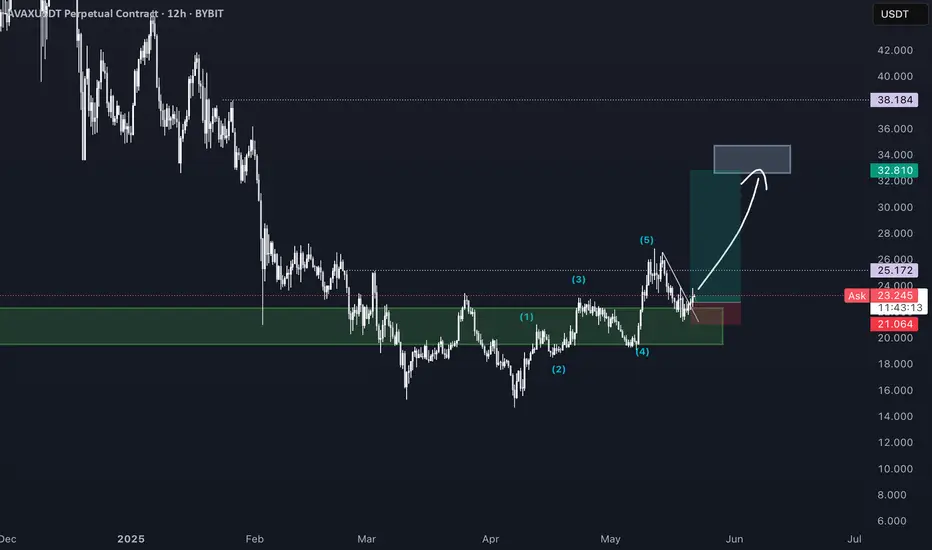
AVAX Is My The Most Confident Investment!Hello, Skyrexians!
It's time to update my previous BINANCE:AVAXUSDT analysis because when I told that correction is over as usual I have a lot of haters in comments. They told me how you can bet for one altcoin growth and other's dump - easy!
This crypto has the clearest structure for me. Wave 1 was very impulsive and after that we have seen almost flat correction. Wave B finished slightly below wave's 1 top, wave C slightly below wave's A bottom. Divergence on Awesome oscillator and momentum growth is showing that correction is over and the next target is 1.61 Fibonacci above $100 in wave 3.
Best regards,
Ivan Skyrexio
___________________________________________________________
Please, boost this article and subscribe our page if you like analysis!

AVAX Cup & Handle formingLooking at macro price action for AVAX, have noticed a potential cup & Handle forming.
Using time fibs, projecting where price will reach to complete the cup and then retrace for the handle. Projection has top of cup around 8-9 June with correction ending around 23June.

Avalanche (AVAX): Seeing Bullish Trend | Possible 30% MovementAvalanche has formed the bullish channel here, where we are at the lower side of that channel, which might be the bounce zone for us. We are keeping a close eye on this zone and as soon as we see some signs of recovery near this region, we will be looking for bullish movement, which could give us a good 30% movement.
Swallow Academy

AVAX/USDT Potential UpsidesHey Traders, in today's trading session we are monitoring AVAX/USDT for a buying opportunity around 21.00 zone, AVAX/USDT is trading in an uptrend and currently is in a correction phase in which it is approaching the trend at 21.00 support and resistance area.
Trade safe, Joe.

AVAXAVAX looks promising but still not clear green light for long position, Ideally we need a gentle retouch of the support and only after that we can show some good move. However we must to keep eye on BTC and scenario might go a bit earlier.
Another way we can see the retest of the lowest support levels in case BTC will dive in the deep correction after retouch ATH. So, anyway for now there is no clear entry but within a week or two we can back to this chart and I hope we will see the AVAX more clear then now.
NFA - DYOR
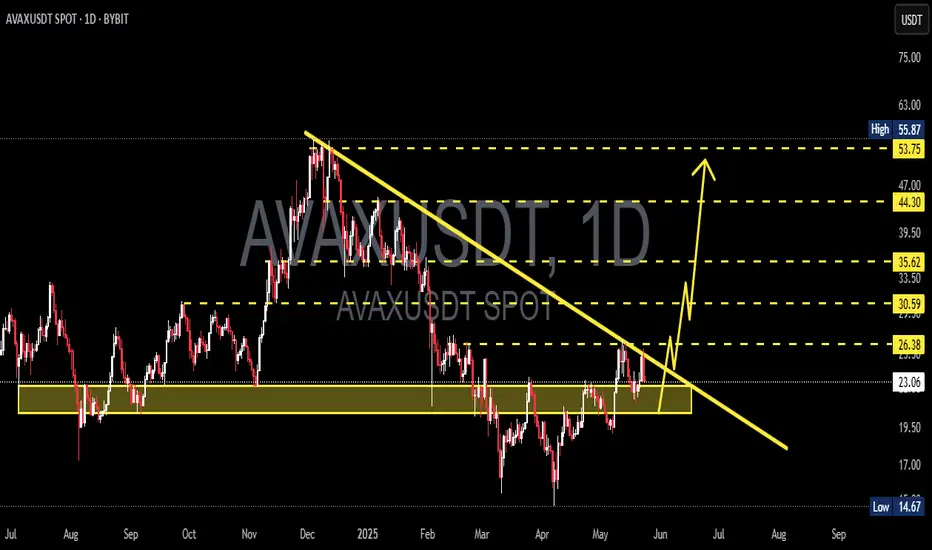
AVAX 100% gain is around the corner !Hello Traders 🐺
I hope you're doing well. I was a little bit sick, so I couldn't update you over the past few days — but now I'm back, stronger than ever 💪
As you might know, we're still at the beginning of a massive altcoin season, so let's dive into the chart 📊
As you can see, after my last idea about AVAX, the price broke above a descending channel — just as we discussed — and now it's holding above one of the key daily resistance levels, currently retesting it as new support.
In my opinion, we could see another leg up if the price breaks above the previous high around $27 🚀

Avax Buy IdeaTo a Classical Chart trader this has flash a buy signal.
I add candlestick to my trading plan, so, today candle closing will finish the whole story for me.

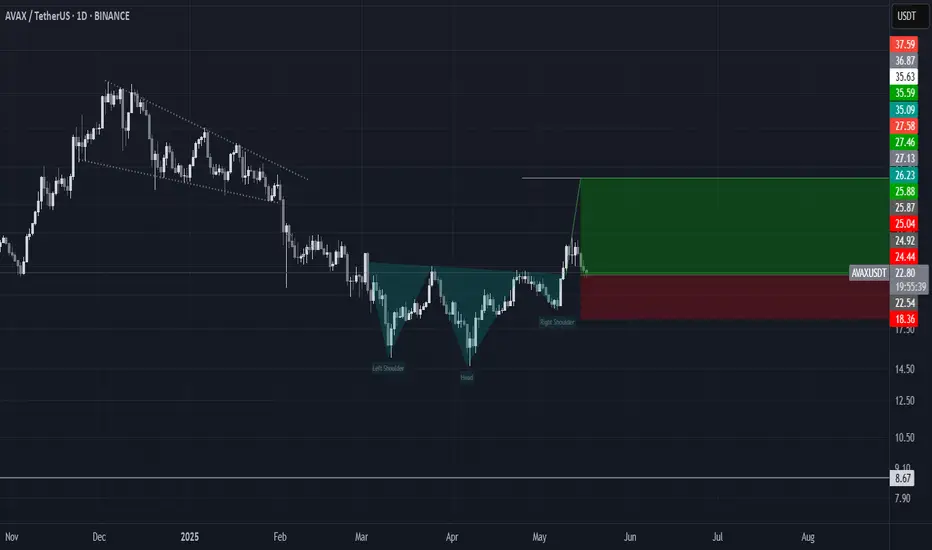
AVAX H&SAvalanche (AVAX) is displaying a classic head and shoulders pattern on its daily chart. After breaking out above the neckline at $23.46, AVAX has shown strong momentum, and a decisive push and hold above $27 would validate the reversal and open the path to the next major resistance zone between $35 and $36. This zone aligns with the technical price target derived from the pattern’s height, making $35.4 a realistic objective if bullish momentum persists and volume supports the breakout. The right shoulder in a head and shoulders pattern provides a logical reference for risk management at $18.4.
This information is for educational and informational purposes only and does not constitute financial advice. Always do your own research and consult with a qualified financial professional before making any investment decisions.
AVAX Potential UpsidesAVAX/USDT is currently trading within a broader uptrend and is in a corrective phase. The price is approaching the 24.60 level, a key support and resistance area that aligns with the prevailing trend structure. This zone may offer insight into potential market reaction and the strength of the ongoing trend.

AVAX BREAKS RANGEAVAX has officially broken out of its multi-month range between approximately $15 and $24, and is now retesting the former range high as support - a textbook bullish move. The breakout candle showed strong momentum, followed by a healthy consolidation and a successful retest of the previous resistance zone, which has now flipped to support.
Price is comfortably trading above the 50-day moving average, which is beginning to curve upward - a sign of growing strength. The next significant obstacle is the 200-day moving average, currently sitting above the price around the $29–$30 zone. That area also lines up with previous price structure and is likely to act as the next resistance level.
Volume on the breakout was elevated, which adds credibility to the move. As long as price holds above the top of the prior range ($24), the breakout remains intact. A move toward the 200 MA looks likely if the broader market holds up.
In short: AVAX is showing strength, leaving behind a well-defined accumulation range and forming the early stages of a bullish trend structure.
