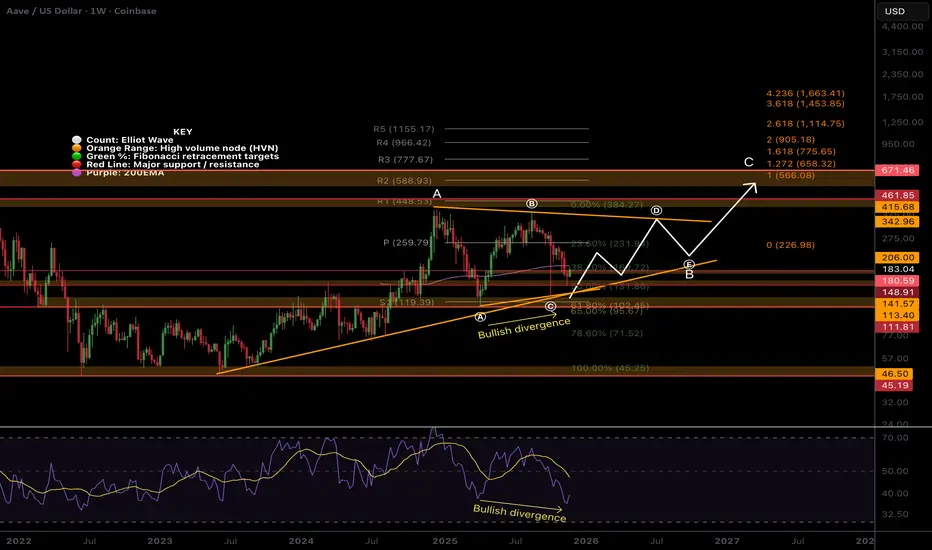
AAVE Macro outlook, weekly bullish divergenceA price range between $440 and $130 continues. Price appears to have completed triangle wave (c) of a larger wave B. Wave (D) is next, with a target of the upper boundary trend-line ~$340.
Price has lost the 200EMA but followed the outlined path of a pump and pullback after wave ©. The weekly pivot
Key stats
Related pairs
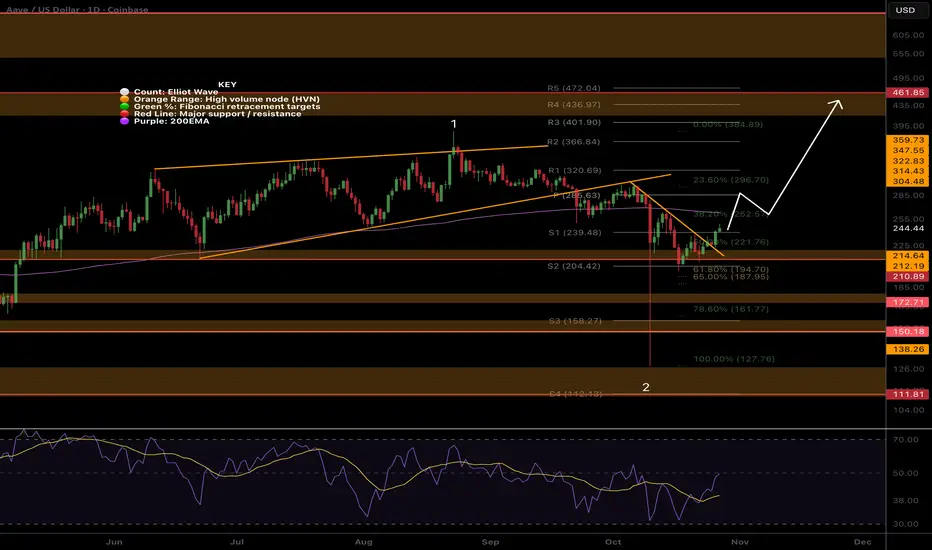
AAVE Local, bottoming soon?Locally, price continues bearish after falling out of the wedge, completing wave (B) of the macro triangle. Price action looks ready to reverse
Wave © appears complete after the big drop, black swan event- Oct 10th. I was looking for a dip back into the long lower wick, which we have and price is f

AAVE local analysis updated, Bear trend continueEURONEXT:AAVE Locally, price continues bearish after falling out of the wedge, completing wave 1. Until the price gets above the orange descending trend-line, the probability is downside continuation.
Wave 2 appears complete after the big drop, black swan event. I was looking for a dip back into t

AAVE Bullish structure from supportEURONEXT:AAVE has printed bullish structure from support but the daily 200EMA looms ahead, once cracked AAVe should move well. Price tested the golden pocket Fibonacci retracement.
AAVE did not pullback as much as most alt-coins and is expected to be one of the first to break into all time high /
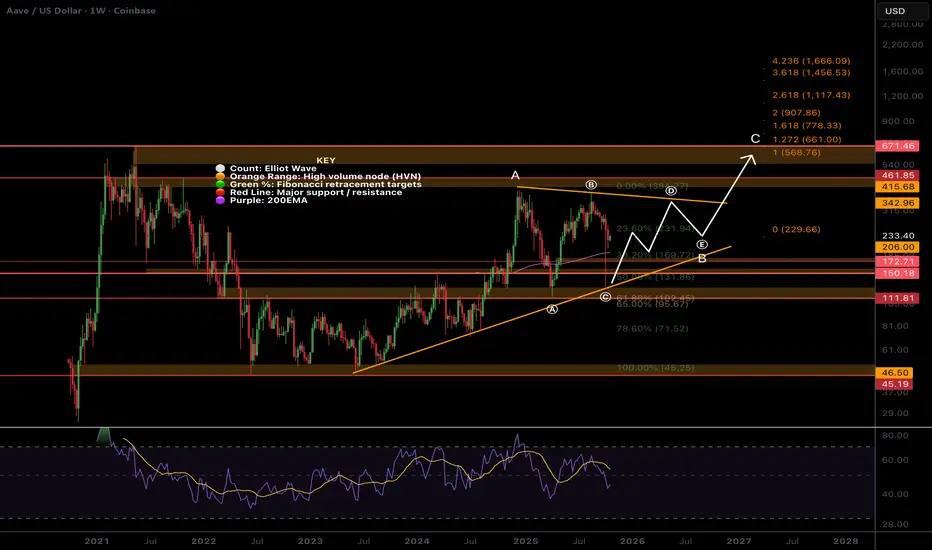
AAVE Macro changed... Another huge triangle?EURONEXT:AAVE macro has changed with the recent price action. We appear to printing a multi-year macro triangle in wave B, with wave (C) now complete on last weeks wipeout.
Price touched the S1 pivot and High Volume Node support just above the golden pocket.
Weekly RSi still has room to fall with
AAVE local whats next? Total alt-coin leverage wipeout!What a mess Friday turned out to be with a recording breaking liquidation event with the numbers still growing - bigger than FTX!
SUNK COST FALLACY: THE DAMAGE IS DONE, DO NOT PANIC IN AND OUT OF POSITIONS.
So many alt-coins proved there is nothing but thin air holding them up - no real demand wh

AAVEUSD #bullishSince reaching its lowest point in June 2022, AAVE has shown a consistent pattern of accumulation and range-bound trading, fluctuating between $107 and $48. This behavior indicates a strong setup for an upward trend.
Reasons for a Bullish Outlook:
The Relative Strength Index (RSI) on a weekly basis

STABLECOIN SUPERCYCLE CAN SEND AAVE TO $5,000We have a #HVF forming that is yet to breakout.
The fundamental driver is of course stablecoin growth. Namely the ones that the United States allow to dominate in this space. Permissioned quasi CBDC's like USDT and USDC.
So what is AAVE if you don't know;
Aave (AAVE) is a decentralized finance (

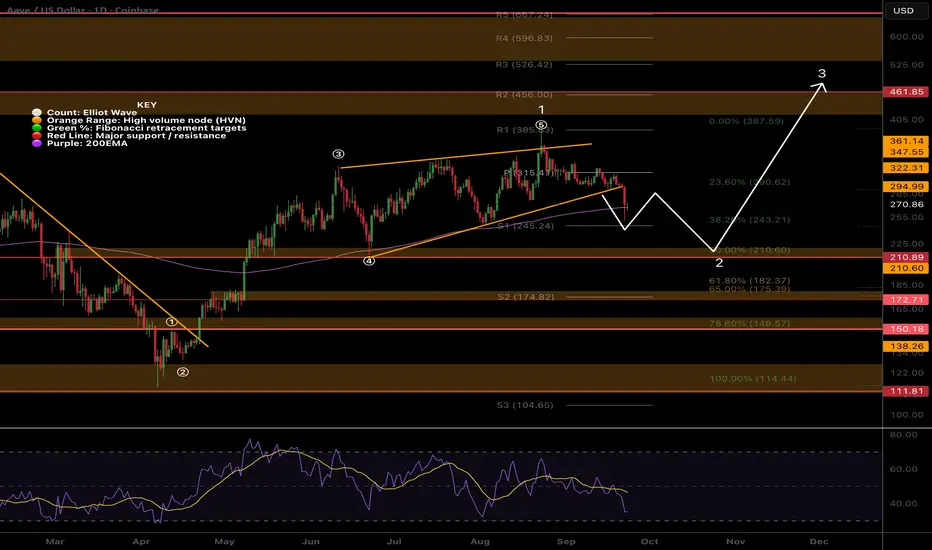
AAVE Breakdown from wave 5 wedge. Whats next?Local Analysis / Targets / Elliot Wave
CRYPTOCAP:AAVE broke down out of the wave (5) of 1 wedge per my previous analysis reaching the paths first target to find support the daily 200EMA and S1 pivot point. If price continues lower I expect it to bounce first before delivering a final thrust down
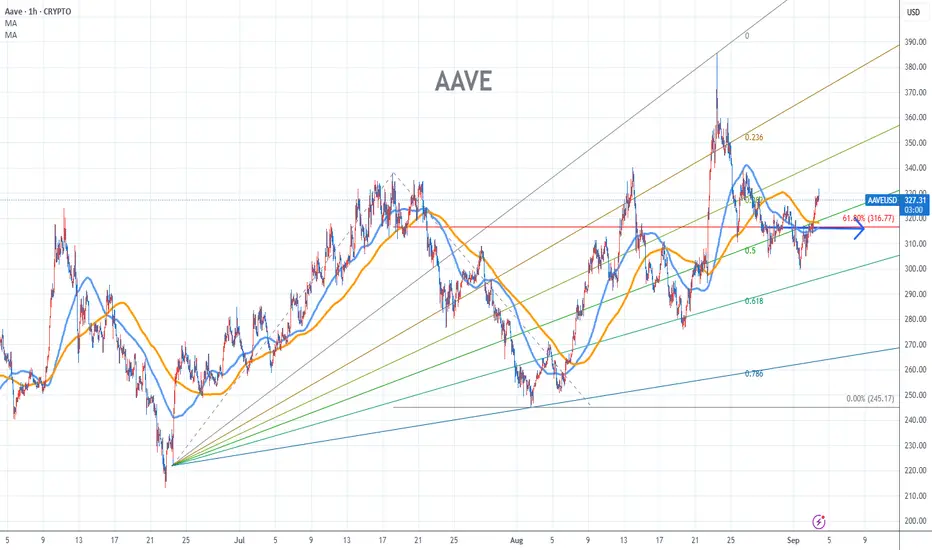
AAVE Stock Chart Fibonacci Analysis 090325Trading Idea
1) Find a FIBO slingshot
2) Check FIBO 61.80% level
3) Entry Point > 316/61.80%
Chart time frame:B
A) 15 min(1W-3M)
B) 1 hr(3M-6M)
C) 4 hr(6M-1year)
D) 1 day(1-3years)
Stock progress:A
A) Keep rising over 61.80% resistance
B) 61.80% resistance
C) 61.80% support
D) Hit the bottom
E)
See all ideas
Displays a symbol's price movements over previous years to identify recurring trends.
Curated watchlists where AVEUSD is featured.

DeFi Tokens: Finance 2.0
24 No. of Symbols

ETH-based crypto: Find your utility
38 No. of Symbols

Gen 3 crypto: A new day dawns…
25 No. of Symbols

Top altcoins: Choose your alternatives carefully
28 No. of Symbols
See all sparks
Frequently Asked Questions
Aave vs US Dollar (AVE) reached its highest price on May 19, 2021 — it amounted to 642.81 USD. Find more insights on the AVE price chart.
See the list of crypto gainers and choose what best fits your strategy.
See the list of crypto gainers and choose what best fits your strategy.
Aave vs US Dollar (AVE) reached the lowest price of 45.50 USD on Jun 18, 2022. View more Aave vs US Dollar dynamics on the price chart.
See the list of crypto losers to find unexpected opportunities.
See the list of crypto losers to find unexpected opportunities.
The safest choice when buying AVE is to go to a well-known crypto exchange. Some of the popular names are Binance, Coinbase, Kraken. But you'll have to find a reliable broker and create an account first. You can trade AVE right from TradingView charts — just choose a broker and connect to your account.
You can discuss Aave vs US Dollar (AVE) with other users in our public chats, Minds or in the comments to Ideas.