AXL/USDT – Falling Wedge Breakout! Time to Ride the Wave!!🚀 AXL Breakout Alert – 100% Potential Incoming?! 👀🔥
Hey Traders! If you're all about high-conviction plays and real alpha, smash that 👍 and tap Follow for more setups that actually deliver! 💹💯
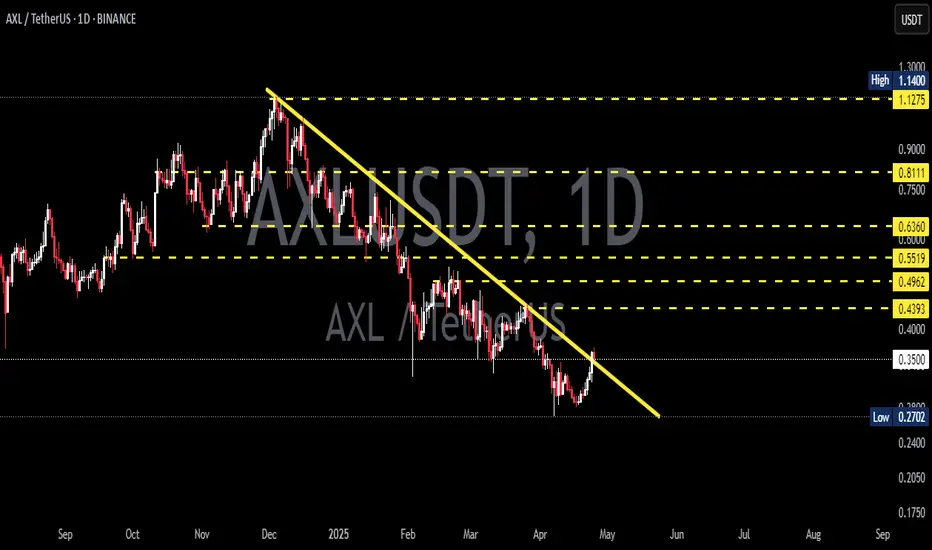
AXL has broken out of its long-term falling wedge pattern on the daily timeframe—this is a strong reversa

AXLUSDT UPDATE
AXL/USDT Technical Setup
Pattern: Falling Wedge Breakout
Current Price: \$0.3837
Target Price: \$0.73
Target % Gain: 95.47%
Technical Analysis: AXL has broken out of a falling wedge on the 2D chart with a strong bullish candle and 11.48% daily gain. Volume is rising, confirming the breakout wi

AXLUSDT 1D#AXL has broken above the falling wedge resistance and the MA50 on the daily chart. If it manages to keep the price above the MA50, the targets are:
🎯 $0.4209
🎯 $0.4755
🎯 $0.5431
🎯 $0.6025
🎯 $0.7051
⚠️ Use a tight stop-loss.

AXLUSDT 1D AnalysisAXL ~ 1D Analysis
#AXL Managed to penetrate this resistant line and is currently trying to maintain it. As long as the price is above this S/R line, bullish can still encourage prices.
Trading opportunity for AXLUSDT AxelarBased on technical factors there is a Buy position in :
📊 AXLUSDT
🔵 Buy Now or by Breakout
🪫Stop loss 0.3600
🔋Target 0.4950
📏 R/R 2,5
💸RISK : 1%
We hope it is profitable for you ❤️
Please support our activity with your likes👍 and comments📝

Massive pump incomingWaiting for breakout here , giga bullish 🔥 , symetrical triangle
goodluck , dyor 🔥

#AXL/USDT#AXL
The price is moving within a descending channel on the 1-hour frame, adhering well to it, and is heading for a strong breakout and retest.
We are experiencing a rebound from the lower boundary of the descending channel, which is support at 0.3360.
We are experiencing a downtrend on the RSI in

AXLUSDT 1DAXL ~ 1D Analysis
#AXL High risk trading, Buy after successfully penetrating this resistant line or buy after successfully testing this support block. with a short -term target of at least 10%+.

AXLUSDT 2DAXL ~ 2D Analysis
#AXL Test this support, buy from here if you still have a Conviction on this Coin with a minimum target of 15%+

#XAL/USDT #XAL
The price is moving in a descending channel on the 1-hour frame and is adhering to it well and is heading to break it strongly upwards
We have a bounce from the lower limit of the descending channel, this support is at a price of 0.6090
We have a downtrend on the RSI indicator that is about

See all ideas
Summarizing what the indicators are suggesting.
Oscillators
Neutral
SellBuy
Strong sellStrong buy
Strong sellSellNeutralBuyStrong buy
Oscillators
Neutral
SellBuy
Strong sellStrong buy
Strong sellSellNeutralBuyStrong buy
Summary
Neutral
SellBuy
Strong sellStrong buy
Strong sellSellNeutralBuyStrong buy
Summary
Neutral
SellBuy
Strong sellStrong buy
Strong sellSellNeutralBuyStrong buy
Summary
Neutral
SellBuy
Strong sellStrong buy
Strong sellSellNeutralBuyStrong buy
Moving Averages
Neutral
SellBuy
Strong sellStrong buy
Strong sellSellNeutralBuyStrong buy
Moving Averages
Neutral
SellBuy
Strong sellStrong buy
Strong sellSellNeutralBuyStrong buy
Displays a symbol's price movements over previous years to identify recurring trends.
Related pairs
Frequently Asked Questions
The current price of Axelar/Tether USD (AXL) is 0.3720 USDT — it has risen 0.62% in the past 24 hours. Try placing this info into the context by checking out what coins are also gaining and losing at the moment and seeing AXL price chart.
Axelar/Tether USD price has fallen by −17.75% over the last week, its month performance shows a 29.62% increase, and as for the last year, Axelar/Tether USD has decreased by −38.00%. See more dynamics on AXL price chart.
Keep track of coins' changes with our Crypto Coins Heatmap.
Keep track of coins' changes with our Crypto Coins Heatmap.
Axelar/Tether USD (AXL) reached its highest price on Dec 3, 2024 — it amounted to 1.1378 USDT. Find more insights on the AXL price chart.
See the list of crypto gainers and choose what best fits your strategy.
See the list of crypto gainers and choose what best fits your strategy.
Axelar/Tether USD (AXL) reached the lowest price of 0.2706 USDT on Apr 7, 2025. View more Axelar/Tether USD dynamics on the price chart.
See the list of crypto losers to find unexpected opportunities.
See the list of crypto losers to find unexpected opportunities.
The safest choice when buying AXL is to go to a well-known crypto exchange. Some of the popular names are Binance, Coinbase, Kraken. But you'll have to find a reliable broker and create an account first. You can trade AXL right from TradingView charts — just choose a broker and connect to your account.
Axelar/Tether USD (AXL) is just as reliable as any other crypto asset — this corner of the world market is highly volatile. Today, for instance, Axelar/Tether USD is estimated as 1.63% volatile. The only thing it means is that you must prepare and examine all available information before making a decision. And if you're not sure about Axelar/Tether USD, you can find more inspiration in our curated watchlists.
You can discuss Axelar/Tether USD (AXL) with other users in our public chats, Minds or in the comments to Ideas.