AXSUSD 1WAXS ~ 1W 📈
#AXS Pattern H&S Formed here. this is the Bull Pattern. We will be buying in stages here with small trades, with a minimum target of 15%+
AXSUSDT.PS trade ideas

$AXS - Forming a huge inverse head & shoulders in weekly chart?NYSE:AXS looks incredible good if this inverse head & shoulders fromation plays out. The price is currently on a -95% retracement from it's ATH, talking about barghain this could be once serious opportunity to buy cheap and make profits. If crypto bullrun continues, we could be ahead of a massive move incoming, target is 140 usd or the sky, if CRYPTOCAP:BTC manages to keep going above 80k.
Everything below 4 usd is demand zone for NYSE:AXS , keep accumulating, and hold hold hold!!!

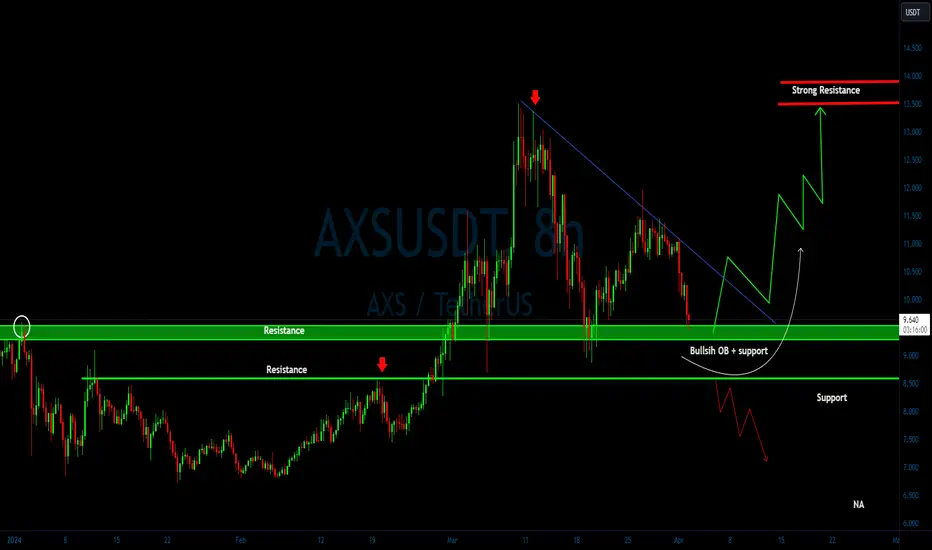
AXS: Approaching SupportTrade setup : Trends are mixed. Price had a bearish breakout from a Descending Triangle pattern.
Swing Traders: could enter near $7.00 support and 200-day moving average, which should be a robust support zone, with +25% upside potential back to $9.00. Price is also getting oversold (RSI ~ 30), which means that we could see a brief bounce up near-term. Stop Loss (SL) level at $6.00.
Trend : Downtrend on Short- and Medium-Term basis and Uptrend on Long-Term basis.
Momentum is Bearish but inflecting. MACD Line is below MACD Signal Line and RSI is below 45 but momentum may have bottomed since MACD Histogram bars are rising, which suggests that momentum could be nearing another upswing.
Support and Resistance : Nearest Support Zone is $7.0, then $5.5. The nearest Resistance Zone is $9.0 (previous support), then $11.0 - $12.0 and $14.0.

AXSUSD 1WAXS ~ 1W
#AXS Make purchases in stages from here with a minimum target of 20%++. Retesting of this support was successful.

AXS BULLISH STRUTURE IN 4H TIMEFRAMEAXS is breaking out in 4h timeframe,20 - 30% growth is expected. Targets and SL are given in alongside chart.

AXS USDTAXS Risky trade. remember always use stop-loss
Entry 9.743
S.L 9.3434
T.P 1 10.089
T.P 2 10.483
T.P 3 10776

AXS Analysis: Symmetrical Triangle Breakout and Market IndicatorThis analysis examines the recent price action of BINANCE:AXSUSDT AXS, focusing on the symmetrical triangle pattern and its potential breakout scenarios.
📉🔺Parabolic Move and Symmetrical Triangle:
AXS experienced a parabolic price surge and subsequently entered a symmetrical triangle pattern.
This pattern indicates a period of consolidation and uncertainty before a potential breakout.
🔽Breakout Scenarios:
A breakout from the triangle could lead to two main scenarios:
1. Upward Breakout: A breakout above the triangle's upper resistance could signal a continuation of the upward trend.
2. Downward Breakout: A breakout below the triangle's lower support could indicate a bearish reversal and a downward movement.
📊🔺Market Indicators and Considerations:
The direction of Bitcoin dominance and the Total Crypto Market Cap (TMC) index can influence AXS's price action.
In the 4-hour timeframe, the 50 EMA is acting as a support level, potentially affecting price movement.
⛔Additional Considerations:
False breakouts are possible, and traders should exercise caution and rely on confirmation indicators.
Analyzing other technical indicators and market sentiment can help refine trade entry and exit strategies.
🚫This analysis is for educational purposes only and should not be construed as financial advice. Always conduct your own research and employ sound risk management practices before trading.

AXS/USDT bullish horizon from support? 👀🚀AXS Today analysis💎 Paradisers, let’s delve into the intriguing movement of #AXSUSDT. Presently, it’s engaged in a delicate dance, retracing and meticulously retesting a critical support level at $9.379. This level holds immense significance, and its ability to transition from a mere retest to a robust support could be the harbinger of a potential bullish surge.
💎 After a triumphant escape from the clutches of a descending channel, the price of #AXS now approaches the key support level at $9.379. If it maintains its momentum at this crucial juncture, we may witness a delightful bullish reversal. Picture it: the price ascending, breaking free like a phoenix from the ashes.
💎 But ah, the markets are fickle, my friends. Should the price of NYSE:AXS dip below this pivotal zone, our strategy must adapt. Brace yourselves! We anticipate a bullish rebound from the secondary support level at $8.578. Failure to reclaim ground here could spell further declines. So, stay vigilant, stay nimble, and let’s navigate these market fluctuations with grace and precision
AXS/USDT/AXIESBeing on this space is good as long as you win, I have more haters than followers which i love it.
You want to make more moneeee, stay updated to new gold coin. but as an advice but not your financial advisor, this is not a financial advice. trade it or hold it.
AXIES to the moon? highest speculation is 63$.
I'm interested on lower price coin. if you have one comment down below, I would love to give a charts update on it.
$AXIES is trading below most of the owner of this coin not interested on selling it, its just a price reprice in below, it means it needs more demand. demanding the price is way more better than selling their coin.
I will update this once target being accumulated.
NOTE : this is not a financial advice, I'm not your financial advisor.
This coin is GAMing most of my friend their in PH play this.

Axie Infinity Wake UpI believe Axie Infinity has rooms to grow. Despite we see gradual rise in most crypto, metaverse tokens still lack liquidity for unknown reason. In case we see liquidity flow, first target for Axie Infinity is $14.69, then it can rise between $19 to $42 for now.

AXS Breaking Out in 4hr tfNYSE:AXS We can see a retest of the support area ($10.70 - $11.00) and we expect a bounce from here. A move towards the next resistance may happen anytime from now.
Next Resistance: $12.80-$13.50

AXS USDTAXS Setup. After a confirmed breakout from the trend line, and a marked zone in green is a good point for our entry. Remember stop loss is your friend. Everything is on the chart.
Entry 10.453
S.L 9.871
T.P 1 11.633
T.P 2 12.400
T.P 3 13.334

Bullish Alternate Bat: Reversal Harmonic *With Return Targets*Discovered on the 4 Hour is a Bullish Alternate Bat Harmonic Structure. This one, as aforementioned, is proposing a reversal to the upside, which has begun already. With a current bull trend we're in, the asset is expected to make a full 161.8 percent return to the upside in price action.

ASX (Y24.P1.E1). IF its a deeper correctionHi Traders,
If we find the current price level a strong resistance, we have the potentially to have a deeper correction of ABC.
If it does reach this level, its a great level to enter long because of a few chart elements in confluence.
All the best,
S.SAri

AXS looks ready to bounce again!GMMA shows a potential bounce from the retest of the AXS weekly chart. Keep an eye on this one! Also, there are some upcoming updates from the Axie Infinity Ecosystem.

#AXS/USDT#AXS
The price has been moving in a descending triangle since January 2023
With the presence of reversal patterns, the price finally broke the downtrend
With a large oversold presence on the MACD
Axie Infinity's potential in this time window is 250%
In 2023, we have gone through a very complex and long consolidation phase that will surely lead to the next major bull market wave.
Breakout and close above EMA10 and EMA21 in one candle.
There is support from the bull market.

Axie Infinity - Nice Upside PotentialAXS broke out of the descending triangle with some bullish strength, i really like the pattern on Daily timeframe, but to be perfect it just need to do the retest, but I don't know if that will happen, as the gaming sector in crypto has been performing very well recently and I believe it still is just the beginning.

$AXSUSDTDouble bottom on weekly chart.
Retesting zone.
No real resistance until $18.
Stop = below zone
Target = $18 & then next real resistance zone which is $34-$36.
If bitcoin rally continues - could see 2nd target but that's if things get wild.

SasanSeifi 💁♂ Can It Reach New Highs?
Hey everyone, I'd love to share some insights on the AXS chart! As you can see in the chart, the price of KUCOIN:AXSUSDT after a significant demand in the $4 range, broke the long-term downtrend line and experienced remarkable growth, reaching the $11 range. Now, after the correction and completion of the pullback process from the $7 range, we are witnessing positive fluctuations in the price again.
In the long term, it is expected that the price will continue to grow to the $11 target and the $14 liquidity range, and we will see a new price ceiling. To better understand the continuation of the movement trend, we should pay attention to the price reaction in the $11 and $14 ranges.
If the price breaks above $14, there is a possibility that the uptrend will continue to higher levels. Additionally, if the price breaks below the $7 range and stabilizes, there is a possibility of further correction. The probable trend is shown in the above image.
Please share your thoughts and insights in the comments below! I'd love to hear your take on the AXS chart.🙌🧐
This is not financial advice. Always do your research before making any investment decisions.✌

AXS: Short-term predictionSimple setup here
Trend
>
Consolidate
>
Trend
>
Consolidate
>
Flush out late longs before going through the major HTF resistance


AXS buy setupAXS has a good bullish structure. The latter has had an important BOS.
By maintaining the demand area, it can move towards the specified TPs.
Prone to growth up to two specified targets.
Closing a candlestick below the invalidation level will violate the analysis
Note that the financial market is risky, so:
Do not enter any position without confirmation and trigger.
Do not enter a position without setting a stop.
Do not enter a position without capital management.
When we reach the first TP, save some profit and try to move the stop continuously in the direction of your profit.
If you have any comments please post them, comments will help us improve our performance
Thanks

AXS is moving out from inverted H&SAXS is forming inverted Head and Should at bottom. A upside breakout is expected in a few weeks ahead. RR is great for a try
