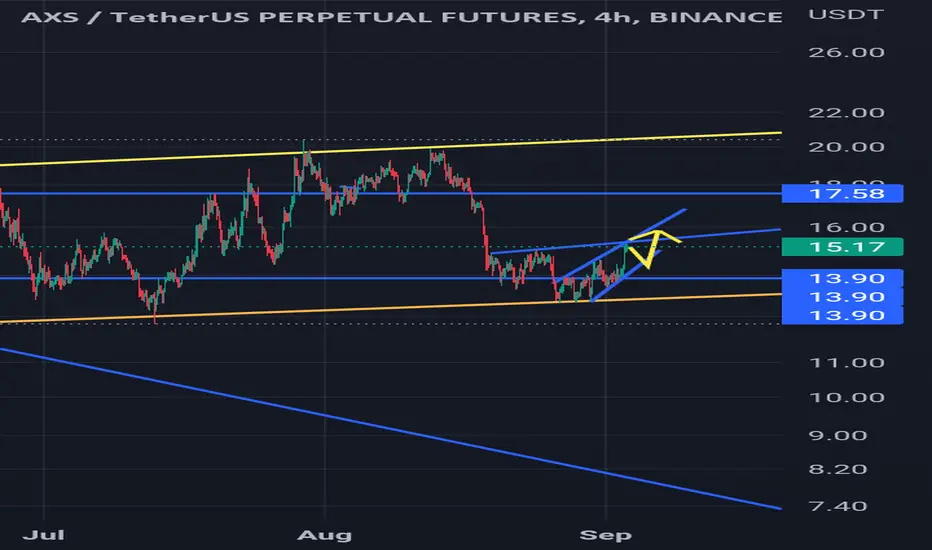
AXS - I'd wait a little bit longerThe breakout of the wedge is ahead - for both low and high timeframe - but before we break out, Momenter is signalling a rising bearish momentum which would make sense as to finally hit the $11 area which is a strong support - price didn't touch it yet and it would be a pretty good area to long - Keep your eyes on it. If we break out to the upside, 28-30$ is an easy reach if BTC bounces aswell.
AXSUSDT trade ideas

AXSUSDT is testing the supportthe price had a breakout from the ascending channel on the 4h timeframe above the 4h support. Now the price is testing the previous support as new resistance.
How to approach it?
IF the price is going to lose the 4h support and retest it as new resistance According to Plancton's strategy , we can set a nice order
–––––
Keep in mind.
🟣 Purple structure -> Monthly structure.
🔴 Red structure -> Weekly structure.
🔵 Blue structure -> Daily structure.
🟡 Yellow structure -> 4h structure.
–––––
Follow the Shrimp 🦐
AXSUSDTHello my dear friends
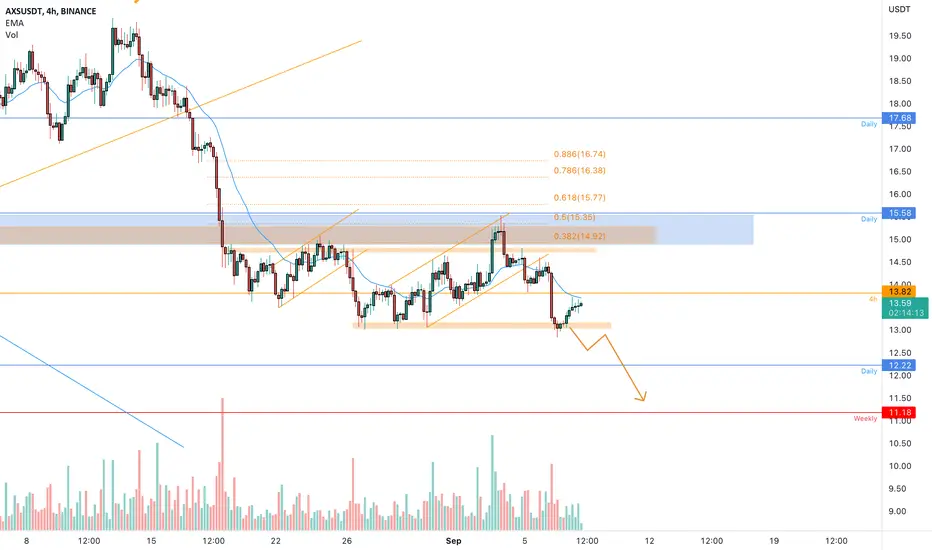
Four-hour chart: the probability of completion of the head and shoulders pattern at the end of the downtrend
Provided that the end of the upward trend and the price range of $12.99 is maintained, there is a possibility of forming an increasing trend up to the specified ranges.
If the current trend is above the price range of $15.77, there is a possibility that the trend will advance to the yellow range ($16.77).
We would be happy to hear your comments

Axie Infinity (AXS); when to buy?The resistance level with the upper border of $15.02 was broken on the Daily price chart on September 3. The trend is bullish now and the correction wave develops.
A pullback buying opportunity will appear after the correction completion on the Daily timeframe.
The highs of September 3 – 5 will be the target for the bullish movement continuation after the correction is finished.
In case of successful development of the trend, a more distant target will be on the highs of August 12 – 15, where the next resistance is located with the borders of $19.23 – $19,90.
Long positions will remain relevant until the market is above the nearest support level on the Daily timeframe, the lows of August 26 – 30 . The borders of this support are $13.0 – $13.15.

DAY 3: #AXSUSDT #LONGDAY 3: #AXSUSDT #LONG
2% of the deposit
Margin: isolated
⚖️Leverage: x10-20
🗝Entry point: 14.00-14.12
🎯target 1 - 14.39
🎯target 2 - 14.67
🎯target 3 - 15.08
🎯target 4 - 15.53
🎯target 5 - 16.09
❌stoploss: 13.50

Axie Infinity shortAxie Infinity broke trough the ascending trendline. Asset broke trough the support area. Bearish movement to support level at 13.1 is possible.
Axie Infinity trade plansafter a huge upside AXS peaked a new high of 15$ and has now formed a solid looking parallel channel and if this breaks to the upper side then AXS might peak 16-18$. But i then i would be glad to go short as well if it breaks to the downside, just expecting a reaaly sharp move towards either side.
Happy Trading !!!

AXSUSD LONGPossible upward movement of the pair. Price is currently in a lower bound trading zone on significant volume , making stops and holding rejections at the bottom of price near the 55 period EMA , essential in my strategy for analysis of potential trend continuations. Indicators like Squeeze Momentum and the MACD histogram have turned bullish after their red valley; accompanied by the loss of bearish strength indicated by the ADX rebounding towards the EMA . The MACD lines would be giving a possible buy signal soon. I think it could go in search of the previous high price zone.

AxsusdtIn my opinion, the price will go down in the short term, but the price will go up in the long term
AXS rechargingAXS looks like it will pump again from there to our target. We broke MA20 on daily which is big daily MA used many times for short terms. Be ready for tonight and tomorrow. Entry here before daily close

AXSUSDT | SETUPAXUSDT is trading in a bullish parallel channel . The price action is making higher highs and higher lows. Recently it took support from lower boundary of channel and approached to upper boundary of channel.
The bulls need to break above upper boundary of channel. While bears will be in control below the upper boundary.
Trade your levels accordingly.

AXSAccumulation of daily 50-100 MAs is the nearest very strong resistance, from which a local price correction can start. Breaking through the level will be a strong bullish signal and the price will rise to the upper border of the channel

AXSUSD LONGWe entered long just in the area of price rejections in the last limit zone of the trading area with significant volume , which is part of what I consider a range. We are looking for an upper limit approximately.

AXSUSDT BAT FORMATIONBat
The Bat Pattern is a 5-point retracement structure that was discovered by Scott Carney in 2001. It has specific Fibonacci measurements for each point within its structure and it is important to note that D is not a point, but rather a zone in which price is likely to reverse, called the Potential Reversal Zone (PRZ). The B point retracement of the primary XA leg must be less than a 0.618, preferably a 0.50 or 0.382 and the PRZ consists of 3 converging harmonic levels: 1) 0.886 retracement of the primary XA leg, 2) extended AB=CD pattern, usually 1.27 AB=CD and 3) minimum BC projection is 1.618.
The first target would be the 382 retracement of AD and the second target the 618 retracement of AD. A common stop level would be behind the X-point. Conservative traders may look for additional confirmation. Bat Patterns can be bearish and bullish. TradingView has a smart XABCD Pattern drawing tool that allows users to visually identify 5-point reversal structures on a chart.

AXS short$AXS bounced off the resistance level. Decline to support level at 13.06$ is likely to happen.

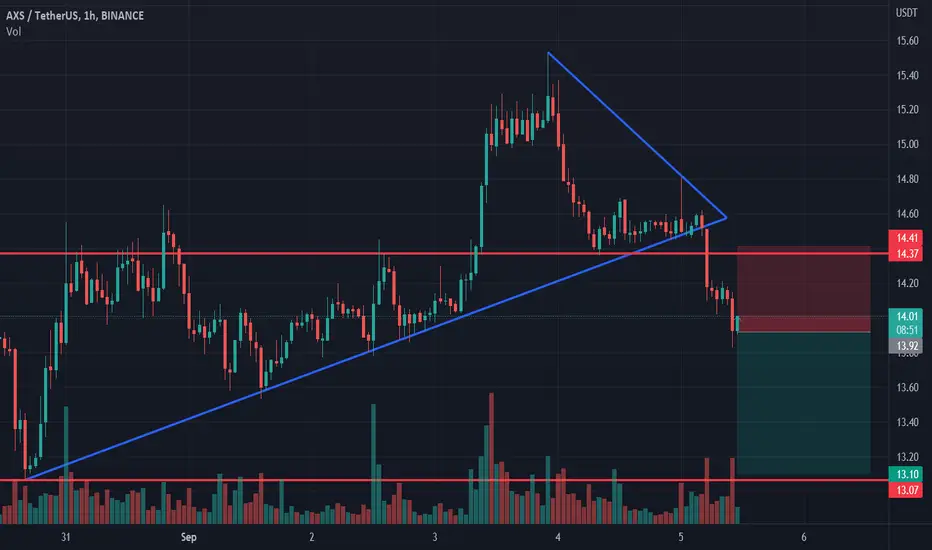
AXS prints a triple bottom patternIf you look at the 4h time frame chart of AXS you can clearly see that it successfully completed and confirmed the triple bottom pattern breaking out the resistance line.
I will consider to wait for a pullback and enter a long at 14.02$ with an stop loss at 13.43$ and i will take profits at 16.62$.

Axie Infinity longAxie Infinity broke trough the descending trendline. Asset broke trough the resistance level. Bullish movement to resistance level at 15.1 is expected to happen.

AXS fall to the bottom again🔥 Best entry point here!Hi friends! AXS move in the falling wedge and can breakout it after some pullback to the lower boundary. It will be good to see some trap with wedge. 🔥The long and short traders will be trapped, if the price will fall below the wedge and become the fuel🔥 for futher growth:
1. stops of long traders will be activated
2. sell limits of short traders will be activated also
🚩 After this, the price can pump and liquidate short traders. The long traders who were trapped will try to open their long on this impulse but iopen it at highs. Always the same.
📊 Preconditions to open a long:
🔥 false breakout of the falling wedge down or test the lower boundary of this wedge
🔥 volume growth which confirms the pressence of buyer and our scebario with trap long and short traders
🔥 bullish BTC help all the ALTs make a huge pullback
DOM and Footprint tools that i use fot scalping and swing trading show me the real orders of the BIG players which will accumulate AXS at the bottom.
📊 The targets:
1. $19.7-22 - the closest value area and resistance
2. $28.6-30.3 - the value area and even number
💻Friends, press the "boost"🚀 button, write comments and share with your friends - it will be the best THANK YOU.
P.S. Personally, I open an entry if the price shows it according to my strategy.
Always do your analysis before making a trade.

AxsusdtHello friends. I see two patterns. A twin floor, Adam and Adam. And a descending triangle, in any case, breaking the 13.90~14 resistance could be the start of an upward movement. Share your opinion with me.

Huge Sell Opportunity What's good TRADINGVIEW family, I spotted a profitable Bearish Candle on (August 20, 2022), that has the potential for a 46.02% return on investment. (Here are my 3 reasons)
*This bearish candle has these 4 principles - 1. The (RED MA) is above the bearish candle and (BLUE EMA), 2. The Bearish Candle has a flat top, 3. The Bearish Candle is below the Ichimoku cloud, 4. The previous wick of this Bearish Candle is greater than the last bearish previous wick.
2. This Bearish Candle has 4 effective indicators which increase the probability of a successful sell trade
3. This Bearish Candle has 3 advantages over the last bearish candle
1st Advantage = The (RSI INDICATOR) ON THIS BEARISH CANDLE IS LOWER THAN THE LAST BEARISH RSI (5), BY 2
2nd Advantage = The (DMI INDICATOR) ON THIS BEARISH CANDLE IS GREATER THAN THE LAST BEARISH DMI (94), BY 4
3rd Advantage = The PREVIOUS WICK OF THIS BEARISH CANDLE IS GREATER THAN THE LAST BEARISH PREVIOUS WICK (5), BY 6
*2 RESISTANCE LEVELS - WHICH THE PRICE OF AXS HAS RESPECTED THAT WILL PROTECT THE PRICE FROM HITTING MY (S.L)
(SHORT POSITION)
Entry Price: $14.78
Stop Loss: $15.92
Take Profit: $8.34
Position Size: $200 (invested)
Buomkuoth Reath - August 29, 2022 - 9:05pm

🔥 AXS Classic Bear Flag Break Out: Wait for Confirmation!With BTC dropping, its to be expected that alts will follow.
AXS is one of the weakest alts of the last couple of months, so the expectation is it will continue the bearish trend.
After breaking out of the bear flag, AXS has one more obstacle to clear before we can move down, which is the purple Area of support.
A daily close below this area will most likely be the starting signal for more bearish price action. Be patient for the break out. Targets placed at $10 and $9.

AXSUSD LONGPossible upward movement of the pair. Price is currently in the trading zone with significant volume holding a significant stop near the pivotal 55 period EMA in my trend continuation analysis strategy. I see a pattern known in my strategy as the ABC pattern, which indicates a range close to the EMA, for a possible continuation of the uptrend, in this case, through its wave C, which matches from my strategy with a it comes from the price to the 55 period EMA on the bounce on the 4-hour chart. We see the accompanying indicators such as the Squeeze Histogram of Momentum and MACD with bullish directionality accompanied by the loss of strength of the previous move higher in robot, indicated by the ADX below the 23 level. We see a possible selling pattern in the MACD lines. In one-hour timeframes we see important rejections close to the 55 period Ema, also being in a trading zone with significant volume and possible buy signal patterns. I think it is quite possible to move higher on a break of the previous highs and continue its trend. You will see the development of the pattern and the confirmation of the trend change to up.

AXS shortAXS bounced off the resistance area. Asset broke trough off the ascending trendline. Bearish movement to support level at 13.53 is possible.
