BAT PERSONAL ANALYSIS IN THE LONG TERMChart shows common supports and resistances based on the Fibonacci and price action. The total evaluation for the BAT token is neutral-bullish. The token has a very stable audience interest upon established each higher lows, but the RSI is not even near oversold which means that there will be a slight overdue in its retracement to really test buyer interest. The bearish divergences found on each higher high are very normal as buyers struggle to keep the price above, as long as it stays above the red zone even being oversold at the Relative Strength Index, it will be a confident long term investment.
The recommended strategy for this coin is to short it when it is near strong resistances especially during a bear trend/market and long it at respectable buy order levels once there is confirmation of a bull trend/market.
Market insights

BATOne perspective of the long term trends of BAT
Bat will have a lot of trouble geting back up in track

$Bat still overall bullish on the monthlyEntries for bat. Possible continuation of Monthly momentum.
Use good Risk management

Another GREAT entry point on BAT for a move up to the $3 level!Basic Attention Token (BAT)
Prior analysis
We published our initial BULLISH analysis on BAT on Nov. 2nd when the price was sitting at $1.04 per coin. We made the call that BAT will be moving towards the $2 level before the end of the year and surely enough BAT hit its new all time high at $1.98 on November 28th less than a month later. Our followers managed to generate nearly 100% return on the trade and we received quite a lot of positive messages from them, thanking us for our insightful market analyses.
Now, after the recent correction BAT is presenting another bullish price pattern, thus signaling that more gains could be expected ahead. Since our initial Take Profit levels have already been hit and the framework and narrative around the Basic Attention Token continues to improve we have raised our year-end targets for BAT as we are now targeting the $3-4 range.
Fundamental Analysis
From a fundamental standpoint, BAT is one of the most exciting small-cap blockchain projects out there with a remarkable long-term growth potential. This comes from the fact that while many cryptocurrencies promise big things, the Basic Attention Token is one of the few and far between blockchain based businesses that actually have the tools they need to solve a real-world problem that we are facing today. The Basic Attention Token aims to disrupt and substantially improve the filled with controversies $330 billion digital advertising industry, which many believe that is currently failing its users, publishers and advertisers. BAT has already made meaningful steps towards resolving the large number of endemic inefficiencies and privacy violations hobbling the digital ad industry as it aims to make crypto and DeFi accessible and useable for everyone.
BAT has seen stunning results since its integration into the Brave browser’s first global private ad platform: 30 million monthly active users, 10 million daily active users, 1 million verified creators accepting BAT, millions of wallets created, thousands of ad campaigns with leading brands, and growing utility in the most innovative names in blockchain gaming. The results make BAT one of the most, if not the most, successful alt–coin projects to date.
Furthermore, last month we received news that the largest crypto asset managing company, Grayscale Investments, has decided to double down on its bet on altcoins and has purchased additional 188,991 BAT; 8,823 LINK; and 5,121 FIL in the last 45 days. At the moment, Grayscale holds $39.634 billion worth of Bitcoin, $13.438 billion in Ether, $6 million in BAT, $9.4 million in LINK and $6.1 million worth of Filecoin.
We believe that this is a great confirmation for the positive market sentiment among institutional investors, showing their confidence in the strong growth potential of the space. We see this as a huge catalyst for a major price appreciation moving forward, as it significantly strengthens the investment thesis for BAT.
Technical Analysis
From a technical standpoint, after the most recent price surge where the price almost doubled in a matter of just few trading sessions, rallying from the $1 level all the way up to $1.93, we are now presented with an attractive buying opportunity for BAT at around $1.59 per coin. The recent more than 18% correction came as a no surprise due to the expected heavy profit taking that took place after that near 100% rally. However, as you can see on the chart, the price structure looks very healthy as BAT is trading above all of its major moving averages 5, 20, 50 and 200 EMAs. In addition to that, we must point out that the corrective movement stopped right at the upward sloping trendline support on the 4H chart (blue line), which also coincided perfectly with the 38.2% Fibonacci Retracement on the daily chart. Both the RSI and Stochastic oscillators have also retraced from overbought conditions and are turning higher as we speak. We are also seeing another ascending triangle forming on the 4H chart, with a neckline at around $1.75. We expect the price to push through the resistance lying at $1.75 in the next 3-5 daily trading sessions. Once the break is confirmed, BAT will take off towards its next major level of around $2.50-2.75 per coin. Since BAT, is still a small-cap cryptocurrency with a total market cap of only $2.3 billion, our long-term forecast for BAT shows that it has the potential of reaching the $4-6 per coin range.
From a risk-management standpoint, we will look to place our Stop Losses immediately below the 50-period EMA on the 4H chart at around $1.28 in case of a sudden price failure. However, in an event where we see BAT moving sharply lower, we will be looking to buy more of BAT at a discount as we firmly believe in the long-term growth prospects for the Basic Attention Token.
Follow us on eToro for more detailed market analyses, profitable trading ideas and a consistent portfolio performance!
Sincerely,
Dow Experts Finance

BAT-BUY THE DIPWatch for volume to decrease and price to settle at a fib or marked support/resistance line to buy the dip.

MY MINIMALIST CHART ANALYSIS FOR BASIC ATTENTION TOKEN$BAT
11.26.21
1912H +8 SINGAPORE
ALERT:
LOOKING FOR BEST TOP-UP ENTRY BEFORE the end of the SWING CYCLE.
We are now looking at an ENTRY that we can TOP-UP for our Investment FIB 0.618 or LOWER.
A little more till we finish this swing and move to the next swing cycle.
VITAL SIGNS: RSI, STOCH are all looking good. We will just wait for the oversold. While the VOLUME shows SUPPLY building up for DEMAND (FUD).
The Market has amazingly moved along the TOPS and BOTTOMS of our BOXES, signifying TURNING POINTS of PRICE ACTION. Volatility for this market is healthy.
and we have gone a long way from the bottom of the SWING.
Happy Trading!
Disclaimer:
The findings of the following analysis are the sole opinions of the publisher of this idea and should not be taken as a piece of investment advice.
INSTRUCTIONS: HOW TO USE THIS MINIMALIST CHART
"FOLLOW THE WHITE RABBIT!"
Just Follow the TOPS and BOTTOMS of the BOXES as a GUIDE where the MARKET will take you.
Created on a MONTHLY, WEEKLY & DAILY Analysis of a MARKET'S CHARACTER.
It is designed for SWING TRADES at the BOTTOM. I do not SHORT, though, you can still use it.
TARGET ZONE IDENTIFICATION
The LARGE BOXES (Tops and Bottoms) are MAJOR turning points that will occur sometime in the future. While the SMALL BOXES (Tops and Bottoms) are MINOR turning points.
These can be entries to a BUY/ SELL POSITION, EXIT/PARTIAL EXIT/TOP-UP AREAS, as well as Support and resistance levels
Also includes MAXIMUM TARGET EXIT AREA OF VALUE - CONSERVATIVE (If price action conditions are right at that given moment.)
At times I include WAY BEYOND PARABOLIC Price TARGETS depending on The Character of the Market (CRYPTOS ONLY).
DYOR for your Volume, Chart Patterns, Candlestick Math, FIB COILS ( ABC ), Price Action, FIB LEVELS, Market Dynamics, especially institutional and retailer trading psychology.
Wishing you all The Best Trades and Thank you all for your Appreciation and Support of My Work.
Much thanks to My 3 Mentors. They are so much of a Blessing that I also wish to Share.
Vive Le Autist!
Vive Le Egalitarianism!

Alternate Bearish Bat on BATBAT has been good but i think it's time for it to cool down and perhaps make a 78.6% retracement.
We have a Bearish AB=CD and a Bearish Alternate Bat Pattern at a confluence zone between the 1.13 and 1.272 Fibonacci extensions and Bearish Divergence on the RSI with the reciprocal downward target pointing towards the 78.6% retracement from low to high.

Brave Browser's BAT lift offI love this token. It makes sense. It has 'value'. I love that Brave put a value on your time. There seems to be an advantage of using Brave's wallet over Metamask. Much more can be said about it

Basic Attention Token (BATUSD) to break resistances? OBV SupportCan the Basic Attention Token (BATUSD) breakout of the price and RSI resistances?
On OBV things are looking quite good so far.
Drop me a nice comment if you'd like me to analyze any other cryptocurrency.
*no financial advice
do your own research before investing

BATUSD next moveEntered @ $1.32, exited @ $1.80. Price consolidating. Support holding between $1.30 and $1.32. I'd like to see it exit this trend to the upside and close, because these candles look like bearish hammers.


bat/usdelliot wave price prediction based on fib levels and previous support/resistance levels//study purposes only

BAT/USD bucks the trend and surges to new all-time high Major cryptocurrencies have been falling due to fears over a new mutation of Covid-19 that may be more transmissible. There are fears it could evade vaccines which brings the possibility of further restrictions and lockdowns.
The sell-off in global markets did not stop BAT from hitting a new all-time high. Basic Attention Token was up 40% at one point before correcting. This made it the best performing crypto in the top 100. A Solana partnership was announced two weeks ago and crypto exchange FTX recently announced support for wrapped BAT.
Basic Attention Token is the crypto token that powers the ‘Brave’ ecosystem. Users can earn these ERC-20 tokens simply by browsing the web with Brave. Creators can use the Brave publisher platform and earn tokens when users view their content. Brave also announced the integration of a crypto wallet on the browser.
‘Brave wallet’ will allow users to manage their crypto without the need for a browser extension. It will be compatible with Polygon, Avax and layer-2 chains which are built on top of Ethereum.
Price action in November has seen BAT trade within the range of $1 and $1.40. This was broken through with price reaching levels above $1.8. $2 could be the next target for bulls, but a drop below $1 cannot be ruled out due to the broader crypto market dipping. Let’s see if BAT can hold a price level above all-time highs.

BAT USD Price Discovery - Fibonacci Suggests 5 Dollar MTF GoalBackground FA: BAT announced Fundamental Partnership with Solana and launched own DEX in Brave Browser (100m monthly users), making it a direct contender for Uniswap, $UNI (which has 3 million users and market cap 10x bigger than $BAT).
Background TA: BATBTC Pair broke out of Long-Term Downtrend with highest ever volumes, sending the BATUSD pair into ATH and Price Discovery.
Fibonacci Suggests that 5 dollars per BAT is the Blow Off Top in this mini-cycle as per Coinbase Metrics.
Goldsworth.Org Technical Analysis ideas brought you $DOGE at 14 Sats, $LUNA at 10 cents, $SOL at 3 dollars.

BatUSD Ready to Run all Hurdles crossedHi everyone,
This is a 3day chart. the price has crossed all resistance and now clearly bouncing off Cloud support.
A clear Cup and handle spotted and its stretching itself to make a new leg up.
Rsi Is clearly showing an uptrend with higher lows and highs intact and respecting the channel formation.
The first TP area is $2.50
The Second TP area is $5.00
Best of luck
Please like and subscribe for more analysis

Basic Attention Token (BAT) - November 23Hello?
Welcome, traders.
By "following", you can always get new information quickly.
Please also click "Like".
Have a nice day.
-------------------------------------
(BATUSD 1W Chart) - Medium to Long-Term Perspective
Above the 0.44554484-0.50257335 section: Expected to create a new wave.
(1D chart)
First resistance section: near point 1.23714493
Second resistance section: 1.51867629-1.61252007
Support section: 0.86176979-0.95561357
To break out of the downtrend line, we need to see if we can sustain the price above the 1.08247674 point.
If it falls from the support area, it may move towards the 0.67408221 point, so trade cautiously.
A move above the 1.17586124-1.23714493 section is expected to accelerate the uptrend.
-----------------------------------------
(BATBTC 1W chart)
Over the 2955 Satoshi-3749 Satoshi section: Expected to create a new wave.
------------------------------------------
We recommend that you trade with your average unit price.
This is because, if the price is below your average unit price, whether the price trend is in an uptrend or in a downtrend, there is a high possibility that you will not be able to get a big profit due to the psychological burden.
The center of all trading starts with the average unit price at which you start trading.
If you ignore this, you may be trading in the wrong direction.
Therefore, it is important to find a way to lower the average unit price and adjust the proportion of the investment, ultimately allowing the funds corresponding to the profits to regenerate themselves.
------------------------------------------------------------ -----------------------------------------------------
** All indicators are lagging indicators.
Therefore, it is important to be aware that the indicator moves accordingly with the movement of price and volume.
However, for the sake of convenience, we are talking in reverse for the interpretation of the indicator.
** The MRHAB-O and MRHAB-B indicators used in the chart are indicators of our channel that have not yet been released.
(Since it is not publicly available, you can use this chart without any restrictions by sharing this chart and copying and pasting the indicators.)
** The wRSI_SR indicator is an indicator created by adding settings and options to the existing Stochastic RSI indicator.
Therefore, the interpretation is the same as the traditional Stochastic RSI indicator. (K, D line -> R, S line)
** The OBV indicator was re-created by applying the formula to the DepthHouse Trading indicator, an indicator disclosed by oh92. (Thanks for this.)
** Support or resistance is based on the closing price of the 1D chart.
** All descriptions are for reference only and do not guarantee a profit or loss in investment.
(Short-term Stop Loss can be said to be a point where profit and loss can be preserved or additional entry through split trading. It is a short-term investment perspective.)
---------------------------------

BATUSD Looks really goodBATUSD is perched upon a key Fibonacci circle level
A position like this allows it to bounce off the fib line and possibly reach a new ATH
A falling Wedge pattern is evident earlier in the price history
It is also positioned between the 0.786 and 0.618 fib level


BAT following uptrend nicelyBAT has continued to make higher highs and higher lows for days now. Wen moon? Soon?

Crystal clearPrice action is the most important tool you can learn
Most common basic ones
1. Pin bar
2. Hammer
3 bullish engulfing
4. Bearish engulfing
5. Inside Bar pattern

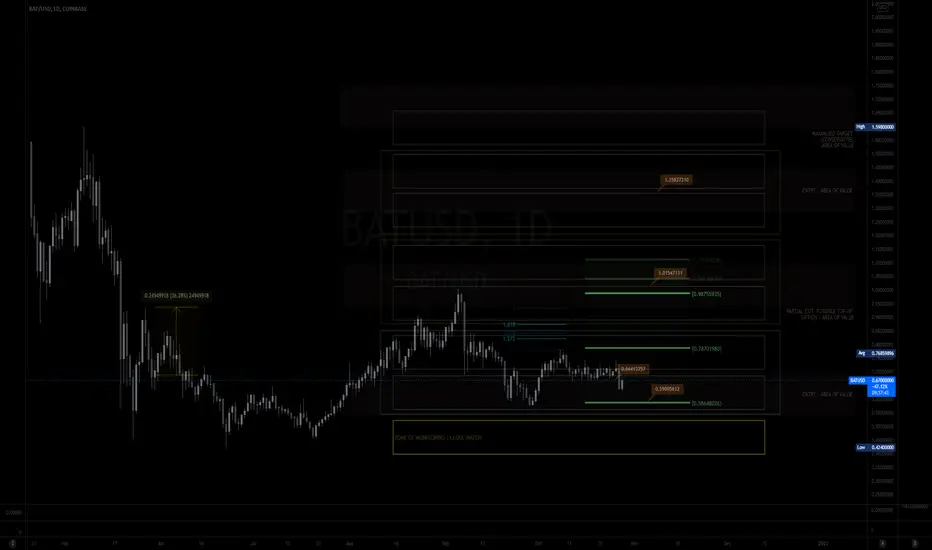
MY MINIMALIST ANALYSIS FOR THE BASIC ATTENTION TOKEN$BAT
10.28.21
2219H +8 SINGAPORE
ALERT: ENTRIES, PARTIAL EXITS, EXITS, and MAXIMIZED AREAS OF VALUE
AN AREA OF OPPORTUNITY at this ZONE FOR AN ENTRY
Disclaimer:
The findings of the following analysis are the sole opinions of the publisher of this idea and should not be taken as a piece of investment advice.
"FOLLOW THE WHITE RABBIT!"
HOW TO USE THIS MINIMALIST CHART
Created on a MONTHLY, WEEKLY & DAILY Analysis (The Dynamics of the Market.)
It is designed for SWING TRADES at the BOTTOM. I do not SHORT, though, you can still use it.
The LARGE BOXES (Tops and Bottoms) are MAJOR pivot points that will occur, while the SMALL BOXES (Tops and Bottoms) are MINOR pivot points.
These can be entries to a BUY/ SELL POSITION, EXIT/PARTIAL EXIT/TOP-UP AREAS
and even if you wish to hold longer for a CONSERVATIVE MAXIMUM TARGET AREA OF VALUE (Depending on, if the conditions are right.)
At times I include WAY BEYOND PARABOLIC Price TARGETS.
Watch out for your Volume, Chart Patterns, Candlestick Math, Price Action, and especially your Fibs, Market Dynamics, and trading psychology.
The above-mentioned is sufficient enough as a major deciding factor for this MINIMALIST CHART.
Note: That This CHART is best used without indicators. (As we all know, they lag.)
BAT reloadedBAT now sitting at 0.50-0.618 level and ready to load up again. if it breaks 1.6 this week, we will see 2 in the near future.

BAT breaking resistanceBasic Attention Token (BAT) breaking resistance bro. No financial advice but looks good!
