AVGO Threw a Party and Forgot the Guests 🚀 AVGO Threw a Party and Forgot the Guests 🚨
Hello team,
We are going to dive into one of the deepest and most counterintuitive secrets of technical analysis.
The sacred relationship between price and volume.
This connection is not just a metric, it is the voice of the market. And sometimes, it screams a warning at us just when we think everything is rosy.
📉 The Deception of the All-Time High with Low Volume
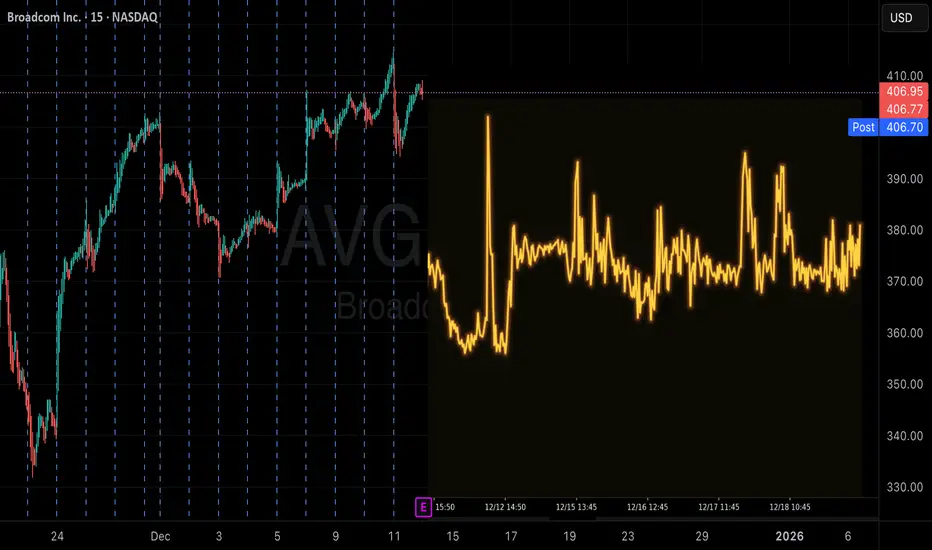
Look closely at the image accompanying us. Observe that All-Time High (ATH), the peak of the mountain, marked with the phrase, ATH with the LOWEST volume.
What does this mean?
Think of a party.
An ATH is the biggest party, the most anticipated event. If the price rises to a new peak (the ATH), but the volume (the number of people trading, the "guests") is the lowest we have seen in a long time, what does it tell us?
Lack of Wholesaler Conviction: There is not enough enthusiasm and participation from the big players, the Smart Money, to validate that movement. Few people wanted to buy.
An ATH with low volume is often an alarm signal, the rise is fueled by the optimism of a few, not by the collective power of the masses.
✅ The High-Volume Drop
Now, look at what happens right after. The price drops, and look at the volume bar, it's huge!
Here is the key lesson:
If a low-volume rally is dangerous, a HIGH-VOLUME drop is often the process that cleanses and resets the market.
All that volume is the result of the capitulation (panic and selling) of late buyers and the profit-taking of those who bought lower.
This strong, voluminous drop flushes out the weakness in the market. It is redistributing assets, moving from weak hands (those selling out of fear) to strong hands (those buying for the long term in value zones). This, paradoxically, can be the prelude to a healthier base.
🎯 The Strategy: Support and Accumulation Zones
Now, let's talk about strategy, because in trading, it's not just about understanding, but about acting!
Observing the chart, we see the importance of key support zones . A critical area to defend is the $325 mark.
If the $325 support fails, It is our signal that the market has decided to continue its correction . The next natural and highly interesting target, where volume accumulates significantly again, is around $250.
This $250 area is a volume accumulation level (the histogram on the right side confirms it). High prior volume at a price level indicates that a major battle occurred there, and therefore, it is a very strong support/resistance zone.
⚔️ My Battle Plan
Enter short only if the price breaks and confirms the loss of the $325 area. This would give us an impulse trade with a clear target in the $250 zone, an area where historical demand has proven to be strong.
🎯 Take Profit: $250 | > 20% Potential
🛡️ Stop Loss: $342 Zone (Above the breakout) | ~ 5% Risk
⚖️ Risk/Reward: 4:1 Ratio
We could also anticipate a bounce at the $325 support, aiming for a new wave back to All-Time Highs. However, the volume pattern suggests we should be cautious. A dynamic strategy here would be to attempt the long position, but remain agile: if the $325 support breaks, honor your stop loss and immediately flip the position to join the short movement. This ability to pivot is a common and powerful tool in the market.
🎁 Let’s make a simple deal.
I will handle the heavy lifting to find the top 1% of setups like this, and you just HIT the 🚀 Rocket, Follow and Enjoy.
🤝 Deal?
Broadcom Inc. Deposito Arg Repr 0.025641 Sh
No trades
Market insights

Broadcom - The short of the century!⏰Broadcom ( NASDAQ:AVGO ) is reversing right now:
🔎Analysis summary:
Broadcom is just insane. After another retest of the very steep support trendline, we just witnessed a crazy rally of +200%. But at this exact moment, Broadcom is totally overextended and retesting major resistance. A healthy correction is starting today.
📝Levels to watch:
$400 and $300
SwingTraderPhil
SwingTrading.Simplified. | Investing.Simplified. | #LONGTERMVISION

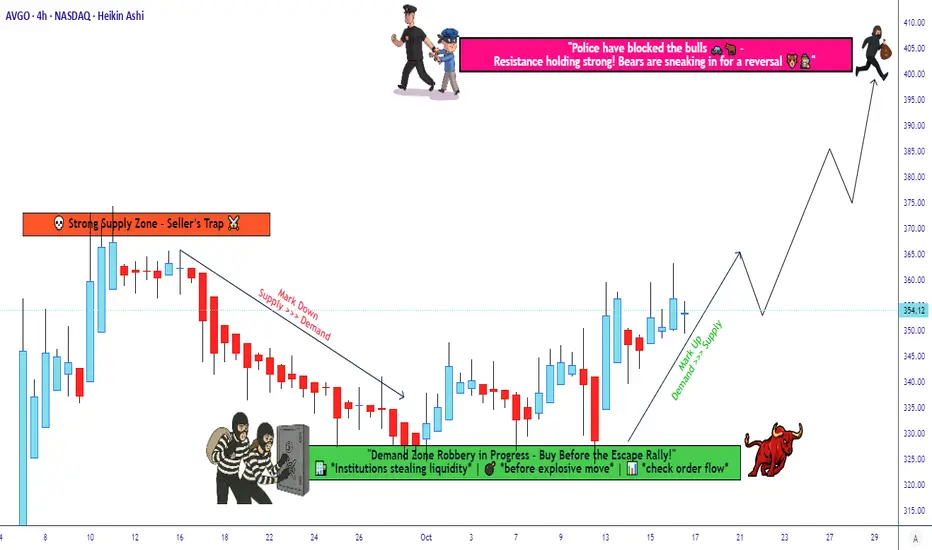
Broadcom Technical Setup - Systematic Entry Approach🎯 AVGO: The Great Heist Setup | Layered Entry Strategy 💰
📊 Asset Overview
Broadcom Inc. (AVGO) - The semiconductor kingpin that's been printing money like a Vegas casino! 🎰
🎭 The Heist Plan: BULLISH Setup
Strategy Style: The "Thief Method" - Layered Limit Orders (Ocean's Eleven style but legal! 😎)
🚪 ENTRY ZONE: The Multi-Layer Approach
This ain't your grandma's single entry point! We're going full stealth mode with multiple limit buy orders spread across the zone like a well-planned heist:
Suggested Entry Layers:
💵 Layer 1: $330
💵 Layer 2: $340
💵 Layer 3: $345
💵 Layer 4: $350
💵 Layer 5: $355
OR feel free to enter at ANY current price level if you're feeling bold! 🎲
Pro Tip: You can add more layers based on your capital and risk appetite. More layers = Better average price = Smoother ride! 🎢
🛑 STOP LOSS: The Emergency Exit
Thief's Escape Hatch: $320
⚠️ RISK DISCLAIMER: Dear Thief OG's (Ladies & Gentlemen of Fortune), this is MY stop loss level for MY strategy. You're the boss of your own money! Set your SL based on YOUR risk tolerance. Make money, take money - at your own risk! 🎲
🎯 TARGET: The Vault Unlocks Here!
POLICE BARRICADE ZONE (Strong Resistance Alert! 🚨): $400
This level is where we expect:
💪 Strong resistance
📈 Overbought conditions brewing
Bull traps potentially forming
Strategy: Escape with your bags of cash before the sirens go off! 🚔💨
⚠️ PROFIT DISCLAIMER: Again, Thief OG's - this is MY target, not financial advice! Take profits whenever YOUR plan says so. Your money, your rules, your responsibility! 💯
🔗 Related Pairs to Watch (Correlation Play)
Keep your eyes on these accomplices in the semiconductor/tech heist:
NASDAQ:NVDA (NVIDIA) - The GPU mastermind, moves often correlate with AVGO
NASDAQ:AMD (Advanced Micro Devices) - Another chip champ in the gang
NYSE:TSM (Taiwan Semiconductor) - The supplier kingpin
NASDAQ:QCOM (Qualcomm) - Wireless chip crew member
NASDAQ:SMH (VanEck Semiconductor ETF) - The whole gang in one basket
Key Correlation: When semiconductor sector heats up, AVGO typically rides the wave. Watch NASDAQ:SMH for sector-wide momentum! 📡
🎪 Why This Setup Works (Technical Edge)
✅ Layered entries reduce timing risk
✅ Multiple support zones below current price
✅ Clear risk/reward structure
✅ Room to run toward resistance at $400
✅ Semiconductor sector showing strength
🎬 Final Words from Your Friendly Neighborhood Thief
This is the "Thief Strategy" - a layered, calculated approach to catching moves in AVGO. It's all about spreading your risk, averaging your entry, and having a clear exit plan whether things go right (🎯 $400) or wrong (🛑 $320).
Remember: The best thieves always have an escape plan! 🏃💨
Trade smart, not hard! And always remember: Past performance doesn't guarantee future results, but a solid plan beats panic every time! 🧠💪
✨ If you find value in my analysis, a 👍 and 🚀 boost is much appreciated — it helps me share more setups with the community!
#AVGO #Broadcom #SwingTrading #DayTrading #TradingStrategy #StockMarket #TechnicalAnalysis #LayeredEntry #ThiefStrategy #Semiconductors #TechStocks #RiskManagement #TradingIdeas #StockTrading #BullishSetup #TradingView #MarketAnalysis #PriceAction #SupportAndResistance
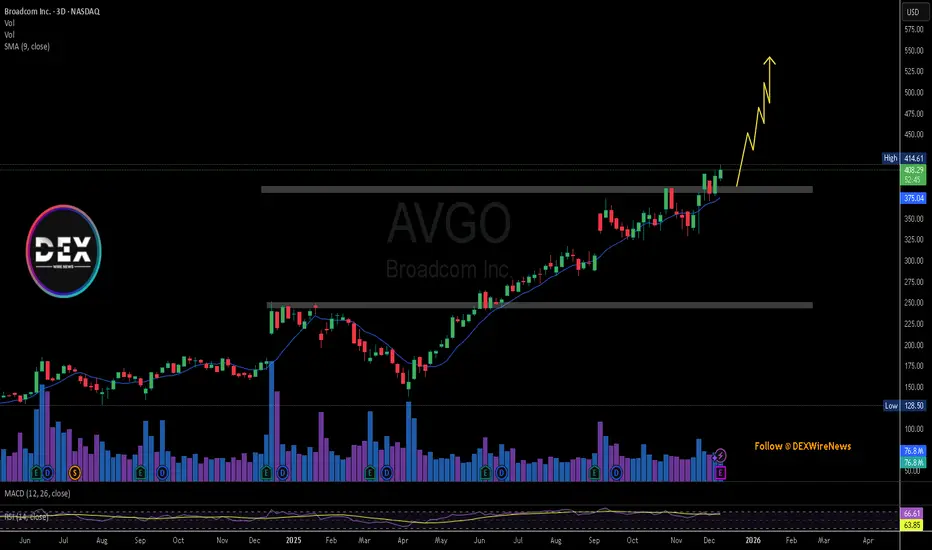
Broadcom (NASDAQ: $AVGO) Rally Faces Earnings TestBroadcom Inc. (NASDAQ: AVGO) enters earnings week after a historic surge, rallying over 180% since April and another 35% following its last earnings beat. Fueled by explosive demand for AI infrastructure, the stock now sits among the top performers in the S&P 500. But with such a steep valuation—42x forward earnings versus its 10-year average of 17x—investors are questioning whether the momentum can continue.
Many analysts remain bullish on Broadcom’s AI exposure. Wall Street expects $1.87 EPS for the fiscal fourth quarter and roughly $17.5 billion in revenue, up sharply from $14.1 billion last year. The AI division remains the crown jewel, projected to generate $6.2 billion this quarter alone, representing a massive 68% YoY increase. Analysts credit Broadcom’s deep involvement in hyperscale computing and its tight integration with Google’s AI ecosystem, especially following the Gemini 3 rollout.
Institutional investors, however, are cautious. Funds like Huntington and Janus Henderson acknowledge Broadcom’s execution but warn that expectations may be excessively high. Last quarter’s rally was driven by Hock Tan’s surprise reveal of a new customer placing $10 billion worth of orders, which pushed the stock to record highs. Without a similar upside catalyst, some analysts fear profit-taking may hit the stock even if earnings meet estimates.
Technical Analysis
On the chart, AVGO recently broke above a major multi-month resistance zone around $385, flipping it into support. The price is trending above the 9-period SMA, showing strong momentum. A sustained hold above $400 opens the path toward the next psychological zone around $450–$500, where the next round of profit-taking may occur.
If sentiment turns risk-off, a retracement back to the $385 demand zone remains likely. For now, structure favors continuation as long as the breakout holds.
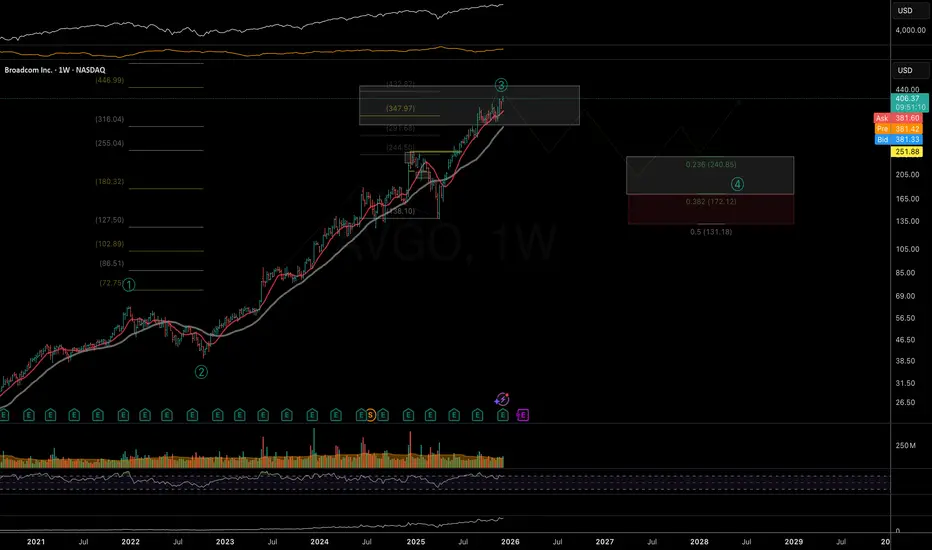
AVGO: at the macro resistance zone Although the initial immediately bullish January setup failed to follow through (see idea from Jan'25) — with price breaking local support and sliding deeper into a complex corrective structure — the broader macro trend structure may have effectively fulfilled itself after reaching major macro resistance levels built since the May bull run.
Chart (Weekly):
There is still not enough confirmation that a macro top is in. The first signs would be price starting to close below the 21DEMA and 50DMA, forming a sequence of lower highs along with bearish EMA convergence (similar to the February ’25 structure).
For now the key question is whether the negative post-market reaction to strong earnings and positive guidance will sustain. If selling pressure persists and price begins to decisively close below the 21EMA, that would increase the odds of a developing reversal. Otherwise, continued dip-buying may push price toward the upper boundary of the macro resistance box near 445.
Previously:
On a bullish macro structure (Jan'25):
On macro resistance zone (Sep 5 and 24):
www.tradingview.com
and
www.tradingview.com
AVGO Cautiously Bullish, but Extended Short-TermAVGO has reclaimed its 50d MA decisively & is riding it upward
After a mild multi-week consolidation, AVGO is breaking out toward prior highs (~$406)
This type of structure (pullback → higher low → reclaim key MA → push toward highs), tends to imply that dip buyers are in control
RSI is rising & sits around the mid-60s, not overbought, but trending strongly
Rising RSI ahead of earnings usually reflects bullish positioning
Stoch is overbought (>90) which often signals short-term exhaustion, not necessarily a reversal, but it does imply that the easy part of the move may already be behind us going into the report
Volume has picked up on green days, suggesting accumulation
No clear signs of distribution into strength
Historically, AVGO tends to run into earnings because it’s seen as a high-quality operator with secular AI-exposure
Breakout attempts near earnings often indicate expectations of a positive guide or at least no negative surprises
Short-term overbought signals could mean the stock is “priced for good news"
If earnings are merely “okay,” the setup allows for a post-earnings shakeout
The stock is sitting near a local resistance shelf, so upside may require a true beat/raise to sustain
Bullish Bias, but vulnerable to sell-the-news
Momentum, structure & accumulation all favor further upside into the event
Because it’s extended on short-term oscillators, any miss or soft commentary could trigger a retrace back toward the 50d (~$370s)
In other words, the trend is up, but the timing (overbought) is tricky
Current options pricing suggests a roughly +/- 6% move in either direction around earnings
In dollar terms (with AVGO near $406), that implies a potential range between ~$382 & ~$430 ($377–$425, depending on exact strike & expiration)
Some more aggressive estimates out of earnings-volatility models go as high as a +/-10% swing (~$365 to $447), though that's more of a “max stress test” than a central expectation
After earnings, the options-market implied volatility (IV) historically drops sharply (the so-called “IV crush”)
For AVGO, average IV contraction post-earnings has been around 19% & that means even if the stock moves in your favor, gains on options may be partially offset by the drop in IV - something to keep in mind if you trade options instead of stock
Implied Move Range) of ~$382-$430 is the “base case” expected range, with more conservative estimates closer to $395-$420
1. Conservative (base-case)
Stock stays near the expected move of $395-$420
In this case it's a likely modest upside or a mild pullback
Risk/reward is relatively balanced with downside maybe slightly larger than upside if market punishes anything less than a strong beat
2. Bullish if earnings impress
Good beat + strong guidance could push toward or exceed the $425-$430
That range would require near-full “realization” of options-market expectations, but is not unrealistic given prior positive earnings reactions & bullish sentiment toward AVGO’s AI/data-center exposure
3. Bearish (“sell-the-news”)
If results disappoint or forward guidance is soft, price could retrace toward $370-$380 (maybe even lower, eventually to 50d MA or support
Because much of the “good news” may already be priced in, downside risk could be nontrivial if expectations aren’t met
Waiting for the first 1-2 days post-earnings may offer a cleaner entry & you might avoid the “volatility junk” to see more “organic” price action
The stock is already fairly “priced for good news”
If the beat is anything less than strong (or forward guidance is conservative), the sell-side could react harshly
Fed interest-rate moves, general market volatility, or weakness in the tech/AI sector could exacerbate downside even if AVGO’s earnings are okay
The “data center/AI infrastructure” theme (a big part of the bullish case) may disappoint if large clients delay orders or macroeconomic headwinds slow demand
NASDAQ:QQQ AMEX:SPY

“AVGO Trading Signal: SHORT | Katy AI Shows Downside MomentumAVGO QuantSignals Katy 1M Prediction 2025-12-08
QuantSignals Katy AI Stock Analysis
Analyzed 1 stock(s): AVGO
AVGO Analysis
Current Price: $401.58
Final Prediction: $397.05 (-1.13%)
30min Target: $397.57 (-1.00%)
Trend: BEARISH
Confidence: 57.5%
Volatility: 16.6%
🎯
TRADE SIGNAL:
Direction: SHORT
Entry: $401.58
Target: $397.96
Stop Loss: $407.60
Expected Move: -1.13%
Summary: Generated 1 trade signals from 1 successful analyses out of 1 symbols.

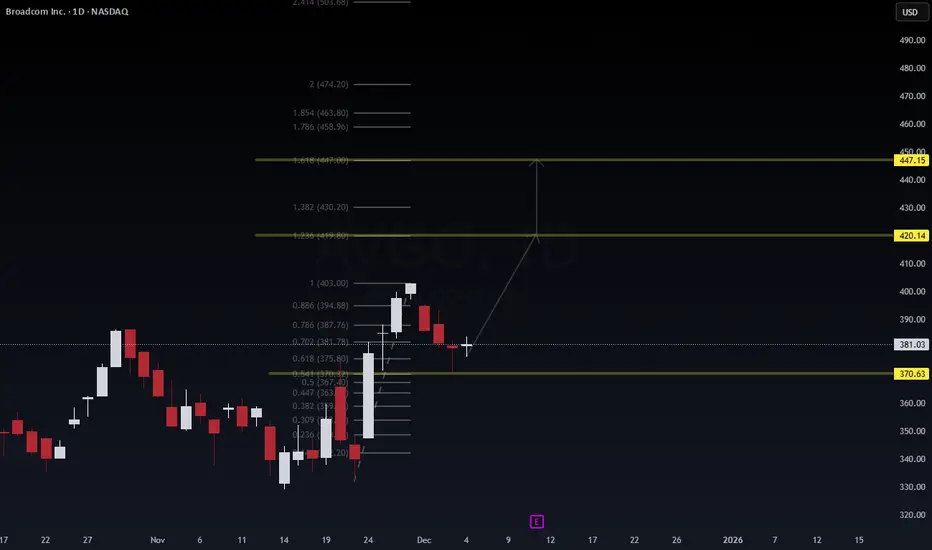
$AVGO — High-Timeframe Liquidity Run Setting UpNASDAQ:AVGO — High-Timeframe Liquidity Run Setting Up 🚀📈
WaverVanir Edge | Quant-Backed View
Price tapped the 0.618 retracement ($375–380 zone) and showed early signs of absorption.
If this level holds, clean imbalance above → magnet at $420.14 (1.236 Fib).
Break + close above $403 triggers the momentum leg.
Ultimate expansion target: $447.15 (1.618 Fib) — the liquidity pocket where HTF algorithms settle.
Risk invalidation: close below $370.63.
Bias: Bullish continuation as long as price respects the golden zone.
📊 VolanX DSS: No trend shift yet — continuation probability intact.
#AVGO #Options #Stocks #Quant #Fibs #WaverVanir
AVGO Breakdown: Price Action Defies Bullish NewsAVGO Weekly Breakdown — Clean Trading Insight
AVGO is in a bearish breakdown despite bullish news and bullish AI predictions.
The price action is telling the real story: sellers are in control.
🔥 Why AVGO PUTs Still Make Sense
1️⃣ Price Action Is Extremely Bearish
Down ~10% today
Down ~4% for the week
Trading at the bottom of the range
Heavy breakdown below VWAP ($396)
This is pure institutional selling — news alone cannot reverse this.
2️⃣ Katy Predicts Up… But Price Is Doing the Opposite
Katy predicts: +10% rise to $403.97
Real price: $366–368
This divergence = short-term AI prediction error due to extreme volatility.
When AI and price action disagree, price action ALWAYS wins short-term.
3️⃣ RSI Oversold in a Downtrend
Oversold RSI (24.6) in a trending bearish move usually signals:
➡️ Continuation lower, not a bounce.
4️⃣ News Is Bullish… But Price Ignores It
Analysts upgraded AVGO to:
$430
$450
$450
Yet AVGO is falling.
This is extremely bearish — institutions are selling despite good news.
5️⃣ Options Flow Is Mixed but Weakening
PCR 0.70 (light bullish)
BUT price collapsing shows calls aren’t being defended
Unusual activity suggests hedging, not real bullish conviction
Flow does NOT match price — another red flag.
🎯 Clean Trade Levels (High Quality)
PUT direction remains valid short-term.
Profit Targets
T1: $15.50
T2: $20.70 (if breakdown accelerates)
Stop Zone
$375+ breakout invalidates bearish setup
Above $380 → bears lose control, trend flips
Keep your stop tight: $7.25
🧠 The Bottom Line
AVGO right now =
**Bearish technicals + bearish momentum + institutional selling
bullish news + bullish AI predictions**
This is a classic bearish divergence setup.
Short-term (1-week window), PUTs remain the stronger probability because:
Strong downtrend
Oversold continuation
Price ignoring upgrades
Breakdown under key support
Expiration next week increases gamma momentum

watching whether the first real demand shows up at 334–331AI revenue growth isn’t enough—AVGO now has to prove durable AI economics (margins + customer concentration + visibility).
VMware remains a headline magnet: packaging/partner shifts (especially in EMEA) are becoming a reputational + churn risk, even while Broadcom tries to “wrap services around” the migration to VCF.
The EU court challenge is a reminder that VMware integration isn’t a fully “closed book” politically, even post-close.

$AVGO, still 75% chance this yellow box will break to downwardsThere’s a 75% probability this yellow box resolves lower.
Broadcom just overshot a channel that has held since 2021. Go back through any chart, any market, any period — and see it yourself.

$AVGO, 75% chance we are to correct 30% or soBroadcom just overshot a channel that has held since 2021. Go back through any chart, any market, any period — and see it yourself.

Broadcom (AVGO) Shares Hit a Record Ahead of EarningsBroadcom (AVGO) Shares Hit a Record Ahead of Earnings
Broadcom (AVGO) shares reached an all-time high ahead of the company’s quarterly results, due this Thursday, supported by strong fundamental drivers:
→ Partnership with Microsoft: Media reports suggest Broadcom is in talks with Microsoft to develop custom AI chips.
→ Analyst optimism: UBS called Broadcom a “top investment” in the AI sector, citing explosive demand for hardware, and raised its price target to $472.
→ Shift in strategy: Market participants believe the company is refocusing on its own chips to win AI hardware market share from Nvidia.
We highlighted additional bullish drivers in our 14 October analysis.
Technical Analysis of AVGO Shares
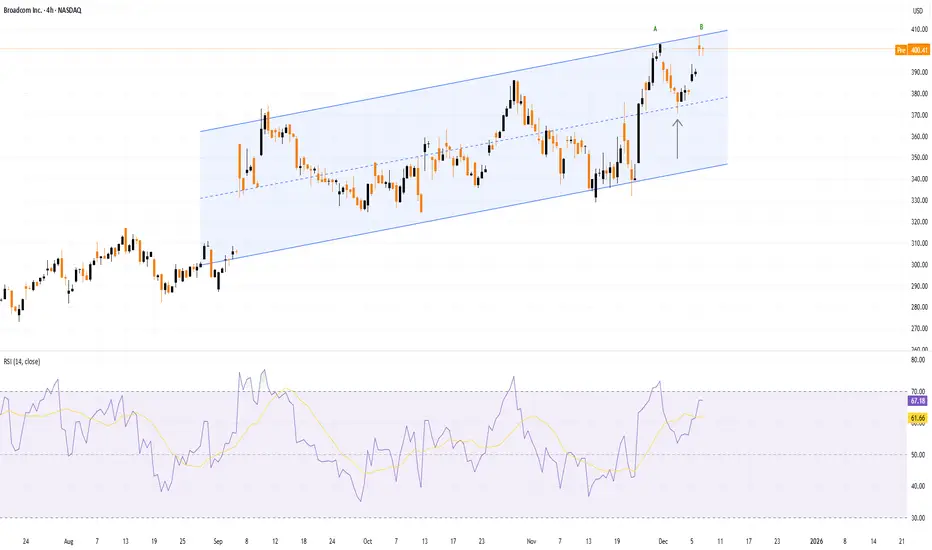
Following a bullish gap on 4 September, price movements have formed an upward channel (shown in blue).
From a bullish perspective:
→ the channel median is acting as support (indicated by the arrow);
→ the wide bullish candle on 24 November signals strong buying pressure;
→ the share is outperforming equity indices.
From a bearish perspective:
→ the AVGO share price is currently near the upper boundary of the channel;
→ the psychological $400 level is showing signs of resistance;
→ at peak B the price rose only slightly above the previous peak A before pulling back – a sign of a potential bull trap.
It is possible that in the coming days, AVGO may show signs of consolidation near the upper channel boundary, while the earnings release could trigger a volatility spike and a large gap, given the market’s elevated expectations.
This article represents the opinion of the Companies operating under the FXOpen brand only. It is not to be construed as an offer, solicitation, or recommendation with respect to products and services provided by the Companies operating under the FXOpen brand, nor is it to be considered financial advice.
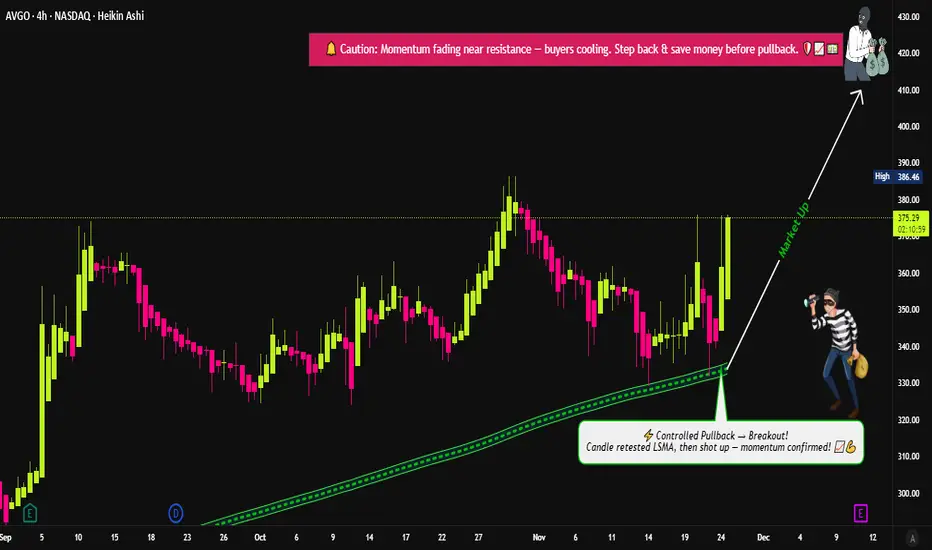
Is Broadcom Setting Up a Clean LSMA Pullback Entry?📈 Trade Setup: AVGO – Broadcom Inc. (NASDAQ)
Plan: Bullish pullback confirmed with LSMA pullback technique. We're looking for a dip towards an LSMA-supported zone to accumulate in multiple layers — the classic “thief” way.
🎯 Entry Strategy (Layered “Thief” Style)
We’re using a layering strategy — placing multiple limit buy orders to spread risk and optimize the entry:
Entry layers: $340, $350, $360 (you can adjust or add more layers depending on your risk appetite)
This allows you to ladder in as price pulls back, increasing your average position in a disciplined way.
🛑 Stop Loss
Thief SL: $1.11100 — this is your safety net.
⚠️ Note: I strongly recommend using your own stop-loss based on your risk tolerance. Don’t rely solely on mine — it’s your capital, your call.
🎯 Target / Take Profit
Target: $420 — this is where the “police barricade” (strong resistance) sits, plus signs of overbought conditions and a potential trap.
Like with the SL — feel free to scale out, take partial profits, or adjust this target based on your own risk/reward strategy.
🔍 Why This Makes Sense
Price pullback into LSMA can offer a sweet entry for momentum to resume.
Layered entries help you average in slowly rather than committing all at once.
The $420 level is a logical take-profit zone: strong resistance + psychological round number + possible overbought trap.
🌐 Related Instruments / Correlated Pairs to Watch
Keep an eye on these names — they often share semiconductor or tech momentum with Broadcom:
NASDAQ:NVDA (NVIDIA) — major player in GPUs / data center, often drives sentiment in the semiconductor space.
NASDAQ:AMD (Advanced Micro Devices) — competing chipmaker; correlated strength/weakness with Broadcom helps validate sector moves.
NASDAQ:SMH (VanEck Semiconductor ETF) — gives you a broader view of semis; if SMH is bullish, AVGO’s move is more likely to be strong.
NASDAQ:INTC (Intel) — though different business model, macro tech trends sometimes ripple through all major semiconductor names.
Key correlation point: when NVDA or SMH rallies hard, Broadcom often catches a lift (or vice versa), so watching these can help validate the trade or act as confirmation.
⚙️ Risk Management & Execution Tips
Use limit orders for entries — no market buys here, we’re layering smartly.
Adjust your position size on each layer — e.g., more size on the first layer if you're confident, smaller on others.
Consider taking partial profits as price approaches $420 to lock in gains while leaving a portion for a possible breakout.
Disclaimer: This is a thief-style trading strategy just for fun. Use it responsibly, manage your risk, and never trade more than you can afford to lose.
✨ “If you find value in my analysis, a 👍 and 🚀 boost is much appreciated — it helps me share more setups with the community!”
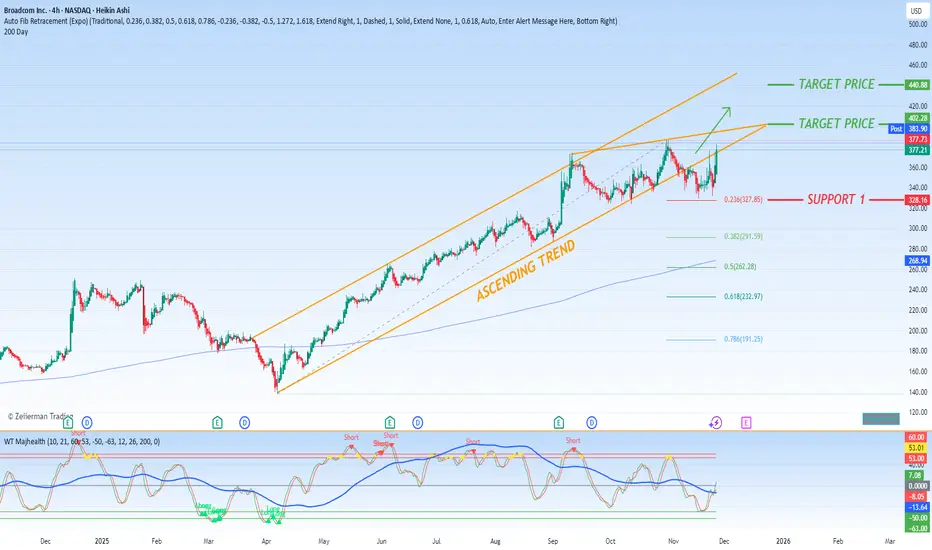
Broadcom Rides the AI Wave, Fueling Nasdaq's AscentSemiconductor titan Broadcom (NASDAQ: AVGO) emerged as a key catalyst driving the Nasdaq Composite significantly higher during a robust trading session for the technology sector. This bullish momentum was fueled by a confluence of positive developments within the artificial intelligence ecosystem, directly benefiting Broadcom's strategic positioning.
The optimism was ignited over the weekend by affirming analyst commentary regarding Alphabet (Google)'s advancements in AI. As a critical supplier of custom networking and AI accelerator chips for Google's data centers, Broadcom stands as a direct beneficiary of the search giant's accelerated investments. This sentiment was further amplified by e-commerce and cloud behemoth Amazon (NASDAQ: AMZN), which unveiled ambitious new plans to commit tens of billions of dollars toward AI infrastructure. Given Broadcom's established role as a supplier for custom silicon solutions, this announcement signals a powerful, forward-looking demand driver for its semiconductor business.
While a segment of the market maintains a prudent long-term perspective, cautiously watching for any potential saturation or deceleration in the torrent of AI capital expenditure, the immediate reaction to concrete, large-scale investment announcements remains overwhelmingly positive. These deals serve as tangible validation of Broadcom's growth trajectory and its entrenched role in the foundational infrastructure of the AI revolution.
Technical Perspective and Price Outlook
From a chart analysis standpoint, Broadcom's technical setup presents a compelling case for continued strength. The stock is demonstrating remarkable resilience, consolidating above a key Fibonacci support level. Specifically, the 0.236 Fibonacci retracement level at approximately $327.85 has acted as a reliable springboard, confirming a strong base of buyer interest at that price point.
This robust foundation, underpinned by powerful fundamental tailwinds, provides a confident outlook for the stock's upward trajectory. Our analysis projects a strong and positive target zone between $400 and $440. Given the potent combination of sector-wide momentum and the company's firm-specific catalysts, we anticipate a high probability that AVGO will challenge and test this target range in the foreseeable future. The confluence of strong fundamentals and a bullish technical structure makes Broadcom a standout contender for continued outperformance.
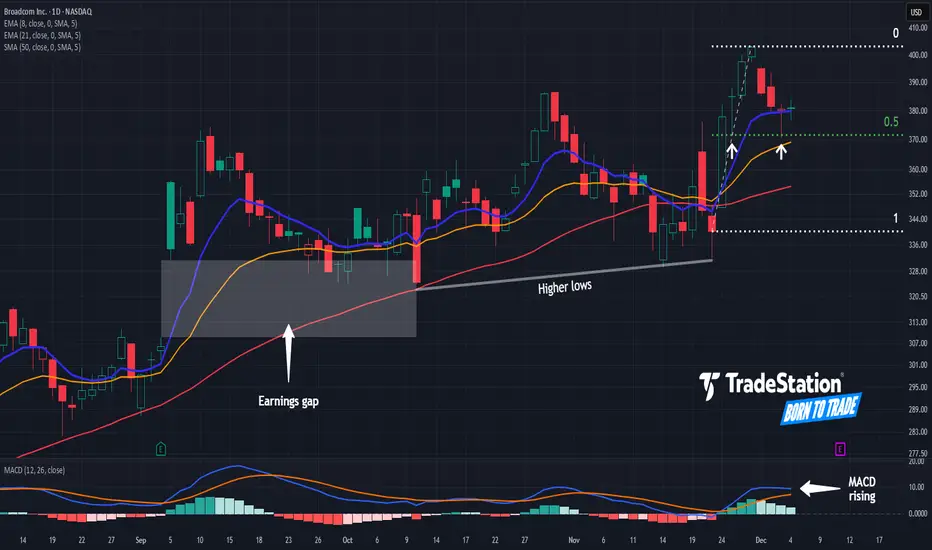
Uptrend in Broadcom? Broadcom hit a new all-time high last week, and some traders may think the chipmaker will continue to advance.
The first pattern on today’s chart is the rally between Friday, November 21, and Friday, November 28. AVGO retraced half the move and bounced, which may suggest its direction remains bullish.
Second, the 8-day exponential moving average (EMA) is above the 21-day EMA. MACD is also rising. Those signals may reflect a positive short-term trend.
Third, strong quarterly results propelled the stock upward on September 5. AVGO never filled the bullish gap, which may suggest buyers outnumber sellers.
Next, you have the series of higher lows in October and November. That could also reveal accumulation of the stock.
Finally, AVGO is an active underlier in the options market. (Its average volume of 260,000 contracts ranks 14th in the S&P 500, according to TradeStation data.) That may help traders take positions with calls and puts.
TradeStation has, for decades, advanced the trading industry, providing access to stocks, options and futures. If you're born to trade, we could be for you. See our Overview for more.
Past performance, whether actual or indicated by historical tests of strategies, is no guarantee of future performance or success. There is a possibility that you may sustain a loss equal to or greater than your entire investment regardless of which asset class you trade (equities, options or futures); therefore, you should not invest or risk money that you cannot afford to lose. Online trading is not suitable for all investors. View the document titled Characteristics and Risks of Standardized Options at www.TradeStation.com . Before trading any asset class, customers must read the relevant risk disclosure statements on www.TradeStation.com . System access and trade placement and execution may be delayed or fail due to market volatility and volume, quote delays, system and software errors, Internet traffic, outages and other factors.
Securities and futures trading is offered to self-directed customers by TradeStation Securities, Inc., a broker-dealer registered with the Securities and Exchange Commission and a futures commission merchant licensed with the Commodity Futures Trading Commission). TradeStation Securities is a member of the Financial Industry Regulatory Authority, the National Futures Association, and a number of exchanges.
Options trading is not suitable for all investors. Your TradeStation Securities’ account application to trade options will be considered and approved or disapproved based on all relevant factors, including your trading experience. See www.TradeStation.com . Visit www.TradeStation.com for full details on the costs and fees associated with options.
Margin trading involves risks, and it is important that you fully understand those risks before trading on margin. The Margin Disclosure Statement outlines many of those risks, including that you can lose more funds than you deposit in your margin account; your brokerage firm can force the sale of securities in your account; your brokerage firm can sell your securities without contacting you; and you are not entitled to an extension of time on a margin call. Review the Margin Disclosure Statement at www.TradeStation.com .
TradeStation Securities, Inc. and TradeStation Technologies, Inc. are each wholly owned subsidiaries of TradeStation Group, Inc., both operating, and providing products and services, under the TradeStation brand and trademark. When applying for, or purchasing, accounts, subscriptions, products and services, it is important that you know which company you will be dealing with. Visit www.TradeStation.com for further important information explaining what this means.
AVGO — [2D] WEEK 49 TREND REPORT | 12/04/2025AVGO — WEEK 49 TREND REPORT | 12/04/2025
Ticker: NASDAQ:AVGO
Timeframe: 2D
This is a reactive structural classification of AVGO based on the weekly chart as of this timestamp. Price conditions are evaluated as they stand — nothing here is predictive or forward-assumptive.
⸻
1) Current Trend Condition [ Numbers to Watch ]
Current Price @ 381
• Trend Duration : +228 Days ( Bullish )
• Weekly Trend Reversal Level ( Bearish ) @ 363.53
• Weekly Trend Reversal Level ( Bearish Confirmation ) @ 322
• Pullback Support @ 320
• Correction Support @ 255
⸻
2) Structure Health
• Retracement Phase:
Uptrend (operating above 78.6%)
• Position Status:
Healthy (price above both structural layers)
⸻
3) Temperature :
Warming Phase
⸻
4) Momentum :
Bullish
⸻
Author’s Note
UPWARD STRUCTURAL ALIGNMENT
This mark reflects a point where market behavior supported the continuation of the existing upward direction. It does not imply forecasting or targets — it simply notes where strength became observable within the current trend. Its meaning holds only while price continues to respect the broader structural levels that define the trend.
⸻
Methodology Overview
This classification framework evaluates directional conditions using internal trend-interpretation logic that references price behavior relative to its structural layers. These relationships are used to identify when price movement aligns with the framework’s criteria for directional phases, transition points, or regime shifts. Visual elements or structural labels reflect these internal interpretations, rather than explicit trading signals or preset indicator crossovers. This framework is observational only and does not imply future outcomes.

$AVGO [Broadcom Inc.]The compounder NASDAQ:AVGO has declined almsot 20% from ATHs. The stock is trading around $325 as we speak, currently testing the 100 SMA, if it breaks below, a gap could be filled around $310:$300.
Keys:
A disparity between the trailing P/E of 71 and the anticipated forward 24x suggests that the company is expecting a massive earnings boom.
PEG of 0.69 is suggesting an undervalued stock price to its growth.
A fortress balance sheet with a profit margin of 36.20% & gross margin of 64,71% & EPS next y of 38,21%

Is AVGO’s drop over yet?Oracle AVGO — Price Analysis
Chart A (Daily):
Price had been oscillating within an 80-day channel, and after failing to reach the channel’s upper boundary due to repeated divergences, it finally broke below the bullish channel with two strong, high-volume daily candles—the highest selling volume seen on this chart in the past 68 days—and closed below the channel.
Chart B (4H):
This structure is also visible on the 4-hour chart as a wedge pattern, where price initially experienced a fake breakout to the upside and has now broken the lower boundary of the wedge.
Outlook:
This corrective move could potentially continue at least to the gap zone highlighted on the chart, which is a significant gap, and possibly extend further to the support zone at the lower end of the extended channel. Once price reaches these areas, we should watch for potential reactions.
Note: This analysis will be updated as the situation develops.
Follow me on TradingView for more analyses and live stock trades.
NASDAQ:AVGO

AVGO: mid-term trend structure If price is to hold above 209-198 area of support, next resistance zones are: 287-303 and 320-330-360.
Macro trend structure also assumes higher targets for the uptrend since 2022 bottom (Monthly):
Thank you for your attention!

AVGO Earnings Signal Breakdown: High-Risk Binary SetupAVGO Earnings Signal | 2025-12-11
Primary Recommendation: BUY PUTS
Conviction: 55% (Low–Medium)
Reason: Katy AI shows consistent bearish pressure despite composite model suggesting calls.
🧠 Why PUTS? (Key Evidence)
Katy AI Prediction
Predicts 0.5%–1.2% downside into the next session
85% of 420 predictions are below current price
Multiple targets near $400–401
Overbought technicals + bearish intraday momentum
Technical Setup
Current price: $405.5
Daily range: $394–$414 (trading near top)
Stochastics: 95+ (extremely overbought)
Light volume = weak support at highs
Options Flow & IV
PCR: 1.13 → mild put bias
IV: 150–210% → earnings volatility extremely high
OTM puts show unusual activity
💰 Trade Setup
Instrument: AVGO 400 PUT
Expiry: 12/12 (1-day)
Entry: $6.05 – $6.15
Target 1: $9.08
Target 2: $12.10
Stop Loss: $4.84
Position Size: 2% portfolio (high-risk)
Risk Level: 🔴 HIGH
⚠️ Risk Notes
1-day expiry → extreme theta decay
Earnings → binary outcome
Composite model shows CALL, but Katy AI + technicals favor PUT
IV crush will be severe after earnings
📝 Quick Summary
Overbought AVGO + bearish Katy AI + high IV + weak volume → short-term downside probability higher.
PUTS are the asymmetric play, but risk is high.

AVGO Pre-Earnings Call Setup: High-Conviction Bullish Play Amid AVGO Earnings Signal | 2025-12-10
Trade Setup:
Direction: BUY CALLS (LONG)
Confidence: 65% (Medium)
Expiry: 2025-12-12 (2 days)
Strike: $407.50
Entry Price: $13.40
Target 1: $20.10 (50% gain)
Target 2: $26.80 (100% gain)
Stop Loss: $8.04 (40% loss)
Position Size: 3% of portfolio (reduced due to Katy conflict)
Price & Trend:
Current Price: $406.32
24h Move: +3.98%
Trend: Bullish (Composite score +3.2)
Volatility: 117.5% IV
Overbought Level: Stochastics 96.2
Analysis Summary:
Katy AI Signal: Neutral with slight bearish bias (-0.76% predicted move), 50% confidence
Technical: Strong pre-earnings rally, multi-timeframe bullish confirmation (100%)
News: Positive catalysts – new private cloud tech, AI chip demand momentum
Options Flow: Bearish PCR 1.44 (institutional hedging), retail call activity present
Risk Level: Medium-High – high IV, Katy conflict, overbought conditions
Key Notes:
Monitor earnings release closely
Conservative sizing recommended due to Katy AI conflict
Tight stop loss essential to manage potential pullback
