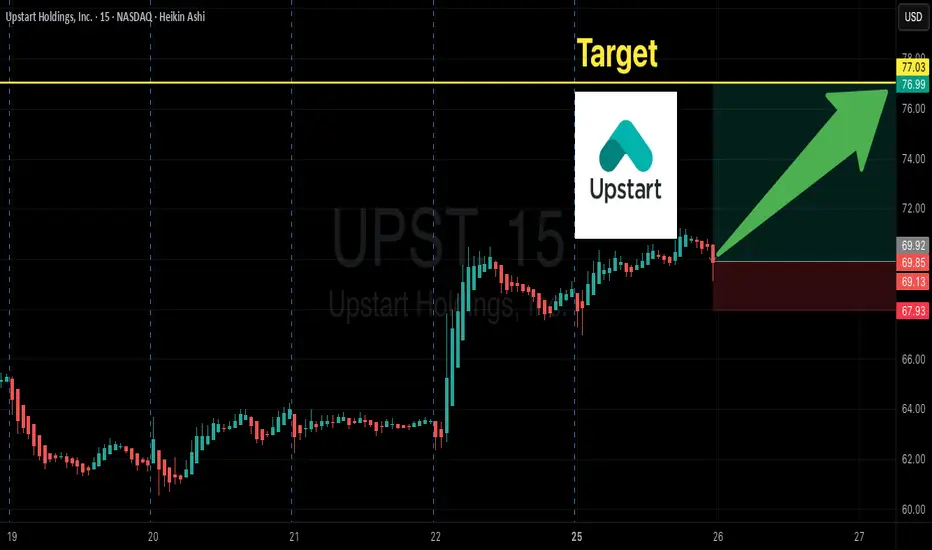
UPST Ready to Rip? | $77C Swing Setup
# 🚀 UPST Swing Trade Idea | \$77C Sept 5 | Momentum Setup 💎
📊 **Bias**: Moderately Bullish (5–10d swing)
✅ Short-term trend +9.1% (5d)
✅ RSI rising + low VIX (\~14)
✅ \$77C flow = institutional activity (1681 vol / 1565 OI)
⚠️ Weak link = no volume breakout yet (1.0x avg)
---
### 💡 Trade Setup
* 🎯 **Instrument**: UPST
* 🔀 **Direction**: CALL (long)
* 💵 **Strike**: 77.00
* 📅 **Expiry**: 2025-09-05 (11d)
* 💰 **Entry**: 0.97
* 🛑 **Stop**: 0.58
* 🎯 **Targets**:
• +50% = \$1.46 (scale)
• +100% = \$1.94 (final)
---
### ⚡ Risk Notes
* Keep size **small** (1 contract, \~1–2% risk)
* **Theta risk** → must move fast, exit early if no vol pickup
* News tape can flip momentum fast
---
🔥 **Consensus**: Multi-model majority = Buy \$77C now for a 5–10 day swing. Small, tight, and momentum-dependent.
---
### 📌 Tags
\#UPST #OptionsTrading #SwingTrade #Bullish 📈🚀🔥
UPST trade ideas
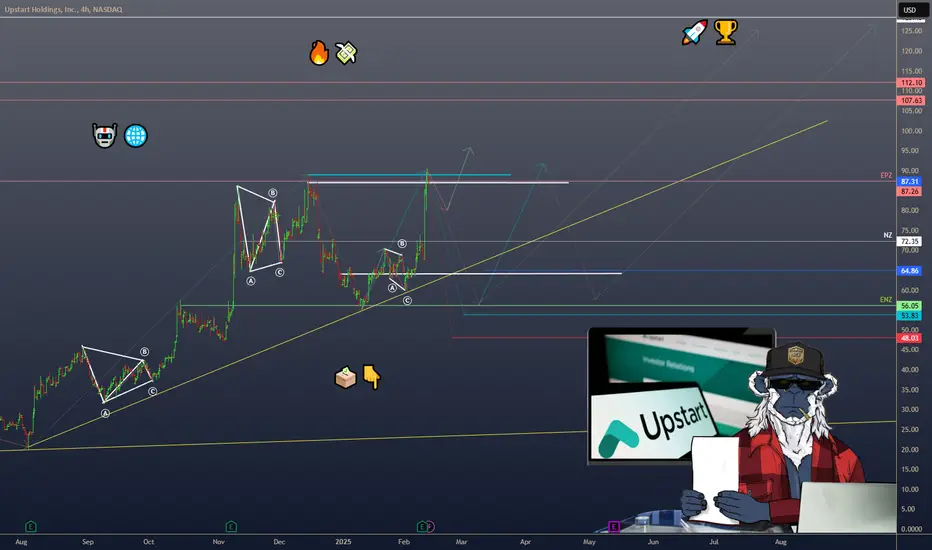
UPST –61.5 Support Holding, Watch Reclaim of 68.6 → 77.3 → 91.4Summary
Upstart (UPST) delivered a strong earnings beat: EPS surprise +41% ($0.36 vs $0.254 est.) and revenue surprise +14% ($257M vs $225M est.). Despite the beat, the stock sold off into a key support zone (61–63). Technically, UPST is forming a Cup & Handle pattern on the weekly chart. The current pullback may represent the “handle” phase, setting up for a continuation toward the previous high 91.4.
🔍 Technical Analysis
Cup & Handle:
Cup formed between $31.6 and $91.4.
Handle in progress, with price retesting Fib 0.5 (~$61.5) and rising trendline.
Fibonacci Levels (31.6 → 91.4 move):
0.236 = $77.3 → major resistance/handle breakout trigger.
0.382 = $68.6 → must-reclaim level to flip back bullish.
0.5 = $61.5 → current support + trendline.
0.618 = $54.5 → next support if $61 fails.
Indicators:
RSI cooled to ~40, watch for rotation upward on reclaim of $68.
MACD still red but flattening, potential for bullish cross if bounce confirms.
Stochastics oversold, primed for reversal.
Volume: Pullback volume lighter than earnings spike = constructive for a re-accumulation handle.
🎯 Trade Setup
Scenario A – Reversal from Support (higher risk, better R:R):
Entry: $63–61 with confirmation (higher lows, intraday reversal).
Stop: < $59.5 (below Fib 0.5 & trendline).
Targets: T1 $68.6, T2 $74, T3 $77.3.
Scenario B – Confirmation Breakout (conservative):
Trigger 1: Daily close > $68.6 with volume ≥ 1.5× 20D avg.
Trigger 2: Weekly close > $77.3 (handle breakout).
Stop: below reclaimed level (e.g., < $66.8 after $68.6 reclaim).
Targets: T1 $77.3, T2 $84–86, T3 $91.4 (prior high), T4 $98–102 (Fib ext).
Invalidation: Weekly close < $61.5 weakens the bullish Cup; below $54.5 negates the setup.
📈 Fundamental Context
Earnings: Beat on EPS (+41%) and revenue (+14%) supports the bull case.
Macro Sensitivity: Business tied to credit cycles and interest rates. Stabilizing/declining rates and stronger securitization = tailwinds. Rising defaults or tighter funding = risks.
Catalysts: Monitoring partner funding updates, loan volume guidance, Fed policy signals.
✅ Execution Notes
Only take entries on support confirmation or breakout with volume.
Scale out at targets; move stop to breakeven after T1.
Manage size carefully—UPST is high-beta and volatile.
TL;DR
UPST pulled back post-earnings into Fib 0.5 + trendline (~$61.5). If support holds and $68.6 is reclaimed → upside toward 77.3 → 91.4. Break below $61.5 opens risk to $54.5. Constructive Cup & Handle continuation setup, but needs confirmation.

UPST Bear Breakdown Incoming! Put Strike $58
# ⚡ UPST Swing Alert – 2025-08-15 ⚡
**Sentiment:** Moderate Bearish
**Setup:** Put Option Trade
---
## 📉 Market Snapshot
* **Daily RSI:** <45 → Bearish momentum
* **5 & 10-Day Trend:** Negative → Confirmed downtrend
* **Volume:** Avg (1.0x) → Weak breakout confirmation
* **Call/Put Ratio:** 1.00 → Neutral
* **VIX:** Favorable low volatility for controlled downside
---
## ⚖️ Consensus & Conflicts
**Agreement:**
* Bearish momentum confirmed across models
* Structural weakness supported by multi-timeframe negative performance
* VIX favors swing execution
**Disagreement:**
* Timing & execution vary: some models recommend immediate puts, others await volume confirmation or breakdown
* Strike selection differs slightly (\$58 vs \$61)
---
## 🎯 Trade Setup – UPST PUT
**Entry Condition:** Confirm bearish breakdown at market open
**Strike:** \$58.00
**Expiration:** 2025-08-29
**Entry Price:** \$1.00
**Confidence:** 72%
**Profit Target:** \$2.00 (100% gain)
**Stop Loss:** \$0.60 (≈40% of premium)
**Key Risks:**
* Corporate developments (e.g., convertible notes) may alter price direction
* Sudden bullish reversals or volume spikes
---
## 📝 TRADE DETAILS (JSON)
```json
{
"instrument": "UPST",
"direction": "put",
"strike": 58.0,
"expiry": "2025-08-29",
"confidence": 0.72,
"profit_target": 2.00,
"stop_loss": 0.60,
"size": 1,
"entry_price": 1.00,
"entry_timing": "open",
"signal_publish_time": "2025-08-15 16:14:27 UTC-04:00"
}
```
---
## 📊 Quick Reference – TradingView Ready
🎯 **Instrument:** UPST
🔀 **Direction:** PUT (Short)
💵 **Entry Price:** \$1.00
📈 **Profit Target:** \$2.00
🛑 **Stop Loss:** \$0.60
📅 **Expiry:** 2025-08-29
📏 **Size:** 1 contract
⏰ **Entry Timing:** Market Open
🕒 **Signal Time:** 2025-08-15 16:14 EDT
---
### Suggested Viral Title & Tags:
**🔥 UPST Bearish Swing Alert: Put Strike \$58 Ready ⚡**
\#UPST #SwingTrade #OptionsTrading #Bearish #PutOption #Momentum #TradeSetup #TechnicalAnalysis #StockAlerts #Finance #TradingSignals #MarketWatch #ShortTrade

Mid-Week SPX Check, Another Wait & See Moment!TLDR...or TLDW ;)
If SPX holds above the 20 EMA and reclaims that short-term uptrend, this could have been just be another orderly pullback in a rising market.
If it crosses back under the 20 EMA and closes below, I’d watch for a move toward the 50 SMA (about 6,255).
My stocks, the indices (Dow, Nasdaq, SPX), were met with buyers midday, and even if we roll over, that is expected.
My hourly charts on my trading list do show potential setups for my retest strategy (similar to how you'd trade a pullback on a run up), and I'd like to see the market follow through with weakness as a whole.
So we wait.
Cheers,
Emanuela

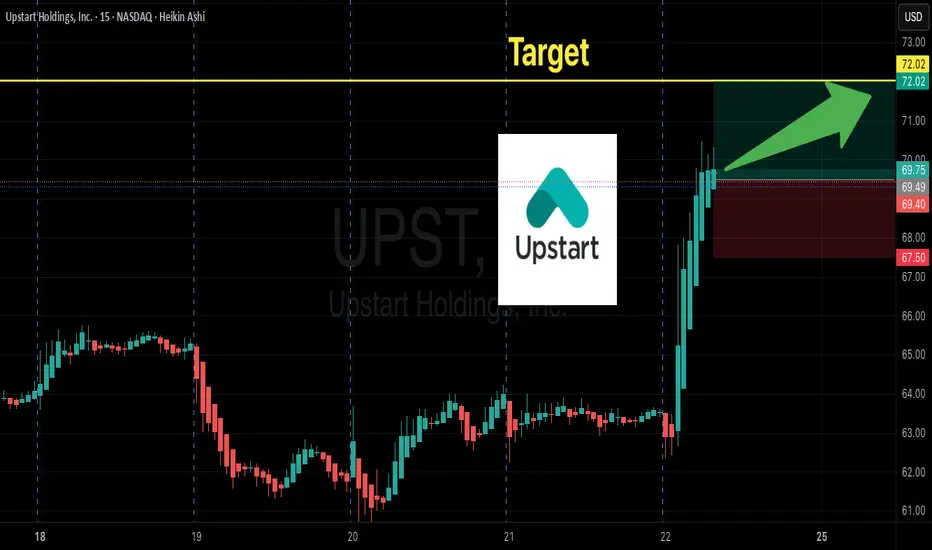
UPST Call Setup — Momentum Heating Up!🚀💎 UPST Swing Trade Alert — Call Setup for Quick Gains!
📊 Consensus Recap
✅ Momentum: Short-term bullish (5–10 day)
⚠️ Volume: Weak → caution needed
📈 Sentiment: Mixed but leaning bullish
🎯 Trade Setup
🔀 Direction: CALL (LONG)
🎯 Strike: $72.00
💵 Entry: $2.60
🎯 Profit Target: $4.50
🛑 Stop Loss: $1.70
📅 Expiry: 2025-09-05
📈 Confidence: 65%
⏰ Timing: Market Open
UPST Possible Cup & Handle BreakoutI'm watching NASDAQ:UPST for a potential breakout from the Handle portion of a the Cup& Handle pattern. Feds are closer to lowering rates which have held down this stock. I will enter Call options to $100 if we close above the Handle resistance line.

UPST watch $67.57-68.55: Major Support might hold earnings DUMPUPST earnings were apparently not pleasing to the Street.
We got a bull trap then a dump to support zone at $67.57-68.55
Looking support to hold and Break-n-Retest to start adding longs.

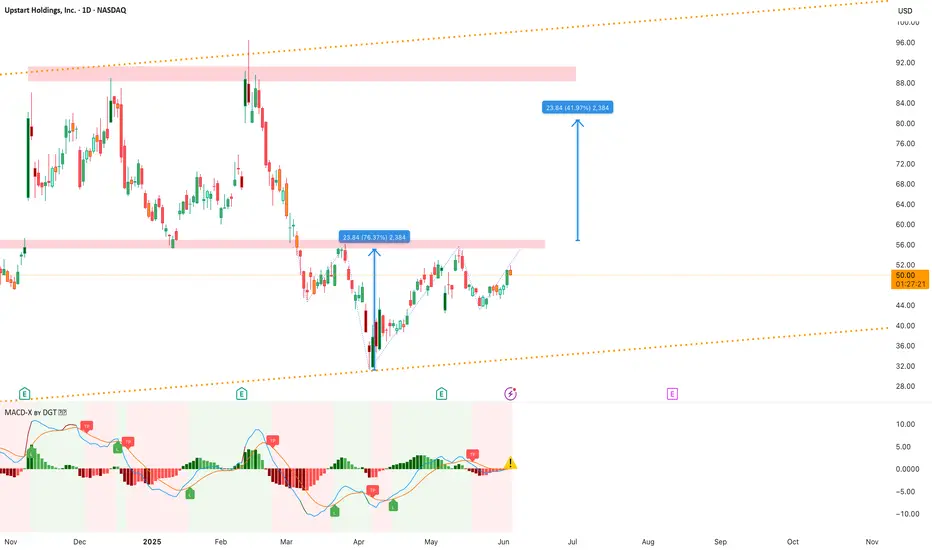
Upstart Holdings – Cup Bottom and Ascending Channel Setup📊 General Overview
- The stock is currently trading at $50.07 , showing a -1.79% daily loss.
- The price is moving within an ascending channel (orange dotted lines), suggesting a long-term uptrend.
- A strong rebound since the April 2025 bottom stands out, with a 76.37% rise from lows.
🔍 Chart Patterns & Indicators
🟥 Resistance Zones and Price Targets
- The $55 range (pink zone) is acting as a strong resistance.
- A breakout above this zone may repeat the previous move upward ( $23.84 gain / +41.97% ), targeting the $80 level.
🔻 Reverse Head and Shoulders Recovery Pattern
- The sharp drop and rapid rebound formed a V-bottom, often signaling strong reversals and bullish momentum.
- This is reinforced by increasing higher lows since April.
📈 Ascending Channel
- The price is clearly respecting the ascending channel boundaries.
- The lower orange dotted line acts as dynamic support, while the upper line may - define the next ceiling near $95–100 .
📊 MACD Indicator (Momentum)
- The MACD lines are about to cross upward in the positive region—an early bullish momentum signal.
- However, a yellow warning symbol indicates possible caution due to increased volatility or overbought conditions.
🎯 Strategy & Expectations
- The $50–55 area is a critical resistance zone to watch.
- A successful breakout above $55 could technically extend the move toward $80 .
- Confirmation from MACD and volume spikes would strengthen the bullish case.
- A stop-loss below $45 can be considered if the price gets rejected again at resistance.
Upstart wanna get startedNASDAQ:UPST is ready to go... forming an inverted head and shoulder on the daily and testing the neckline. nuff said

UPST Classic BUMBUM ReversalNASDAQ:UPST Classic Bumbum is a new term and I will probably file copyrights to it 😃
UPST has attempted to breakout of a cup and handle twice on the weekly chart and failed.
The second attempt is extended and recently broke upward from the handle.
The Bumbum simultaneously formed a saucer formation in the process which is a bullish reversal trend.
With increasing volume and momentum and favorable market conditions I expect this to to easily scale the immediate resistance of $59, then to $85. At $85 there is probably a pullback to the $70is range before any catalyst could push it beyond $85 to the $120 range.
With the fundamentals of the company aligning favorably, this is a long term buy.

UPST( Upstart Holdings Inc. ) - Great chance take 10 % ?NASDAQ:UPST 🔹 Current Price: $53.56
🔹 Candlestick Pattern: A candle resembling an inverted hammer has formed — this may signal potential weakness from buyers or a possible reversal after an upward move.
🔹 Technical Channel: The price is moving within an ascending channel. Target level is marked around $59.96 (+10.41% in 6 days).
🔹 Indicators:
• Bollinger Bands show price nearing the upper band, which can indicate overbought conditions.
• Stochastic RSI is approaching overbought territory (>50), suggesting a potential pullback.
🔹 Volume: Volume remains moderate with no significant spikes.
Conclusion:
UPST is showing a short-term bullish trend, but the appearance of an inverted hammer suggests caution. A pullback to the midline of the channel ($50–51) is possible before a potential continuation higher.

Upstart Stock Chart Fibonacci Analysis 061025Trading Idea
1) Find a FIBO slingshot
2) Check FIBO 61.80% level
3) Entry Point > 58/61.80%
Chart time frame:C
A) 15 min(1W-3M)
B) 1 hr(3M-6M)
C) 4 hr(6M-1year)
D) 1 day(1-3years)
Stock progress:B
A) Keep rising over 61.80% resistance
B) 61.80% resistance
C) 61.80% support
D) Hit the bottom
E) Hit the top
Stocks rise as they rise from support and fall from resistance. Our goal is to find a low support point and enter. It can be referred to as buying at the pullback point. The pullback point can be found with a Fibonacci extension of 61.80%. This is a step to find entry level. 1) Find a triangle (Fibonacci Speed Fan Line) that connects the high (resistance) and low (support) points of the stock in progress, where it is continuously expressed as a Slingshot, 2) and create a Fibonacci extension level for the first rising wave from the start point of slingshot pattern.
When the current price goes over 61.80% level , that can be a good entry point, especially if the SMA 100 and 200 curves are gathered together at 61.80%, it is a very good entry point.
As a great help, tradingview provides these Fibonacci speed fan lines and extension levels with ease. So if you use the Fibonacci fan line, the extension level, and the SMA 100/200 curve well, you can find an entry point for the stock market. At least you have to enter at this low point to avoid trading failure, and if you are skilled at entering this low point, with fibonacci6180 technique, your reading skill to chart will be greatly improved.
If you want to do day trading, please set the time frame to 5 minutes or 15 minutes, and you will see many of the low point of rising stocks.
If want to prefer long term range trading, you can set the time frame to 1 hr or 1 day.

UPST: THE ART OF WAITINGUPST: THE ART OF WAITING
Stock investing or speculating is, in fact, a simple task. Most of the time, you just wait — and act only when the timing is right.
.
US STOCKS- WALL STREET DREAM- LET'S THE MARKET SPEAK!

UPST eyes on $50: Round number reinforced by Fibs will be toughUPST up against serious resistance around $50 round.
$50.07-51.09 is the exact zone that bulls must break.
Look for a Break and Clean Retest (Ping) of top bound.


UPST at a Crossroads: Breakdown or Bounce?Trend Overview
UPST has been trading within a rising channel since mid-2023 but is now testing key support levels.
The stock is currently at $53.69 (-3.23%), indicating a potential breakdown if support fails at $49.
Key Levels to Watch
Support Levels:
$49.75 - $44.18 → Critical zone (Break below could trigger a move to $31.87)
$31.87 → Long-term support (Last major demand zone)
Resistance Levels:
$64.15 → First level to reclaim
$78.35 → Strong resistance within the channel
$96.43 → Key breakout zone
Bearish Signs:
The price is testing lower channel support.
If $49 fails, next downside targets are $44 and $31.
Bullish Hope?
Closing and Holding above $54 could trigger a recovery.Reclaiming $64+ is crucial for any bullish trend reversal.
Verdict:
Below $49 → High risk of further downside.
Above $64 → Bulls regain strength.
Watching $44-$49 zone for potential reversal or breakdown confirmation.

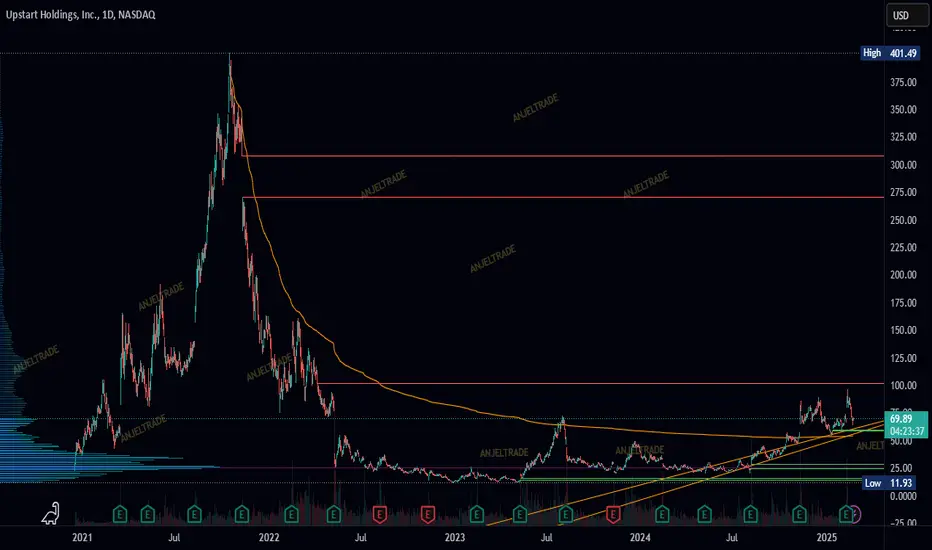
$UPST down 50% is in correction territoryEarlier in this space on 13 Feb 2025 we have discussed the resurgence of the Fintech sector and the base building of the famous fintech ETF form Ark investments $ARKF. Many Fintech stocks like NASDAQ:HOOD , NASDAQ:COIN , NASDAQ:PYPL , NYSE:XYZ etc had a great Nov 2024 to Jan 2025. The story was the same for the fintech stock Upstart which had an AI component in it. The AI-based lending platform was up almost 180% last year with 95 $ as an ATH. But since then, the correction in S&P and NASDAQ has been unforgiving for stocks like $UPST.
Upstart is down 50% in this correction phase and below its 20, 50 and 100-Day SMA. But it is still above its 200-Day SMA. In technical analysis, we would say that as long as the previous tops which act as support holds then we can remain bullish on the stock. This sentiment washout for NASDAQ:UPST might be coming to its end. As long as the stock is above the 200-Day SMA of 48 $ and consolidating here the strategy is to go long $UPST.
NASDAQ:UPST long above 48 $.

UPST 58 coming by next ER?UPST What a journey it has been with AI theme to tie up with traditional banking system. It has so many gaps that are still needed to be filled. Long way to go for repair. $58 downside target is a crucial one with 74 resistance
UPST -- BullishUPST -- Bullish
Weekly trade setup based on technical and fundamentals with a bullish general market

UPST: Shorting Short term shorting. It might go up a little, but does not matter. Will keep it couple of days max.
My post are not investment or trading advises do your own analysis. I am not reponsible for you r losses.

UPSTART ($UPST): AI-DRIVEN LENDING ON THE RISEUPSTART ( NASDAQ:UPST ): AI-DRIVEN LENDING ON THE RISE
1/8 – REVENUE & EARNINGS BLAST
• Q4 2024 revenue: $219M (+56% YoY) 🔥
• Powered by a 68% jump in loan originations 💸
• EPS: $0.26, beating estimates by $0.30 (analysts expected -$0.04) 🚀
• Positive Adj. EBITDA—Upstart’s inching closer to sustained profitability 🏆
2/8 – BIG FINANCIAL EVENTS
• Strong focus on AI model innovation + expanding funding supply 🤖
• Management bullish on earnings call—AI improvements = growth catalyst 🚀
• Renowned for bridging lenders & borrowers via advanced, automated credit assessments 🌐
3/8 – SECTOR COMPARISON
• Some valuation measures say overvalued (e.g., GF Value ~$28 vs. market ~$65) 🧐
• Outpacing fintech peers like SoFi, PayPal, Ally in revenue growth 📈
• Profitability & multiples (P/E, P/S) lag behind due to recent net losses 😬
• Unique AI-lending angle may justify a premium—if it pays off 💡
4/8 – RISK ASSESSMENT
• Partner Dependence: A few big lenders = high exposure ⚠️
• Economic Sensitivity: Loan defaults rise if consumer conditions worsen 🌪️
• Regulatory Hurdles: Shifting financial rules could dent operations 🏛️
• Credit Risk: Holding loans on the balance sheet—watch out in downturns 💥
5/8 – SWOT HIGHLIGHTS
Strengths:
• Advanced AI for credit analysis 🤖
• High automation in approvals ⚡️
• Scalable via partner expansions 🌍
Weaknesses:
• Limited operating history ⏳
• Recent financial losses 📉
• Reliance on key partners 🤝
Opportunities:
• New loan products (auto, HELOC, etc.) 🚗🏠
• Expanding digital lending market 🌐
• Gaining market share as AI evolves 🔬
Threats:
• Fierce fintech competition 🏁
• Possible regulatory changes ⚖️
• Macro headwinds affecting credit demand 🌩️
6/8 – UN/UNDERVALUATION DEBATE
• Some see big future potential → undervalued by growth prospects 💹
• Others worry about multiples & an over-reliance on economic upswings 😬
• Recovery depends on broader economic rebound & strong risk management 🏦
7/8 Is Upstart a gem or a risk?
1️⃣ Bullish—AI lending will transform fintech 🏅
2️⃣ Cautiously Optimistic—Need more stability 🤔
3️⃣ Bearish—Valuation & macro risks are too high 🚫
Vote below! 🗳️👇
8/8 – STRATEGY WATCH
• Keep tabs on new loan products & partnerships 🛠️
• Monitor economic indicators (defaults, credit demand) impacting revenue 💼
• Regulatory shifts can either boost or bury AI-lending advantage ⚠️
Down With UPSTARTWe can see on the RSI, MACD, and Stochastic that UPSTART holdings is facing heavy selling pressure in the near term.
We have provided 33, 50 and 66 % retracement levels to provide levels of interest.
Price will most likely return to test the 5day support at the gaussian channel to total a 55% drop.
$45.00 and $40.00 are our levels of interest.

Possible swing higherLook like we are in the next wave. Look for bullish divergence to form before entering.
