Bitcoin Cash BCH price analysisThis idea is probably more for ancient #BCH holders, because the coin is slow)
They have been accumulated for a year and does not allow it to fall much below $300.
🔝 If this trend continues, then sooner or later, but still #BitcoinCash at $1500 will be seen again)
P.S:
If you like this project, then just in case, put a “bucket” to buy OKX:BCHUSDT at $190-200 for the coming days)
_____________________
Did you like our analysis? Leave a comment, like, and follow to get more
BCHUSDT trade ideas

BCH USDT#Bitcoin Cash ( SET:BCH ) – Cup and Handle
The BCH chart is forming a Cup and Handle pattern, a strong technical indicator signaling a potential bullish reversal. This pattern illustrates a period of accumulation followed by a pullback, forming a rounded bottom, and is now gearing up for a potential breakout to the upside.
T: $832.2 🔥

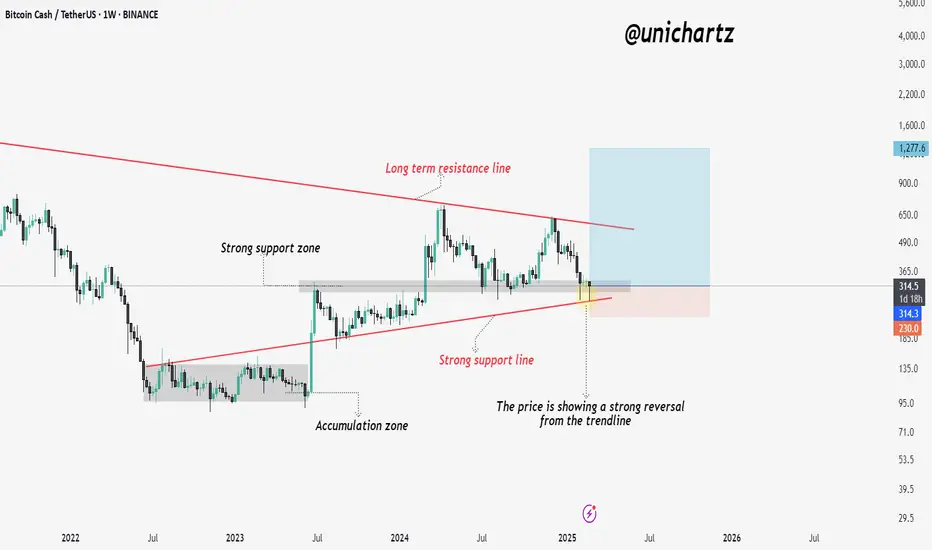
Bitcoin Cash at Critical Trendline – Next Big Move?Bitcoin Cash (BCH/USDT) is currently showing signs of a strong reversal after testing a key support zone and the ascending trendline. This level has acted as critical support in previous price cycles, making it an important area to watch.
The price has rebounded from the strong support line, which aligns with the accumulation zone from early 2023. Additionally, BCH remains within a long-term descending channel, with the upper resistance line acting as a ceiling for previous bullish moves.
bch midterm sell limit"🌟 Welcome to Golden Candle! 🌟
We're a team of 📈 passionate traders 📉 who love sharing our 🔍 technical analysis insights 🔎 with the TradingView community. 🌎
Our goal is to provide 💡 valuable perspectives 💡 on market trends and patterns, but 🚫 please note that our analyses are not intended as buy or sell recommendations. 🚫
Instead, they reflect our own 💭 personal attitudes and thoughts. 💭
Follow along and 📚 learn 📚 from our analyses! 📊💡"

Bitcoin Cash Quintuple Bottom & $2,595 2025 All-Time High TargetBitcoin Cash just tested our 2025 baseline for the fifth time this week. This action gives us a long-term quintuple bottom. A clear establishment of long-term support.
Good afternoon my fellow Cryptocurrency trader, I hope you are having a wonderful day.
This type of action is very good because it clearly reveals what comes next. Both the lows in August 2024 and earlier this month (3-Feb. 2025) ended up lower than the low hit this current week. This is a minor detail but can be really important as it tells of the fact that buyers where ready and waiting at support.
If the low was a lower low, prices moving below 3-February and below August 2024, this would mean that buyers were not present. Even if buyers later show up it is not the same as buyers being ready beforehand. Buyers being ready beforehand means that they know what is happening and know what is coming. This correction is no surprise move but instead well planned. By who? Nobody cares. The truth is that after prices move up they tend to move back down and, after moving down then we get another move up. This is what is important. We are now entering this move-up period/cycle/phase.
Now, this is nothing new. In late 2022 we had a long sideways pattern followed by a break-up (price jump). In 2023 the same dynamic is repeated; sideways prices and then another bullish jump. Finally, 2024 did the same but smaller for this pair. Since Bitcoin Cash moved strongly in 2023 it performed weakly in 2024. Those that performed weakly in 2023 performed strongly in 2024, examples exist such as Cardano.
2025 will be different. Here we have no sideways pattern but instead a long-term lower high. This can be a double-top or lower high, makes not much difference. What matters is the fact that our baseline, Bitcoin Cash's long-term support holds. This holding is the most relevant part because the new rise will start from a strong level, which means that prices will move even higher in the coming months.
2022, 2023, 2024... This is all down. Cryptocurrency moves in a 4 year cycle based on Bitcoin's halving. The year after the halving is the bull-market year. Bitcoin halved in 2020 and the bull-market happened in 2021. Bitcoin halved in 2024 and the bull-market happens now, 2025; Thanks a lot for your continued support.
We are ready for the next price jump, "break-up," as it happened before. But this one will be something especial. A bullish wave within a bullish cycle in a bull-market year ending in a bull-run. Did you notice something in this line? The bears are gone!
Prepare for massive growth.
You can profit massively if you approach the market in the right way.
You can profit with spot or lev. it is all the same.
It would be wise not to become greedy, accept what comes to you.
If you are going to run, say a marathon, you start by training, the training starts with slow walking. Then you start throttling and then finally you run. At first, you only run for a short period of time but you increase little by little, run more and more. Eventually, you can run for hours, but it all started with a slow walk.
It is the same with trading. You can start by earning and accepting the small and little trades. You can earn 10-20%, over and over, again and again. As you get used to the winning you will eventually start to win more. Then you can earn 50%, 100% and continue going higher until you become a winner at the traders marathon.
You cannot start by running 10 miles on the first day.
You cannot start by going all-in with 20-100X.
Let us start small.
If we can create a winning habit, we will be able to win more over the long-run.
Namaste.

BCHUSDT 1WBCH ~ 1W Analysis
#BCH If you still have a Conviction on this coin. Maybe this support block you can consider to start buying again from here.

bch looking bullish we are in a triangle with a triple bottom witch is a very bullish sign im calling 500 if we brake out of this wedge

I Turned Crazy Strategy Into a Python Program & It’s RunningAfter years of refining my AI Harmonic Fibonacci strategy, I’ve fully automated it into a Python-based trading system, and it’s now LIVE on Binance Copy Trading. The results? 773 trades in just 7 days with an insane 98% win rate!
📊 Why Is This Strategy So Powerful?
✅ AI-driven precision – No emotions, just math.
✅ High-frequency trading – More trades, more wins.
✅ Zero risk approach – Built-in smart risk management.
✅ Fully automated – Profits while you sleep.
🔥 And the best part? You can access it right now.
🔍 Search "아몰랑" on Binance Futures Copy and see it in action!
sorry I accidentally made with a Korean nickname,
#Binance #CopyTrading #PythonTrading #AITrading #TradingBot #CryptoTrading #HarmonicPatterns #HighWinRate
www.binance.com

Bitcoin Cash: Back To 2023 Baseline Levels & $4222 New 2025 ATH Good morning my fellow Cryptocurrency trader, let's start with the fun part. Bitcoin Cash's new 2025 All-Time High potential sits at $2,594 or $4,142.
Which one ends up being the final target will be decided by you as a market participant. It all depends on how strong buyers are, how much confidence participants hold for the market, for how long can they hold when the bull-run starts. Actually, it will be decided by the whales but the fifth wave of the bull-market tends to be the speculative wave, everything goes crazy at that time and the potential becomes unlimited for as long as the mania phase remains. Let's aim high because Bitcoin Cash always tends to surprise.
It is likely that some strong, positive news event will develop and this will in turn support Bitcoin Cash's price. Some major institution or organization buying BCH or deciding to accept as a payment method. There will be lots of this throughout 2025. Those buying now, accumulating now and holding long-term, will reap the rewards. You will be blessed with massive profits if you decide to join the fun.
Cryptocurrency is bullish. The Altcoins are about to blow up in a way you have not seen before. If you entered the market after 2021, you are about to have the biggest surprise of your life. A positive surprise.
If you are a Cryptocurrency holder since early 2021 or before, you already know the feeling and how Crypto produces exponential growth. Final results can end up being 10X, 20X, even 30X or more. Many of the smaller and newer projects will grow 50X and beyond. 100X is also possible but we are happy with buying low.
Greed can be detrimental to your health and success. So we focus on the win, the great entry price and entry timing. We let the market take care of the rest.
We focus on a plan; develop a plan and just do our thing. Step by step, focused. If we approach the market with the right mindset now, we will do good once bullish momentum grows. You reap what you sow. If you plant profits filled, patience, abundance and healthy seeds, you will get fruits in the form of happiness, success, big money and personal growth.
We are ready to win.
Thanks a lot for your continued support.
Bitcoin Cash activated its 2023 baseline level. This is a price range where BCHUSDT produced a consolidation phase before a strong bullish advance. This level has been activated again as a higher low. Both signals are bullish. The re-activation indicates a new accumulation period and the higher low indicates long-term strength.
We are going high. Very high.
I am not staying out nor staying behind.
All my money is Crypto, what about you? What about yours?
All my money is in —All-in.
2025 is the year of Cryptocurrency.
Soon, we will know about this decision based on the results.
No leverage —or low leverage— results in very low risk. Basically no risk as you hold the actual coins. Holding the coins preceding a bull-market, can be smatter than using margin.
If you have experience, by all means, go ahead.
Regardless if you are a beginner or advance, you need a growing spot portfolio. This portfolio is like a savings account, it needs to receive money all of the time from your weekly and monthly pay.
You feed your portfolio now, in the short-term, and the market will pay you forever.
Thank you for reading.
Cryptocurrency is here to stay and is here for the long-term.
Cryptocurrency is the evolution of money.
Communication evolved.
Food evolved.
Travel evolved.
Housing evolved.
All areas of our lives are evolving and continue to evolve.
It is only logical and natural to see Bitcoin as the default currency of a digital world.
Everything is done on a device now, we are used and enjoy our smart phones.
Crypto is a technology based money and is here to change the world. For the better.
Namaste.


bch buy midterm"🌟 Welcome to Golden Candle! 🌟
We're a team of 📈 passionate traders 📉 who love sharing our 🔍 technical analysis insights 🔎 with the TradingView community. 🌎
Our goal is to provide 💡 valuable perspectives 💡 on market trends and patterns, but 🚫 please note that our analyses are not intended as buy or sell recommendations. 🚫
Instead, they reflect our own 💭 personal attitudes and thoughts. 💭
Follow along and 📚 learn 📚 from our analyses! 📊💡"

bch range"🌟 Welcome to Golden Candle! 🌟
We're a team of 📈 passionate traders 📉 who love sharing our 🔍 technical analysis insights 🔎 with the TradingView community. 🌎
Our goal is to provide 💡 valuable perspectives 💡 on market trends and patterns, but 🚫 please note that our analyses are not intended as buy or sell recommendations. 🚫
Instead, they reflect our own 💭 personal attitudes and thoughts. 💭
Follow along and 📚 learn 📚 from our analyses! 📊💡"

TradeCityPro | BCH: Breakout or Deeper Correction?👋 Welcome to TradeCity Pro!
In this analysis, I’ll be reviewing BCH. This coin is one of the older assets in the market, with chart data available since 2018. However, the chart I’m analyzing today is from Binance, which provides data from 2020 onward.
📅 Weekly Timeframe
In the weekly timeframe, we observe an uptrend that began at a low of 97.7. The first bullish leg pushed the price to 293.9, followed by a correction down to 189.6, and then another leg up to 693.
🔍 Currently, the price has tested the 693 resistance twice. At the same time, we have an ascending trendline, which was broken in the last weekly candle. The price has also formed a shadow towards the 293.9 support level.
🔽 If the price continues to decline and stabilizes below 293.9, we can confirm a double-top pattern. If this support breaks, the price could move down to 189.6. If the downward momentum continues, we could even see a decline to 97.7.
✨ For a short position, you can enter if 293.9 breaks, accompanied by increasing sell volume. The target for this short position would be 189.6. However, since the overall trend remains bullish, it’s important to manage risk carefully to avoid excessive losses. A break of the 41.72 RSI support could confirm bearish momentum.
📈 On the other hand, if the price stabilizes above 693, it has the potential to move up to 1414.7, which is the highest resistance in this chart and a key level. While BCH’s actual ATH occurred in 2019 and is not visible on this chart, this resistance remains crucial, and the price may react to it.
📅 Daily Timeframe
In the daily timeframe, we see a ranging box between 293.9 and 488.8, with the price now reaching the lower boundary.
⚡️ Following the breakdown of the 407.2 support, the price printed a large red candle, dropping straight to the bottom of the range. A significant support zone exists between 293.9 and 314.6.
💥 The RSI oscillator is currently in the oversold zone, meaning we should wait for a structure to form before taking a position. If the price breaks below 314.6 and 293.9, it could provide a short entry opportunity.
💫 For a long position, patience is required until the price establishes a new structure. If that happens, entering a long position upon a breakout of the structure’s high would be a valid strategy. The next resistance levels at 407.2 and 488.8 can serve both as targets for lower triggers and as new long-entry points.
🔼 The key supply zone is between 618.8 and 700.9—an extremely strong resistance area. If the price manages to break above this zone and hold, it could initiate the next bullish leg, with targets already identified in the weekly timeframe.
⭐️ A break above 56.81 on the RSI would serve as strong confirmation for a long position. Overall market volume is currently declining, so any volume surge accompanying a breakout would help validate the position.
📝 Final Thoughts
This analysis reflects our opinions and is not financial advice.
Share your thoughts in the comments, and don’t forget to share this analysis with your friends! ❤️

Bitcoin Cash Long Trade Setup📊 Price Action & Trend Analysis
Analyzing market trends using price action, key support/resistance levels, and candlestick patterns to identify high-probability trade setups.
Always follow the trend and manage risk wisely!
Price Action Analysis Interprets Market Movements Using Patterns And Trends On Price Charts.
👉👉👉Follow us for Live Market Views/Trades/Analysis/News Updates.

BCH Price ZonesAfter finishing the 5-wave uptrend for BLACK 1, the correction is going far (as with most altcoins).
I am still considering we are inside BLACK 2, but we are currently in a bearish zone.
A break of the green descending trendline below gray resistance, turns my bias NEUTRAL. Only above gray resistance we would be really bullish again.

BCH LongBCHUSDT - Bullish Market Structure Shift (MSS) with Liquidity Targets
Setup Overview:
BCH/USDT is showing a strong bullish Market Structure Shift (MSS).
Price has recently taken out sell-side liquidity, confirming a shift in market sentiment from bearish to bullish.
With this shift, the price is now expected to rally towards the buy-side liquidity, which is located higher in the chart.
Key Levels:
Sell-side Liquidity: At 436.0 USDT, price has cleared this level, indicating that sell orders have been absorbed and a reversal is in play.
Buy-side Liquidity: The key target for this move is around 803.1 USDT, which represents the next significant liquidity zone above.
Trade Plan:
Entry:
Enter the trade after confirming the bullish reversal at the current price level, following the market structure shift.
Stop: Place a stop below the recent low (just under the sell-side liquidity level) to protect against potential reversals.
Target: Set a target near 803.1 USDT, as the price aims for the buy-side liquidity.
Conclusion:
With the MSS confirming a shift to a bullish market structure after clearing sell-side liquidity, BCH/USDT is poised to move upwards towards the buy-side liquidity at 803.1 USDT. Watch for the confirmation of upward momentum before entering the trade.

Bitcoin Cash Bouncing from Trendline – Next Stop $600?"Bitcoin Cash (BCH) has bounced multiple times from the rising trendline, confirming it as a strong support level.
The price is now testing the nearest resistance zone, and a breakout could lead to a significant upside move.
PLEASE HIT THE LIKE BUTTON TO SHOW YOUR SUPPORT.
Thank you

BCHUSDT will outperform other altcoinshi traders,
Since reaching a 700ish high in April 2024, BCHUSDT has experienced a 61 % correction.
I expect that things are about to change for BCH and it will happen very very soon.
The support seems to be holding strong and I really don't see a reason why the price should go below 400$ again.
The expected outcome is visualized on the chart.
Good luck

bch long midterm"🌟 Welcome to Golden Candle! 🌟
We're a team of 📈 passionate traders 📉 who love sharing our 🔍 technical analysis insights 🔎 with the TradingView community. 🌎
Our goal is to provide 💡 valuable perspectives 💡 on market trends and patterns, but 🚫 please note that our analyses are not intended as buy or sell recommendations. 🚫
Instead, they reflect our own 💭 personal attitudes and thoughts. 💭
Follow along and 📚 learn 📚 from our analyses! 📊💡"

Is BCHUSDT Preparing for a Bullish Reversal or a Steeper Drop?Yello, Paradisers! Are you watching BCHUSDT closely? If not, you might be missing out on a critical setup that could define the next big move. Let’s dive in.
💎BCHUSDT has retraced beautifully within a descending channel, a textbook setup that raises the odds of a potential bullish breakout. However, as always, we must be strategic and patient.
💎If BCHUSDT approaches key support zone after triggering inducement and then begins to form a bullish I-CHoCH (internal change of character) on lower timeframes, the probability of an upward move significantly increases.
💎Should the price fail to show any bullish structure and continue to decline, a bounce from the next strong support zone could still be expected. However, the chances of dropping further from that point are relatively low.
💎Panic selling could change the game entirely. If BCHUSDT breaks below the strong support zone and closes a candle beneath it, the bullish thesis is invalidated. In such a scenario, it’s wiser to step back and wait for clearer price action before taking any positions.
🎖 Patience is key, Paradisers! Always wait for the highest probability setups to ensure consistent profitability. Remember, discipline and strategy are what separate the winners from the rest.
MyCryptoParadise
iFeel the success🌴


bch sell midterm buy limit"🌟 Welcome to Golden Candle! 🌟
We're a team of 📈 passionate traders 📉 who love sharing our 🔍 technical analysis insights 🔎 with the TradingView community. 🌎
Our goal is to provide 💡 valuable perspectives 💡 on market trends and patterns, but 🚫 please note that our analyses are not intended as buy or sell recommendations. 🚫
Instead, they reflect our own 💭 personal attitudes and thoughts. 💭
Follow along and 📚 learn 📚 from our analyses! 📊💡"

BCHUSDT 1WBCH ~ 1W
#BCH Coin Dino this will bounce on one of these support blocks. you can place purchases on this support block. target 20%++
