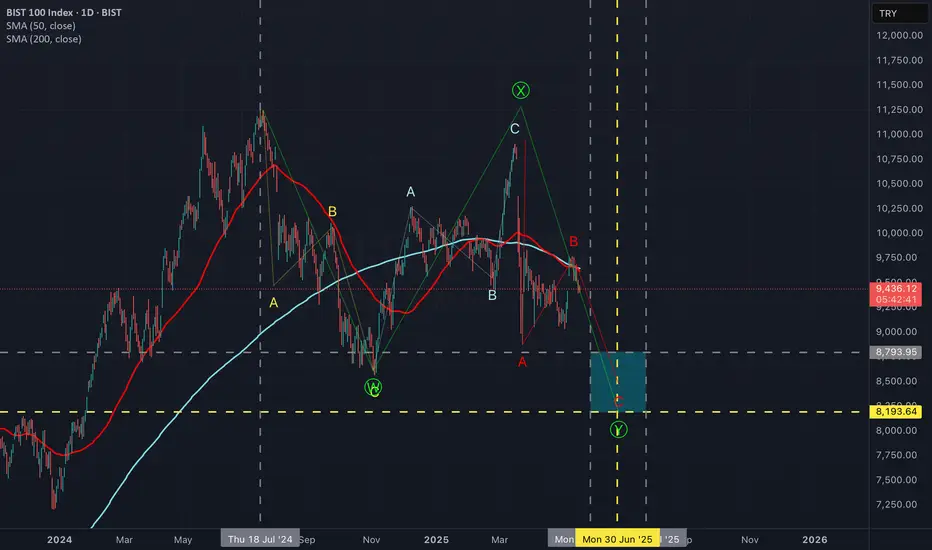
XU100 — BIST100 indexStarting from the assumption that the corrective movement which began on July 18, 2024, is a WXY pattern, I consider the current movement to be the final leg of this formation. Accordingly, I have marked in yellow on the chart what I see as the most likely reversal date and target price level. The
Related indices
No news here
Looks like there's nothing to report right now


Will BIST100 beat inflation?BIST100, which has been trending horizontally and falling for a long time, I think it can rise from here and the final rise phase will come. It is too early to say this before the new ATH comes, but I think the 10.9k region is the decision point. When it stays above it, after a move to the 11.8 regi


"BIST100: Triangle Signals 20-25% Drop"BIST100 (XU100)
In the monthly Cash Data, we see that a Reverse Neutral Triangle has formed and the post-pattern movement (the downward movement after wave-(e)) has also confirmed it and it seems that BIST100 is preparing for at least a 20-25% correction.
If the beginning of wave-(b) is broken, i.


Technical Analysis of BIST100 Index: Examining Trends and PriceIn this technical analysis, we have examined the Istanbul Stock Exchange Index (BIST100) with a special focus on trend lines and price channels. By precisely drawing trend lines, price channels, and linear patterns, key support and resistance levels have been identified. This analysis, using a simpl


See all ideas
Summarizing what the indicators are suggesting.
Oscillators
Neutral
SellBuy
Strong sellStrong buy
Strong sellSellNeutralBuyStrong buy
Oscillators
Neutral
SellBuy
Strong sellStrong buy
Strong sellSellNeutralBuyStrong buy
Summary
Neutral
SellBuy
Strong sellStrong buy
Strong sellSellNeutralBuyStrong buy
Summary
Neutral
SellBuy
Strong sellStrong buy
Strong sellSellNeutralBuyStrong buy
Summary
Neutral
SellBuy
Strong sellStrong buy
Strong sellSellNeutralBuyStrong buy
Moving Averages
Neutral
SellBuy
Strong sellStrong buy
Strong sellSellNeutralBuyStrong buy
Moving Averages
Neutral
SellBuy
Strong sellStrong buy
Strong sellSellNeutralBuyStrong buy
Displays a symbol's price movements over previous years to identify recurring trends.
Frequently Asked Questions
The current value of BIST 100 Index is 10,121.52 TRY — it has fallen by −1.28% in the past 24 hours. Track the index more closely on the BIST 100 Index chart.
BIST 100 Index reached its highest quote on Jul 18, 2024 — 11,252.11 TRY. See more data on the BIST 100 Index chart.
The lowest ever quote of BIST 100 Index is 0.01 TRY. It was reached on Apr 17, 1986. See more data on the BIST 100 Index chart.
BIST 100 Index value has increased by 0.86% in the past week, since last month it has shown a 11.55% increase, and over the year it's decreased by −8.89%. Keep track of all changes on the BIST 100 Index chart.
The top companies of BIST 100 Index are BIST:ASELS, BIST:GARAN, and BIST:KCHOL — they can boast market cap of 17.33 B TRY, 14.11 B TRY, and 10.20 B TRY accordingly.
The highest-priced instruments on BIST 100 Index are BIST:EGEEN, BIST:BRYAT, and BIST:CLEBI — they'll cost you 7,410.00 TRY, 1,807.00 TRY, and 1,630.00 TRY accordingly.
The champion of BIST 100 Index is BIST:EFORC — it's gained 725.13% over the year.
The weakest component of BIST 100 Index is BIST:REEDR — it's lost −74.80% over the year.
BIST 100 Index is just a number that lets you track performance of the instruments comprising the index, so you can't invest in it directly. But you can buy BIST 100 Index futures or funds or invest in its components.
The BIST 100 Index is comprised of 100 instruments including BIST:ASELS, BIST:GARAN, BIST:KCHOL and others. See the full list of BIST 100 Index components to find more opportunities.