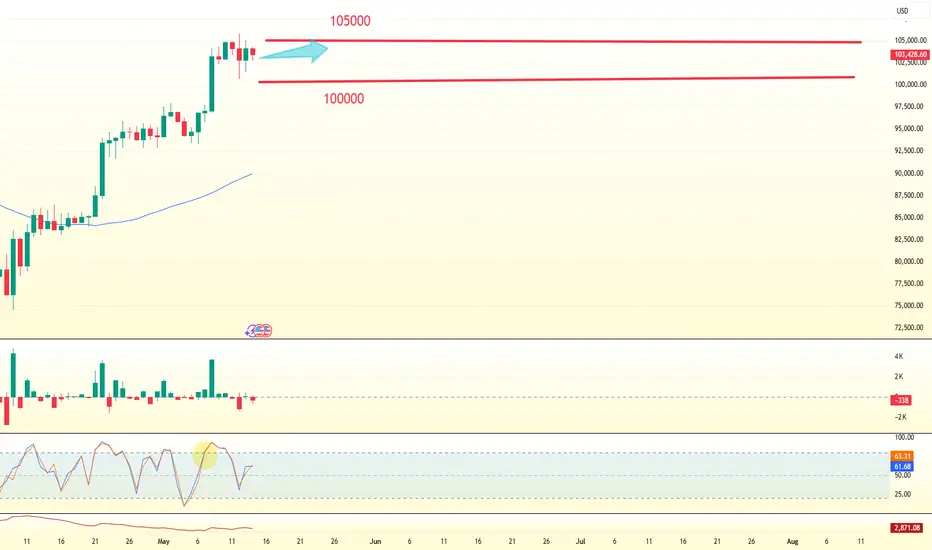
TRADE SETUP BTC"Right now, BTC is still in the 'liquidity grabbing phase'. Here's the current pattern and setup for BTC:
If BTC breaks below 101900, that's a signal to go short.
But if BTC breaks above 103700, that's a signal to go long."
BITCOIN trade ideas

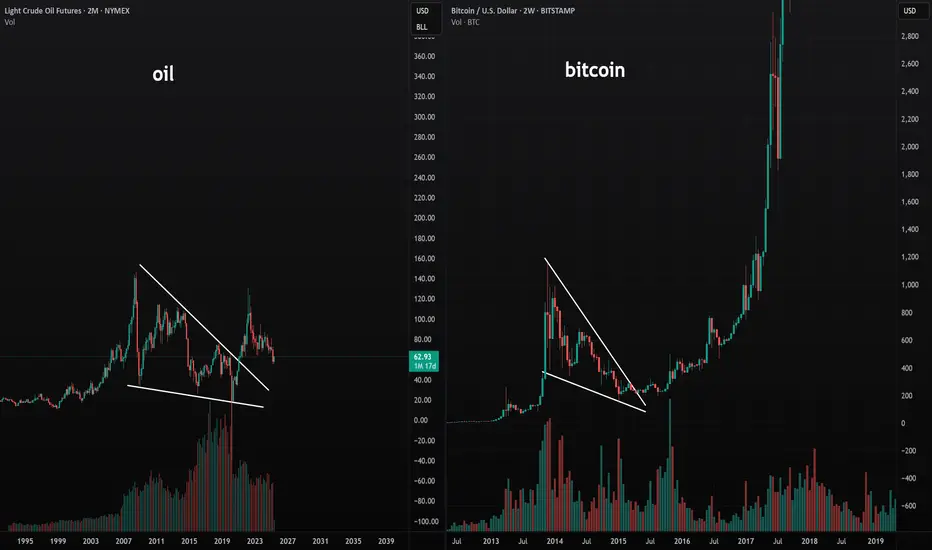
Crude oil is extremely bullish.I see a very similar market structure in crude oil’s big picture as in the early days of Bitcoin. People will say, “But what about electric cars?”—yet few realize that over 6,000 products are made with oil. Not to mention, long-term oil use isn't going anywhere, even with the rise of electric vehicles.
I believe oil is actually very undervalued and has been repressed for many years. It can't be held down forever—a big upward move is pretty much inevitable.
As always, stay profitable.
- Dalin Anderson
Bitcoin Breaks Wedge! Correction Coming Before Next Leg?The bitcoin spot ETF has seen net inflows for 20 consecutive days. BlackRock's IBIT has attracted more than $69 million in a single day, and the total inflow scale has exceeded $5 billion. The strong institutional allocation demand provides strong support for the price of bitcoin. The 4 - hour - level RSI (49) is approaching the neutral zone and shows a pattern of lower highs, indicating that the buying momentum is weakening. The MACD histogram remains negative, indicating short - term correction pressure. At the same time, the price has formed a double - top pattern near $105,000, and the Fibonacci resistance at $109,396 suppresses the upward space. Market expectations for a rate cut in June have cooled (with a probability of 65%). If the relevant economic data exceeds expectations, a stronger US dollar may suppress the price of bitcoin.
you are currently struggling with losses, or are unsure which of the numerous trading strategies to follow, at this moment, you can choose to observe the operations within our channel.
BTC/USD Short NowEntered a BTC/USD short after price rejected a key resistance level and broke below the ascending trendline. Bearish structure confirmed the entry.

BTCUSD 1H Short Setup | Order Block + Premium Rejection⚠️ BTCUSD | 1H Rejection at Supply Zone | May 10, 2025
Bitcoin is showing signs of exhaustion after a sharp rally into a high-value Supply Zone marked by a bearish Order Block at ~$104.1k–$106.4k. Price tapped right into premium levels, triggering potential Smart Money distribution.
🔍 KEY CONFLUENCES:
🧱 1H Bearish Order Block at 104,139–106,477
⚖️ Price in premium zone (>50% range)
🧠 Clean liquidity grab from prior swing high
🚫 Signs of buying weakness inside OB
📉 Anticipated move down toward imbalance and demand zone near $96k
📊 Setup Specs:
Pair: BTCUSD
Timeframe: 1H
Entry Zone: 104,139 – 106,477
SL: 106,477
TP: 95,789
RR: Approx. 1:4+
📌 Smart Money Breakdown:
After explosive rallies, institutions often offload in supply-rich OB zones while retail buys the top. This setup shows textbook SMC signs of distribution, imbalance below, and a clean trade idea toward unmitigated demand.
🧠 Chart Ninjas Tip:
“Never short early — wait for price to enter the OB and show weakness. That’s where smart entries live.”

Pairing between BTC & Global Liquidity IndexSup everyone,
if you're active on twitter or have been looking around for crypto trade ideas you might have stumbled upon the Global Liquidity Index chart (at least I have).
I've stumbled upon it a few months back and have been testing it ever since, let me tell you what this chart is about:
The Global Liquidity Index basically measures how much money is flowing through global markets—think of it like the pulse of the financial system... traders and investors use it to get a sense of overall market conditions, liquidity availability, and risk appetite.
Now, here’s the cool thing: when you layer the Global Liquidity Index onto the Bitcoin chart, you notice something interesting— BITSTAMP:BTCUSD tends to react, but with a delay. Typically, there's about a 2-3 month lag. If global liquidity spikes or makes a sharp V-shaped recovery, Bitcoin usually mirrors this movement roughly 80 days later.
Why does this happen? Well, Bitcoin is a highly speculative asset, and institutions—especially banks—often wait to see solid liquidity signals before moving their capital into riskier assets like crypto. They prefer confirmation over speculation, which explains the delay.
So, in simple terms, by tracking global liquidity, you get a pretty useful heads-up about where Bitcoin might be headed a couple of months down the road.
The Global Liquidity Index is essentially a snapshot showing how much money central banks and financial institutions are injecting or pulling out of the global economy. Think of it like a big gauge tracking how "easy" or "tight" money conditions are worldwide.
It usually takes into account factors like:
Central Bank Policies: How much money central banks are printing or how they're changing interest rates.
Bank Reserves and Credit Availability: The amount banks can lend out, influencing how easily money flows through markets.
Government Spending and Stimulus: Fiscal policies injecting liquidity directly into the economy.
International Capital Flows: Money moving across borders, affecting global market liquidity.
When liquidity is abundant, there's more money sloshing around looking for places to invest. That typically pushes up asset prices—including speculative ones like Bitcoin—as investors seek higher returns. Conversely, when liquidity tightens (like when central banks raise interest rates or pull back stimulus), money becomes scarcer, risk appetite shrinks, and assets tend to dip.
So, when you're watching the Global Liquidity Index, you're basically monitoring how central banks and institutions are influencing market sentiment and investment behaviors, which eventually impacts speculative assets like Bitcoin—but with that notable delay we talked about earlier.
Practically speaking, here's how you apply the Global Liquidity Index to Bitcoin:
You watch for major turning points—peaks, bottoms, or sharp reversals—in global liquidity. Once you spot one, mark your calendar about 2–3 months forward (around 80 days). That’s usually when Bitcoin mirrors that move.
So, for instance, if the Global Liquidity Index sharply rebounds upward (a V-shaped recovery), you'd expect BTC to follow with a rally roughly two to three months later. On the flip side, if liquidity peaks and starts declining, it's a heads-up that Bitcoin could face downward pressure within the next few months.
This gives you a practical edge—you're essentially previewing BTC’s possible moves.
All things said, if you look at BTC's chart right now and apply the Global Liquidity Index to it you can see how the second has broken its previous high a few months back, but BTC yet has to break its, you can arrive to the conclusions here....
With no reversal in sight (for now) in the Global Liquidity Index, there don't seem to be signs of "spoofing", no case in which the index starts declining and so makes traders who know about this delay start to sell earlier than the delay.
End of the story - things look promising for BTC and you should definitely keep the Global Liquidity Index in your list of indicators.


BTCUSD bullish momentum continues within ascending channalBTCUSD bullish momentum continues within ascending channal. Market sentiments are currently postive for Crypto.

BTC ...Bitcoin using the BTCUSD / DXY ratio as guideLook at my other ideas for further explanation...but simply put:
you cannot judge a price if the price moves, ergo the price of a stock is then a derivative of an unknown. If I cant be certain of the price of said money, then how do I derive the price of a stock.
Well that's where the stock/DXY comes in...it helps to value to currency at the current rate at the moment and really roughly sets aside inflation in broad terms. See how the current price is higher than the past, but the price chart shows its like 4-6k off the ATH....
So you divide and then plot, pick your point and channel away...This is done using Log since BTCUSD is way to volatile to use standard price scale.
A view from the close range and you can see the dots are for reference.
remember a high wick or a low wick doesn't mean too much, but it especially means nothing using this method. So where the peak or trough of that red line ratio is, you must align it with the close, but it a green or red candle. That why your channels may not look like mine, however mine are hitting a lot of stuff and can't be made up since too much aligns for it to be not useful or forced.
So remember, you may have to be a little CyQoTek to see things differently, but if you do ^^^

BITCOIN 24HOURS BEARISHBitcoin will be bearish in the next 24hours according to my analysis, its already breakout of the trendline in th following Timeframe 4,3,1,15M, 10M and 5M, so its just a shortt bearish run

Bitcoin blows up the market: $100,000 broken.Bitcoin (BTCUSD) surged past the key $100,000 mark again on Thursday, May 8, 2025 — for the first time since February this year. During the day, BTC traded between $101,500 and $102,700, posting a daily gain of around 5.3%. Its market capitalization exceeded $2 trillion.
Why Bitcoin is back at $100K — and what’s driving it higher:
Macro tailwinds:
Growing expectations of Fed rate cuts , reinforced by Donald Trump’s calls for lower interest rates, have fueled risk appetite across markets — Bitcoin included.
US – UK trade deal hype : Hints of a potential trade agreement between the US and the UK announced by President Trump added a major boost to market sentiment, sparking a rally.
Institutional demand : Massive inflows into US spot Bitcoin ETFs continue. Over $1.8 billion flowed in last week alone, with some sources reporting $2.68 billion by Thursday — the largest weekly inflow since mid-December 2024. Companies like MicroStrategy are leading the charge with more BTC purchases.
Weaker dollar & falling bond yields : These trends have enhanced Bitcoin’s appeal as a hedge.
Market sentiment & BTC dominance : Breaking above $100K triggered optimism and possible FOMO (fear of missing out). Bitcoin’s market dominance now exceeds 60%, the highest since early 2021, reflecting investor preference for BTC over altcoins in the current phase.
The appointment of Paul Atkins as SEC Chair , along with a softer US regulatory stance and Arizona’s new pro-crypto law, are setting the stage for continued growth.
FreshForex analysts note that the current rally is mainly driven by institutional players, while retail investors have yet to fully engage.


BTCMost will say the cycle just starting.
The top will most likely be in next month in June.. if so those that called this a 2017 rally was more than correct. Even XRP moved like 2017.

BTCUSD: Market Sentiment & Price Action
Looking at the chart of BTCUSD right now we are seeing some interesting price action on the lower timeframes. Thus a local move down seems to be quite likely.
Disclosure: I am part of Trade Nation's Influencer program and receive a monthly fee for using their TradingView charts in my analysis.
❤️ Please, support our work with like & comment! ❤️

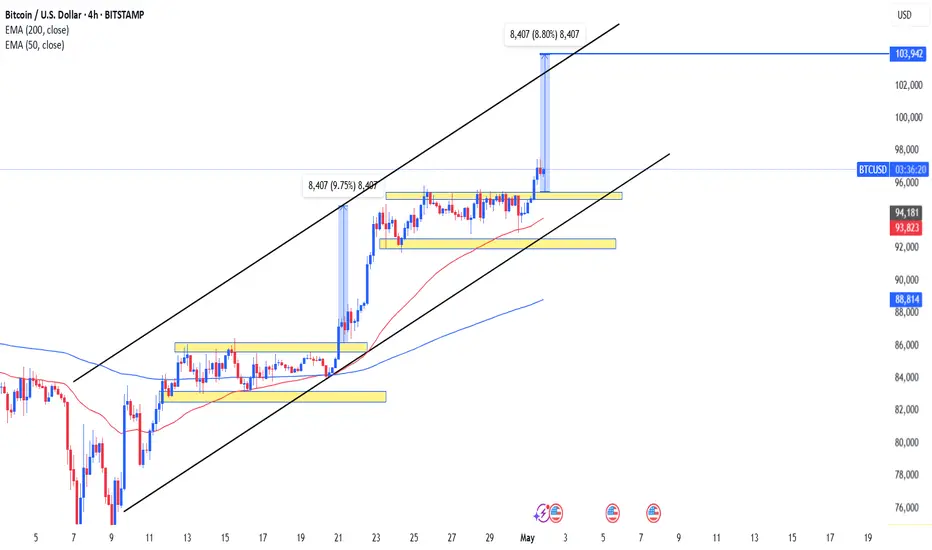
"Bitcoin Breakout Within Ascending Channel Targets $103,942"CANDLE MASTER Update!
Bitcoin (BTC/USD) showing a bullish market structure with a clear ascending channel and breakout pattern. Here's a detailed analysis:
Key Observations:
1. Ascending Channel:
The price is moving within an ascending channel (black lines), showing a bullish trend.
Bitcoin has recently broken out above a consolidation range, continuing the bullish momentum.
2. Support Zones (Yellow Boxes):
Multiple horizontal support zones have been marked where price previously consolidated before breaking out.
These zones could act as support if there's a retracement.
3. Breakout Projection:
The breakout move is highlighted with a vertical measurement of 8,407 points, or approximately 8.80%.
This same measurement has been projected upward from the recent breakout, targeting around $103,942, which is the next price objective.
4. Moving Averages:
50 EMA (red) and 200 EMA (blue) are both trending upwards, which supports the bullish trend.
Price is trading well above both EMAs, indicating strong bullish momentum.
5. Volume/Timing:
No volume is shown, but the structure suggests accumulation phases followed by sharp upward moves — classic signs of breakout trading behavior.
Conclusion:
Bitcoin appears to be in a strong bullish trend with momentum likely continuing toward the $103,942 level as per the breakout projection. Support is well defined below, and unless price breaks below the lower trendline or major EMAs, the bullish outlook remains intact.

Coinbase’s $2.9B Deribit Gamble: A Power Play to Challenge.....Coinbase’s acquisition of crypto options giant Deribit for $2.9 billion signals a bold move to dominate derivatives markets. Despite mixed investor reactions, the deal positions Coinbase as a key player in institutional crypto trading.

BTC Looking Bullishlooking at price action it has returned back to discounted levels. We are generating a pennant/channel pattern showing price is being squeezed. I would over all like to see a breakthrough to the up side. waiting for confirmation

BTC/USDSubtract 60-70%.
Most alts subtract 80-95%.
Sell everything.
Come back in 1-2 weeks on crypto.
Come back in 3-6 weeks on stocks.

BTC - NOT DONE YET - $132,000 Well, in a somewhat interesting turn of events, I can see my Stop loss at $105,300 is going to get hit, and BTC will push higher. Its pre-emptive, as we have yet to touch $105,300. But the micro wave structure looks clear to me. So in a somewhat sensational way , the new target is an all time high plus about $22,000 more.
Happy Trading.
Lets hope this does not turn into a bad case of the whiplash.

BTC still has a chance to rise to 108rally base rally with the potential to touch 108000,
the trend is still bullish also we have not seen any reversal or trend transition.
wait for breakout and or confirmation

BITCOIN Climbing the Fibonacci Staircase..Bitcoin (BTCUSD) has come into the Fed Rate Decision week stronger that ever, having staged an impressive rebound from the early-April Low. The consolidation of the last few days is of course a market reaction in anticipation of the big interest rate news.
Regardless of that, the Channel Up that is the underlying pattern from the start of this Bull Cycle has been filling on an impressive symmetrical scale all .382 Fibonacci extensions one by one. The most recent has been the 4.382 and naturally the next in line is the 5.382 Fibonacci extension.
Since the last one (4.382) was almost hit before the price pull-back, it would be more fitting to assume the next peak slightly below the 5.382 Fib ext as well as $170000.
This may very well be the final High i.e. the Cycle's Top before the next Bear Cycle begins, depending on the time it hits it.
Do you think that would be the case? Feel free to let us know in the comments section below!
-------------------------------------------------------------------------------
** Please LIKE 👍, FOLLOW ✅, SHARE 🙌 and COMMENT ✍ if you enjoy this idea! Also share your ideas and charts in the comments section below! This is best way to keep it relevant, support us, keep the content here free and allow the idea to reach as many people as possible. **
-------------------------------------------------------------------------------
💸💸💸💸💸💸
👇 👇 👇 👇 👇 👇
