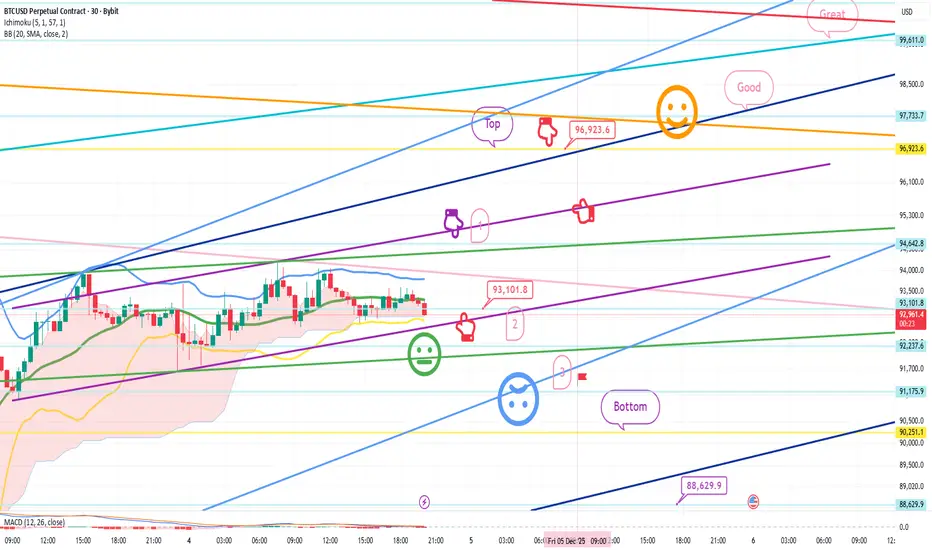
December 4 Bitcoin Bybit chart analysisHello
It's a Bitcoin Guide.
If you "follow"
You can receive real-time movement paths and comment notifications on major sections.
If my analysis was helpful,
Please click the booster button at the bottom.
This is a 30-minute Bitcoin chart.
It's not visible on the screen due to limited space,
but at the bottom, it touched the long position entry point of $83,495.4 on December 1st,
and continues to rise.
The Nasdaq indicators will be released shortly at 10:30 AM,
and I developed today's strategy based on the Nasdaq and Tether dominance patterns.
*Conditional long position strategy based on the red finger's path
1. After touching the purple section once at the top (autonomous short)
Switch to a long position at the red finger at the bottom at $93,101.8
/Stop-loss price if the green support line is broken
2. First target for a long position at the top section at $96,923.6 -> Target prices in the order of Good and Great
Before tomorrow's daily candlestick is created,
if the top section is touched alone,
since it is a resistance line on the Bollinger Band daily chart,
a strong correction is likely.
If the Good section is touched at once,
it is highly likely to be ignored and continue to rise.
If the price drops immediately without touching the first section at the top,
it's a final long strategy in the second section,
and the stop-loss price remains the same.
The third section below is a sideways movement.
If the green support line holds today, a vertical rise is possible after tomorrow.
If the price holds today's light blue support line,
it could lead to a strong upward movement after tomorrow.
Below the bottom, the price is open to 88.6K, the lowest point today.
Please note this.
Please use my analysis to this point for reference only.
I hope you operate safely, adhering to principled trading and a stop-loss price.
Thank you.
Market insights
Bitcoin: awaits a breakout catalystInflation is evidently slowing down in the US, based on the latest posted PCE data, bringing investors sentiment to the positive grounds for the second week in a row. The US equity markets continue to gain, however, for the second week in a row, the crypto market was left behind, waiting for the liquidity to start flowing. Analysts are commenting that the BTC is currently around 36% down from its ATH, but noting that this type of action is quite “normal” for this coin and the crypto market. The current question is whether the expected Fed's 25bps cut will invert the market game also for crypto coins not only for equities?
The previous week started positive for BTC, where the coin reached the highest weekly level at $93,9K. However, the second part of the week was traded mostly in red, with another drop at Saturday's trading session, below the $89K. This week, BTC was not able to sustain higher grounds. The RSI reached level of 48 and then dropped back to 42. The indicator is showing that the market does not have strength at this moment for a push toward the overbought market side. The MA50 is further diverging from MA200, indicating that the potential cross is still not close.
Current charts for BTC are showing some potential for a further breakthrough toward the upside, considering that the $88K level sustained selling pressure for the last two days. On the opposite side, the level of $94K also represents a challenge for BTC. At the same time, both levels have the same probability of occurrence in the week ahead. In this sense, a break of $88K would mean further drop of BTC, most probably toward the $86K or $84K, while the break of the $94K would indicate potential for $97K, eventually $100K but with lower probability at this moment.

BTC Control Market Build Up: Higher-Target Continuation insightBTC is currently trading above the strong 88,000 support level.
This area has turned into a solid demand zone after multiple retests, where buyers show aggressive reactions.
On the upside, the 93,000–94,000 zone is a major resistance — and if the price breaks above it, the momentum can shift into a strong bullish continuation.
Price Action Expectation
If BTC continues to hold the 88,000 support and successfully breaks the 93,000/94,000 resistance zone,
then the next bullish leg can easily extend toward 98,000.
Key points:
support area 88000
Resistance: 93000/94000
Target: 98000

Bearish momentum to extend?Bitcoin (BTC/USD) is rising towards the pivot which acts as a pullback resistance and could reverse to the 1st support.
Pivot: 94,255.27
1st Support: 80,712.26
1st Resistance: 106,846.29
Disclaimer:
The opinions given above constitute general market commentary and do not constitute the opinion or advice of IC Markets or any form of personal or investment advice.
Any opinions, news, research, analyses, prices, other information, or links to third-party sites contained on this website are provided on an "as-is" basis, are intended to be informative only, and are not advice, a recommendation, research, a record of our trading prices, an offer of, or solicitation for, a transaction in any financial instrument and thus should not be treated as such. The information provided does not involve any specific investment objectives, financial situation, or needs of any specific person who may receive it. Please be aware that past performance is not a reliable indicator of future performance and/or results. Past performance or forward-looking scenarios based upon the reasonable beliefs of the third-party provider are not a guarantee of future performance. Actual results may differ materially from those anticipated in forward-looking or past performance statements. IC Markets makes no representation or warranty and assumes no liability as to the accuracy or completeness of the information provided, nor any loss arising from any investment based on a recommendation, forecast, or any information supplied by any third party.

Bitcoin – Selling Pressure Rises as the Downtrend FormsHello everyone,
Bitcoin is showing a clear corrective leg on the H4 timeframe after failing to sustain the bounce near 94,000 USD. Price sliced through the closest FVG and retreated back to the 88,500–89,000 USD demand zone, signalling that buyers are present but not strong enough to shift the structure. The overall technical picture now leans towards a short-term bearish trend, with the spike to 96,000 acting merely as a liquidity grab before sellers resumed control.
BTC has already formed a lower high at 94,000 and confirmed a new lower low by breaking the lower FVG, fully activating the short-term downtrend. The Ichimoku cloud has turned red and thickened, creating a strong barrier between 90,500–92,000 that continues to reject every recovery attempt. Buy-side volume also remains noticeably weaker than sell-side activity, reflecting defensive rather than aggressive bidding.
On the fundamental side, Bitcoin remains under pressure as the US Dollar Index (DXY) rebounds and US Treasury yields climb, drawing short-term flows away from crypto. With markets now anticipating NFP and PCE data, caution dominates; historically, BTC tends to soften before major macro releases as traders avoid adding risk.
Let’s see how BTC reacts once the data hits — this move may determine whether the correction deepens or stabilises.

BRIEFING Week #49 : Watch Oil & USDJPYHere's your weekly update ! Brought to you each weekend with years of track-record history..
Don't forget to hit the like/follow button if you feel like this post deserves it ;)
That's the best way to support me and help pushing this content to other users.
Kindly,
Phil

Bitcoin strength possibly more aheadThis started to turn around at 88,500 approx. on rsi divergence.
Then broke out. I am still long from 88,500.
I see strength in USD running at parity to is 200ema, in a few hours time.
Bitcoin will oblige.
Here’s the thing,
Around USD breakouts & the possibility, the inverse thing with Bitcoin & DXY de-couples as Bitcoin knows is big buddy DXY has the resources to break them both out.
Not saying it will def happen, safe havens buying builds up more when DXY parks on its 200 day moving average.
Watch for the EURUSD to climb to 119 & the baton holder may change as my honest feeling is that any move beyond parity by DXY will lose steam.

Btcusd Btcusd I explained why am expecting price to go up this is the full chat I pray it show full this time

The policy bottom of Bitcoin provides support for going long.Policy Winds: Rate Cut Expectations Dominate, Liquidity Easing Expectations Intensify
The Federal Reserve’s December FOMC meeting (scheduled for December 9-10) has entered the final window, with market expectations for a rate cut surging to a high of 87% Federal Reserve Board of Governors. Major investment banks including Goldman Sachs and Morgan Stanley have confirmed a high degree of certainty for a 25-basis-point cut in December .
Dovish officials continue to send clear signals. San Francisco Fed President Mary Daly emphasizes that the risk of labor market deterioration outweighs the rebound of inflation, warning of the "non-linear" collapse risk of the currently fragile job market . Fed Governor Christopher Waller also publicly supports a December rate cut, framing it as a "sound risk management" measure to curb further labor market weakness and ease pressure on low- and middle-income households .
U.S. economic data shows a "moderate cooling" trend: monthly retail sales and durable goods orders have slowed, and manufacturing performance remains lackluster, providing real-world support for the rate cut . Bitcoin has a significant negative correlation of -0.75 with the U.S. Dollar Index — the recent weakening of the dollar directly benefits crypto assets.
While some hawkish officials within the Fed worry about inflation spread, the policy inertia after two consecutive rate cuts has aligned with market expectations . This synergy forms the core policy support for Bitcoin’s short-term upside.
Bitcoin trading strategy
buy:88500-89500
tp:91000-92000
sl:87500
BITCOIN BEARISH FLAG STRUCTURE AND LIQUIDITY GRAB In this weekends Bitcoin price analysis, Bitcoin appears poised to close the weekly candle with an indecision doji, signaling uncertainty in market direction. On the 12-hour chart, the current candle formation combined with a stochastic cycle low suggests that price may first gravitate toward the liquidity zone near $96,388 before resuming downward momentum.
Looking at the daily timeframe, price has retraced precisely to the 0.382 Fibonacci level, reinforcing the idea of a temporary pause. With both the 12-hour and weekly stochastics registering cycle lows, the setup points to continued sideways consolidation into next week. Ultimately, this structure favors a breakdown toward the $80,524 support zone, where buyers may look to re-engage.
However, on 4 hours time frame I have a identified a bearish flag structure and if the structure break out of the sideways channel, then I expect Bitcoin to fall towards the initial target of $72k and ultimate target of $58k.
I would like to thank you for reading my publications and supporting my analysis. Please if you find value in my presentation kindly give it a boost and comment with your thoughts in the comments section. Let's be a community that sharpens each other. Cheers and have a great trading week.

BTCUSD Intraday Short:Bearish Bias from H1 FVG Rejection(071225)Technical Outlook: Analyzing BTC on the 5-minute timeframe (aligned with the H1 perspective), the market structure remains clearly Bearish, supported by the following technical factors:
Supply & Liquidity Sweep: The price previously tested the upper SRC Zone Sell, effectively sweeping liquidity ($$$) before a sharp rejection. This indicates strong selling pressure from institutional players.
Imbalance (H1 FVG): The downward impulse left a significant Fair Value Gap (FVG) on the H1 timeframe (Grey Zone: 90,000 - 90,237). This area is currently acting as a strong resistance block; recent attempts to retrace into this zone have failed to break through.
Market Structure: The formation of continuous Lower Lows and Lower Highs confirms the short-term downtrend.
Trade Setup: I am looking for Short/Sell setups in line with the major trend, focusing on rejections near the FVG zone.
Entry Zone: 89,480 - 90,000 (Lower boundary of the FVG / Consolidation area)
Stop Loss (SL): 90,240 (Placed strictly above the H1 FVG and the 90,237 level to avoid stop hunts)
Take Profit (TP): 88,190 (Previous Swing Low / Next Demand Zone)
Risk Warning: Trading involves high risk. Please practice strict Money Management (MM). If the price reclaims and holds above 90,300, this bearish outlook becomes Invalidated.

ElDoradoFx PREMIUM 3.0 – BTCUSD PRO ANALYSIS (07/12/2025)1. Market Overview
BTC is trading inside a contracting corrective structure after rejecting the 89,750–89,850 supply zone. Price failed to sustain above the intraday EMAs and shifted momentum bearish. Liquidity remains heavy below current price, and MACD shows continued bearish pressure across short- and mid-timeframes. Weekend conditions favour engineered sweeps into deeper demand before any strong reversal attempt.
⸻
2. Technical Breakdown
🔹 Daily (D1)
• BTC remains in a broader retracement phase after major rejections at 97,400 and 104,000.
• EMAs overhead continue acting as dynamic resistance.
• Short-term relief rallies lack follow-through; price is at risk of retesting 88,000–87,500.
• Momentum is flattening but still bearish (MACD increasing negative histogram).
🔹 H1
• Strong rejection at 89,750 followed by BOS to the downside.
• Price now trades under both 50/200 EMAs, retesting them as resistance.
• Trendline support from prior swing low is being tested.
• Demand pockets: 89,350 → 89,200 → 89,000 → 88,800 (PDL).
• Structure remains bearish unless 89,750 is reclaimed with conviction.
🔹 15M–5M
• Clear lower-high sequence with repeated CHoCH → BOS confirmations.
• Sellers defended the supply zone aggressively.
• MACD flipped short with strong follow-through; RSI mid-range but with bearish slope.
• Liquidity clusters align below: 89,200, 89,000, 88,800 → highly attractive for engineered sweeps.
⸻
3. Fibonacci Analysis (Golden Zone)
Swing: 88,899 → 89,750
• 38.2% = 89,450
• 50% = 89,325
• 61.8% = 89,200
🎯 Golden Zone: 89,450 – 89,200
This aligns perfectly with intraday demand and previous liquidity builds.
⸻
4. High-Probability Trade Scenarios
📈 BUY Scenario (Countertrend Only)
Buy Zone:
• 89,200 – 89,000 – 88,800 (PDL sweep preferred)
Targets:
• 89,350 → 89,500 → 89,750
Stop-Loss: below 88,700
Confirmation Needed:
• Wick rejection at demand
• MACD re-flip long
• 5M BOS to confirm reversal structure
⚠️ Note: This is a counter-trend setup.
⸻
📈 BUY Breakout Scenario
Trigger: Break & hold above 89,750
Retest: 89,600–89,650 holding as support
Targets:
• 90,050 (PDH) → 90,300 → 90,750
Stop-Loss: 89,200
⸻
📉 SELL Scenario (Primary Setup)
Sell Zone:
• 89,600 – 89,750 (major supply zone)
Targets:
• 89,350 → 89,200 → 89,000 → 88,800 (PDL)
Stop-Loss: 89,900
Why this is preferred:
• Strong momentum confluence
• EMA rejection
• Multiple CHoCH/BOS confirming bearish control
⸻
📉 SELL Breakout Scenario
Trigger: Break below 89,000
Retest Fail Zone: 89,050–89,100
Targets:
• 88,800 → 88,400 → 88,000
Stop-Loss: 89,350
⸻
5. Fundamental Watch
• Weekend trading = algorithmic liquidity hunts, low-volume manipulations.
• No major fundamentals expected; movement will be structure-driven.
• Liquidity below is highly attractive; expect volatility near 89,200 / 89,000.
⸻
6. Key Technical Levels
Resistance:
• 89,600 / 89,750 / 90,050 / 90,300
Support:
• 89,350 / 89,200 / 89,000 / 88,800
Breakout Buy Trigger: > 89,750
Breakout Sell Trigger: < 89,000
⸻
7. Analyst Summary
BTC sentiment remains short-term bearish with strong structural, momentum, and EMA confluence. The sell zone at 89,600–89,750 remains the primary area of interest. First key liquidity target sits at 89,200, with deeper sweeps into 89,000–88,800 likely if momentum persists.
Countertrend longs only activate after confirmation at those deeper zones.
⸻
8. Final Bias Summary
Primary Bias: Bearish below 89,750
Bullish Only If: Price reclaims and holds above 89,750
Key Decision Zone: 89,200–89,000
⸻
🥇 ElDoradoFx PREMIUM 3.0 – PERFORMANCE 05/12/2025 🥇
⚡ Smart Entries. Consistent Wins.
📈 BUY +570 PIPS (From 04/12)
📈 BUY +500 PIPS (From 04/12)
📈 BUY +40 PIPS
🟥 SELL -55 PIPS (SL)
📈 BUY +120 PIPS
📈 BUY +210 PIPS
📈 BUY +20 PIPS
🟥 BUY -40 PIPS (SL)
📈 BUY +20 PIPS
📉 SELL +60 PIPS
━━━━━━━━━━━━━━━
💎 SWING TRADES – STILL RUNNING
🔵 BUY → +3,005 PIPS
🟣 BUY → +2,260 PIPS
🟢 BUY → +1,390 PIPS
📊 Long-term swing positions continue to dominate, while intraday precision adds consistent controlled gains.
━━━━━━━━━━━━━━━
💰 TOTAL PIPS GAIN: +1,445 PIPS
🎯 8 Wins · 2 SL
🔥 80% Accuracy
━━━━━━━━━━━━━━━
✅ A powerful close to the week — strong swings + clean intraday setups delivering exceptional profit.
— ElDoradoFx PREMIUM 3.0 Team 🚀

Bitcoin Higher.Bitcoin chart is looking like it wants to go higher .
I still thibk btc is going to give us a push towards the highs.
Long and strong.

BTC/USD📈 BTCUSD – Trading Plan Summary (Breakout Setup)
🔍 Market Context
Bitcoin has successfully broken above the major descending trendline, which has rejected price multiple times in the past. This breakout signals a potential shift in momentum from bearish → bullish.
📌 Trade Setup
🎯 Entry
$87,600
Confirmed breakout of the downtrend line with bullish follow-through.
🛡️ Stop-Loss
$80,000
Placed below key structural support to protect against a false breakout.
🎯 Take Profit Targets
TP1: $97,800
TP2: $103,000
This zone represents a major supply area and previous consolidation region before the breakdown.
📊 Technical Reasons for the Trade
Multi-touch downtrend line break, indicating a shift in market structure.
Formation of a higher low, supporting bullish reversal potential.
Clean momentum candles breaking away from resistance.
Target zone aligns with strong historical supply.
📉 Risk Management
Risk remains defined with SL at $80,000.
If price closes back below the broken trendline, bullish structure becomes invalid.
📌 Summary
Bitcoin is presenting a high-probability breakout setup with clear risk and well-defined upside targets.
Holding above $87,600 keeps momentum bullish toward $97.8K–$103K.

Bitcoin Analysis - Still looks weak
The bounce from the 0.786 level initially indicated that there could be some demand around deep retracement levels. However, the inability to hold above 0.618 undermines the case for a strong reversal. In classical technical‑analysis logic, losing 0.618 swing reclaims often suggests the corrective move may extend further downward, or the price may remain range‑bound for some time.
Given that BTC now trades under a key resistance band (US$93–$94 k) and market sentiment remains cautious, the structure resembles a tense consolidation or distribution.

The Last Kick of a Dying Horse BTCUSD may rise from 89200 towards 90400 in the next few hours before a potential drop below 70k. A bearish flag is in formation on the 4hr chart

BTC Buy Setup 6 Dec 2025 12HBTC Buy Setup
Market is pulling back from the recent swing high and heading toward a bullish support zone. If price dips into that demand area and shows a stable reaction, it can form a new dealing range. From there, a clean shift in structure on the lower timeframe can open a long opportunity.
The idea is to let price tap the demand zone, hold it, and then catch the move as it expands back toward the upper boundary of the ascending channel. The overall bias stays bullish as long as the trendline and support zone remain protected.

Bitcoin – 4H Trendline Structure Analysis Trend OverviewBitcoin – 4H Trendline Structure Analysis
Trend Overview
BTC is currently trading between the green descending trendline (bearish pressure) and the red ascending trendline (bullish structure).
The yellow zones mark major pivot levels where momentum historically shifts.
The market is sitting right above the key yellow support at 85,916, which is the decision level for the entire structure.
Key Levels
Major resistance: 100,082
Critical support: 85,916 (yellow zone)
Trendline bias:
Green = bearish pressure
Red = bullish support zone for structural bounce
Bearish Scenario (Only Valid Below 85,916)
BTC becomes a sell ONLY if it breaks and closes below 85,916 on the 4H timeframe.
A clean break below this yellow zone confirms:
Loss of bullish support
Full bearish continuation
Targets toward the red trendline → then 82k → 78k zones
No break = NO SELL.
Bullish Scenario (If 85,916 Holds)
If BTC does not break the 85,916 zone, the structure favors a retest of the green trendline and eventually the 100,000 zone.
Why?
The red trendline is still intact.
Buyers continue defending the yellow pivot.
Market forms a stepping-higher structure inside a compression wedge.
So holding above 85,916 gives BTC a clean path toward 100k.
TradingView Caption (Ready to Publish)
Bitcoin 4H Analysis — Key Support Decides Everything
BTC is currently trading between descending bearish pressure (green trendline) and rising bullish structure (red trendline). The yellow zone at 85,916 is the key level that decides the next big move.
📉 BTC is only a sell if it breaks and closes below 85,916.
A confirmed break sends price toward the lower red trendline and opens the door for deeper correction.
📈 If BTC holds above 85,916, the structure remains bullish, and price is likely to push back toward the green trendline and potentially the 100,000 resistance.
This level controls the whole trend — no break = no bearish continuation.
— Avo.Trades

BTCUSD —Retracement Into 4H Demand Before Next Leg UpI’m expecting Bitcoin to complete a healthy retracement before continuing its bullish structure. Price has created a clear higher high on the daily timeframe, and the current slowdown suggests sellers are stepping in temporarily — which is normal after an extended move.
4H Demand Zone (My Entry Area)
I’m watching the 4H demand zone at 86,187 – 87,172.
This zone is:
• Fresh and unmitigated
• Origin of a strong bullish displacement
• Formed after a liquidity sweep and impulsive move up
This makes it a high-probability area for a bullish reaction.
Expectation
I expect BTC to pull back into the demand zone, fill inefficiency, and then continue the uptrend.
Target
My target is the next resistance level around 98,000, which was previously a major support area.

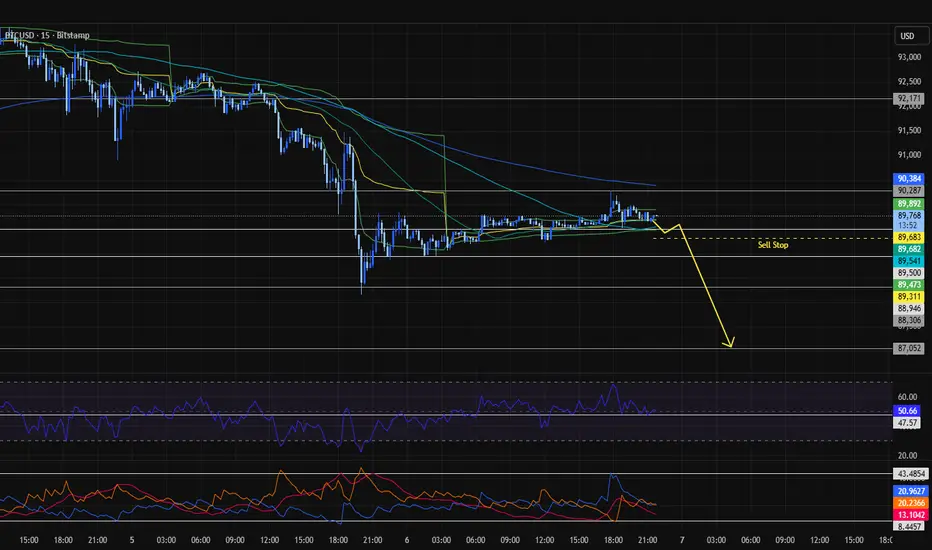
Bitcoin analysis – 15-minute timeframeSignals are showing a potential sharp bearish move. To avoid missing a whale candle, we can take a calculated risk and place a sell stop at 89.683.
BTCUSD – Structure Still Intact, Following Long-Term PlanDescription: Over the past few weeks, I’ve been closely tracking BTC using a structure I built some time ago, and I’m pleased to see how price continues to respect key levels and behavioral zones.
✅ CHoCH and BOS confirmations have aligned well with my expectations, especially around the $89,666 buy zone and the $89,665 sell reaction. 📊 I'm using a multi-timeframe approach, with daily structure guiding my bias and intraday levels confirming entries. 📉 The RSI and Bollinger Bands are helping me track momentum and volatility, while my moving averages (likely 50 and 200) continue to support the broader trend.
Key support zones like $74,314 (Strong Low) and resistance areas around $119,826 are still valid. I’m watching for continuation or rejection near these levels.
This idea is part of a long-term tracking plan, and I’ll keep updating as BTC continues to follow the structure.

Bitcoin(BTC/USD) Daily Chart Analysis For Week of Dec 5, 2025Technical Analysis and Outlook:
In the most recent trading session, the Bitcoin market experienced a Pump-and-Dump scenario and continued the downward trend observed over the past week. The price has reached the Mean Resistance level of 93,500.
Market sentiment is declining, with current price action focusing on identifying the Mean Support level at 88,000. Additional support is identified at 84,500, with a further significant drop possible to the Outer Coin Dip at 78,500.
Given the current dynamics of the crypto market, there is potential for an intermediate rebound from the Mean Support level of 88,000 back up to the Mean Resistance level of 93,500. Furthermore, an external extension may target the Interm Inner Coin Rally at 98,000.

BTCUSD BEARISH OR RETEST (READ CAPTION)Hi trader's what do you think about bitcoin usd
BTCUSD is currently showing a bearish retracement structure, suggesting that price may continue to correct downward after failing to hold higher levels.
🔹 Resistance Level: 93,800
This level acts as a strong rejection zone.
If price retests 93,800 and fails to break above, it confirms bearish continuation. Sellers are expected to remain active below this zone.
🔹 Support Level: 90,800
This is the first support level where price may attempt a short-term bounce.
If BTC breaks below 90,800, bearish momentum will likely increase.
🔹 Demand Zone: 89,200
This is the major demand zone where strong buyers may step in.
If price reaches 89,200, a potential bullish reaction can happen, but until then the market remains in a bearish correction phase.
📉 Market Outlook
BTCUSD remains under bearish pressure as long as it stays below 93,800.
Break below 90,800 opens the way toward 89,200 demand, where buyers are expected to show stronger interest.
please don't forget to like comment and follow thank you
