this is a testThis is a test am I testing an embed code. this is a test. this is a test. this isa test
BITCOIN trade ideas
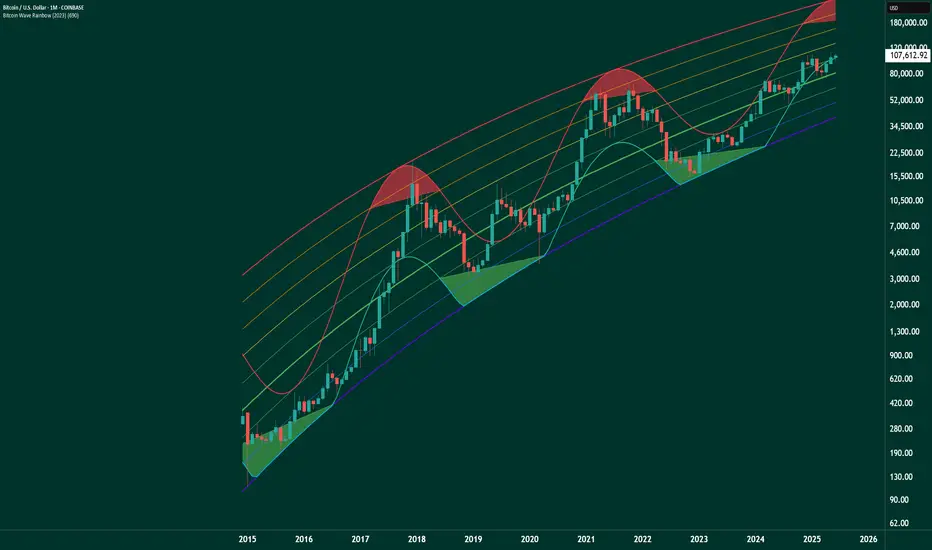
BULLISH SENTIMENT ELLIOT WAVE PREDICTION
Wave 2 cannot retrace more than 100% of Wave 1.
It can go deep, but not lower than the start of Wave 1.
Wave 3 cannot be the shortest of the three impulse waves (1, 3, and 5).
Often, Wave 3 is the longest and most powerful.
Wave 4 cannot enter the price territory of Wave 1.
This means no overlap between Waves 1 and 4 in a standard impulse.
Wave 5 must move in the direction of the overall trend.
It completes the five-wave impulse sequence.
BULL FLAG PREDICTION
Strong Uptrend (Flagpole)
Consolidation (Flag)
Measured Move Target - we want to see volume coming out of our consolidation phase. $150k would be a nice ATH CRYPTOCAP:BTC (MAXI)
Market sentiment (IMO) :
The dollar has fallen -10% this year.
- Less Trust in the Dollar. #bitcoin #ethereum #vechain #ada #xrp #ltc
Conflicts overseas usually push prices up because they threaten oil supplies.
-Wars spark spikes in oil, food, gas and metals due to disrupted supply chains. Historically, most commodity prices double during conflicts

October remains the targetA parabolic move to 200k or higher by October is far from unlikely — we’ve seen it play out before.

BTC?
Hi
BTC HAD moved 10%
I think, very small movement this coming days.
=sideways
It's still bullish , for my trading perspective.
Buyside next week.
G ot to align new setup (if any)
All the best
Not a guru
XRP too..

$BTCCRYPTOCAP:BTC is showing strength as uncertainty grows.
Investors are searching for ways to protect capital and generate yield and crypto liquidity pools are becoming the go-to instrument.
With buyers stepping in above $105K, the momentum could push prices to new highs, drawing more capital into the ecosystem.
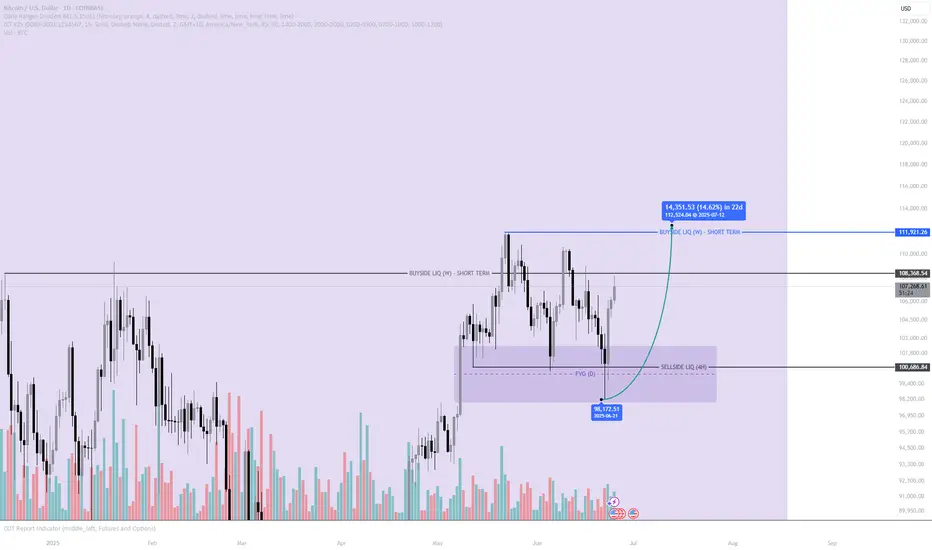
Bitcoin Respecting FVG Again – Is This the Launchpad to 112K+ ?Bitcoin has once again shown strong respect for a key Fair Value Gap (FVG) on the daily timeframe, tapping into a previously identified imbalance around the $98,000 region. This area had earlier acted as a base for bullish structure, and price's return to it suggests re-accumulation by smart money rather than a breakdown. The reaction was swift, rejecting off the FVG and forming a strong bullish daily candle, implying intent for higher prices.
This move into the FVG also swept sell-side liquidity resting below a clear 4-hour equal low. This kind of liquidity grab is a textbook ICT-style move, used to trap retail shorts before a reversal. With that liquidity cleared and institutional interest likely engaged, the structure has shifted bullishly, creating a higher low and showing momentum building to the upside.
The next major upside objective lies at $111,921, which marks short-term weekly buyside liquidity. This area represents a key magnet for price — where many stop-losses and buy-side orders are likely stacked — making it a logical destination for a move upward. The projected move offers a potential 14.6% upside over the next few weeks.
If price can hold above the $106K-$108K zone, the probability increases that we’re witnessing the beginning of a broader impulsive leg toward the $112K region. However, failure to maintain bullish structure here could mean deeper accumulation is still unfolding. As always, this setup should be approached with discipline, and further confirmation should be sought using your own risk model and strategy.
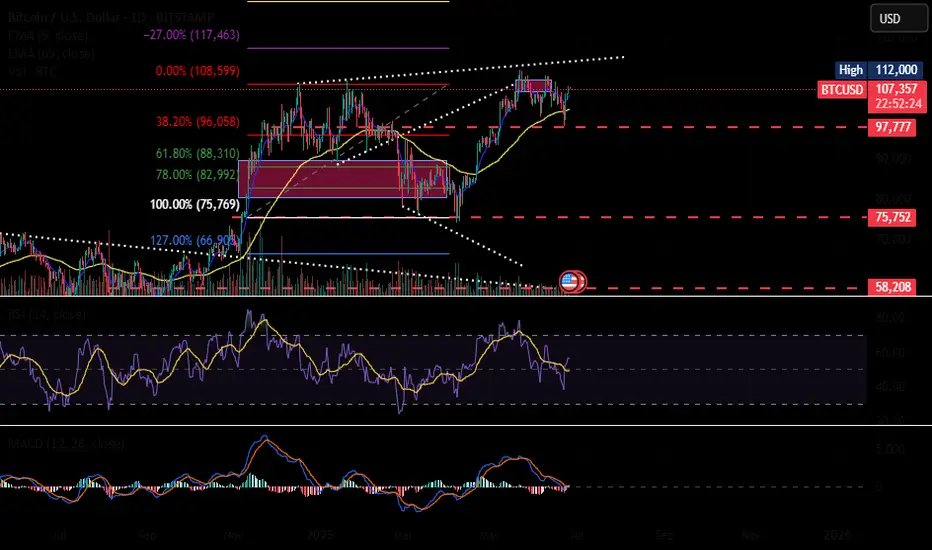
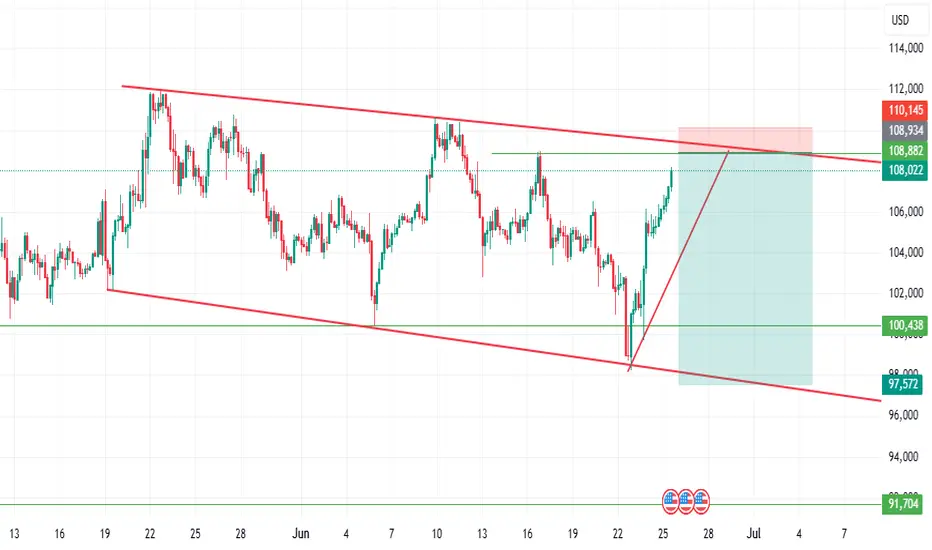
Descending broadening wedge after peak BTC/USD 4hCurrently BTC/USD is in a descending broadening wedge after a peak.
This means high chance of upward breakout. Price increase from breakout point is usually the difference from pattern top to pattern bottom, which would mean a price of $123000.
Not financial advice. There is a chance of this not playing out, even though the chance is small.

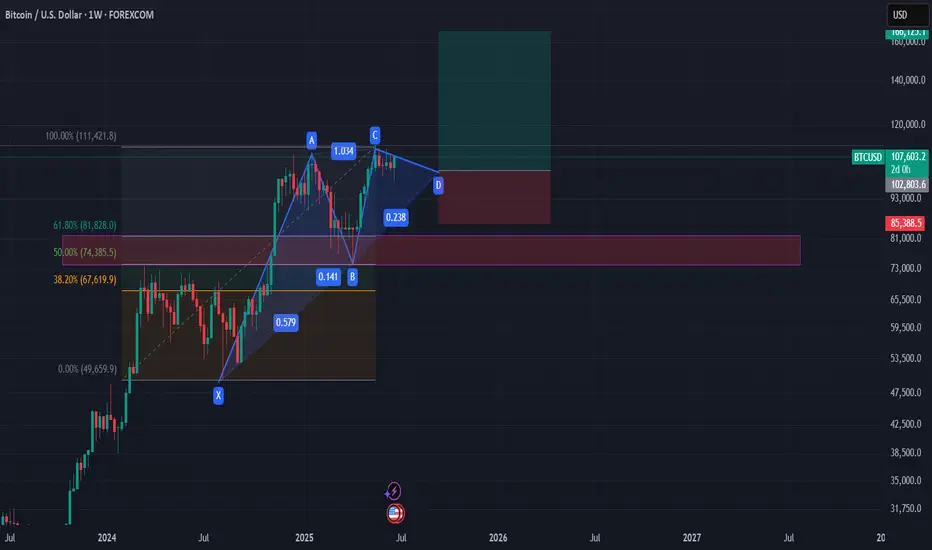
XABCD pattern with strong confirmation on Golden Zone of Fibo?XABCD pattern with strong confirmation on Golden Zone of Fibo?
I im strong bullish i think we are in the D Wave and then we gonna have some Pump IMO
do your own research
btc 5th wave of elliot wave?im still bullish on Btc i think we are in the last and 5th wave that will be in the next 3-4 months , and then blood in the streets for a huge bear market.
DYOR

SELL BTCUSD NOW🚨 TRADE ALERT:
SELL BTCUSD NOW 💥📉
🔻 Market showing bearish signs.
🎯 Set your TP (Take Profit) levels wisely.
🛡️ Use SL (Stop Loss) to manage risk.
📊 Confirm with your strategy before entry.
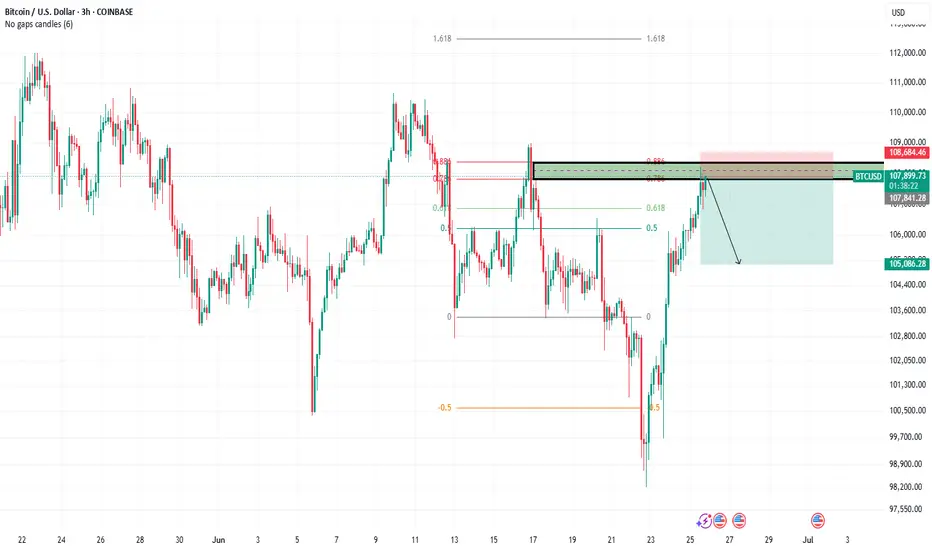
BTC continues to short at high levels during the day📰 Impact of news:
1. Geopolitical impact
📈 Market analysis:
BTC has reached an intraday high of 108,125, just one step away from the all-time high of 112,000. With the increase in trading volume and institutional sentiment turning bullish, the momentum seems to be in the bulls' favor. In addition to institutional buying, the ceasefire agreement in the Iran-Israel war is also an important factor in Bitcoin's sharp rebound. Trump's announcement of the end of the war almost immediately triggered a surge in the cryptocurrency market. However, the overall pattern has not changed, and the range resistance has not been broken, so we still keep the idea of shorting at high levels.
🏅 Trading strategies:
SELL 108000-107500
TP 104500-103500
If you agree with this view, or have a better idea, please leave a message in the comment area. I look forward to hearing different voices.

CHECK BTCUSD SIGNAL READ CAPTAINbtcusd sell now ✅
entry point (107600.00) (107400.0)
TAKE PROFIT 1: (106600.00)
TAKE PROFIT 2: (105300.00)
LAST TARGET(104200.00)
STOP LOSS (108400.00)

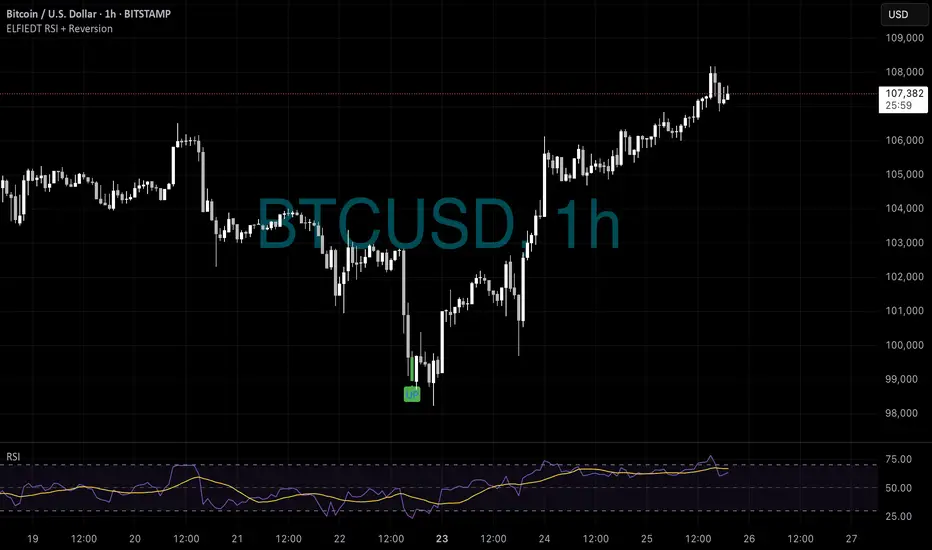
BTC - Longs???₿ Perfect Bitcoin Long from the Bottom
Instrument: Bitcoin (BTCUSD)
Timeframe: 1-Hour
Date: 22 June 2025
Indicator: ELFIEDT RSI + Reversion
🔍 The Setup:
After a sharp selloff, Bitcoin printed an “UP” signal just as price reached local exhaustion near the $100,000 zone.
While fear was high and momentum pointed downward, ELFIEDT detected the reversal conditions forming — and flagged the shift before any breakout was visible.
📈 The Result:
From the moment the “UP” signal appeared, BTCUSD launched into a clean rally — climbing over $7,000 in just a few days.
Traders who followed the signal saw:
✅ A low-risk entry from the bottom
✅ No chasing required
✅ A strong, clean uptrend with minimal drawdown
The early signal was key — while most were still bearish, ELFIEDT was already long.
📌 Key Takeaway:
ELFIEDT didn’t predict the news. It didn’t follow the herd.
It simply reacted to what the market was truly showing: an extreme condition with reversal potential.
The result was a near-perfect long.
🚀 Trade What You See, Not What You Feel
BTC’s bounce wasn’t random — it was algorithmically identified by ELFIEDT.
Your edge is in the data. Let the system guide you.
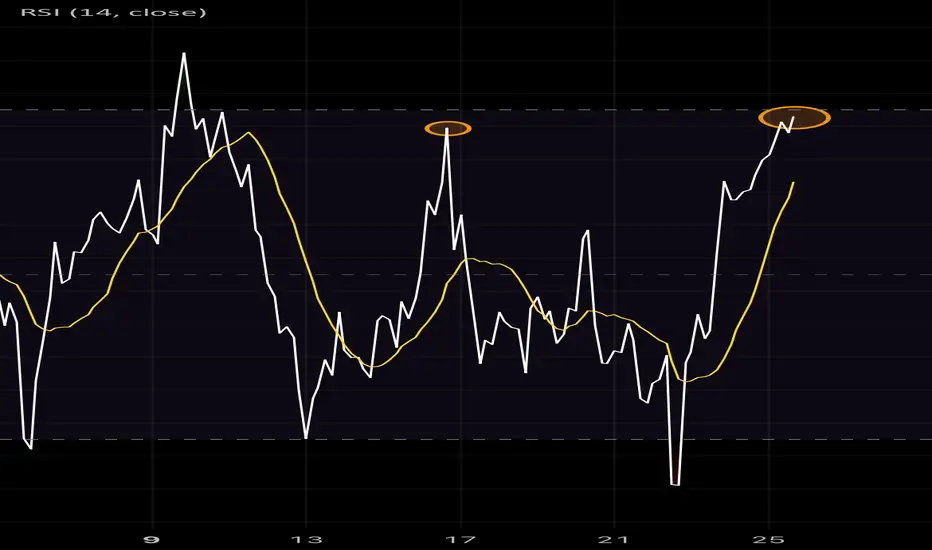
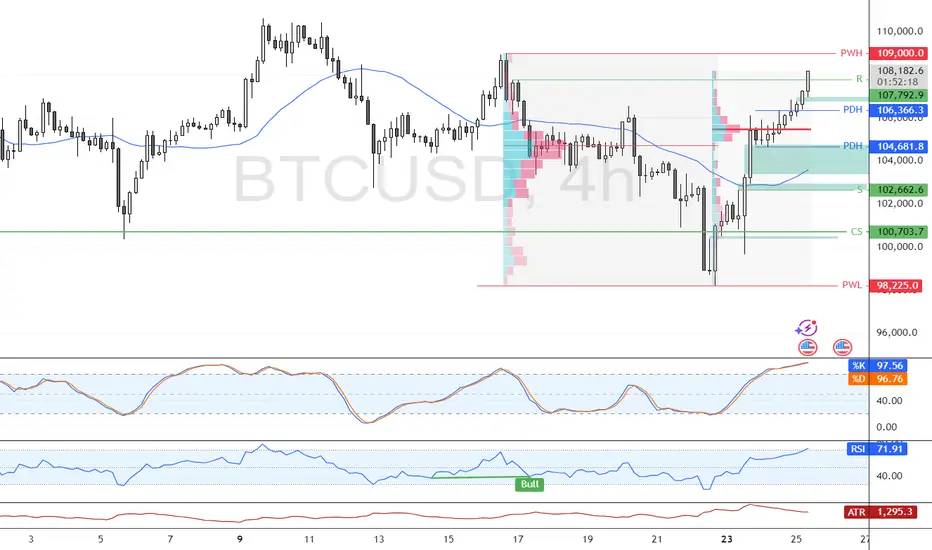
RSI High High 4HR RSI making a higher high breaking the Bear downtrend .
There is also an inverse head & shoulders and also price back inside the Bull pennant on the 1D .
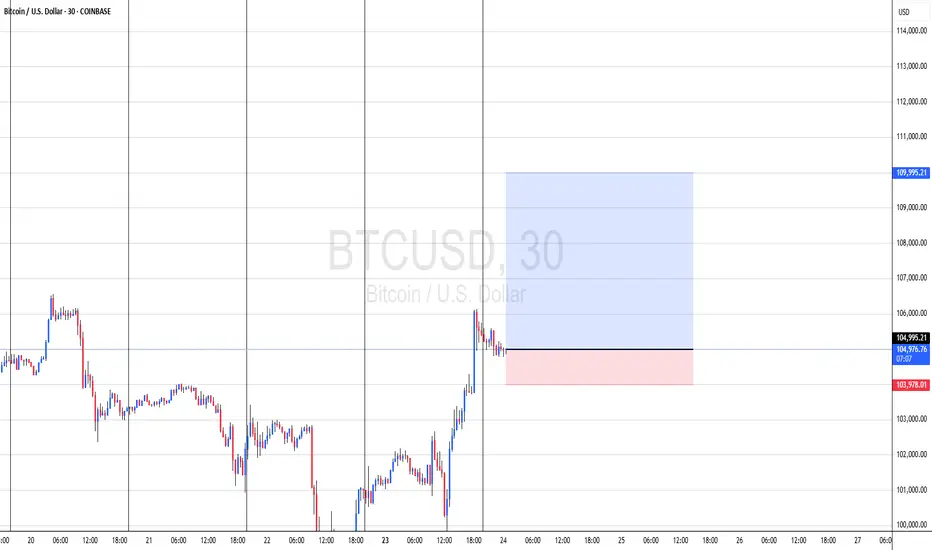
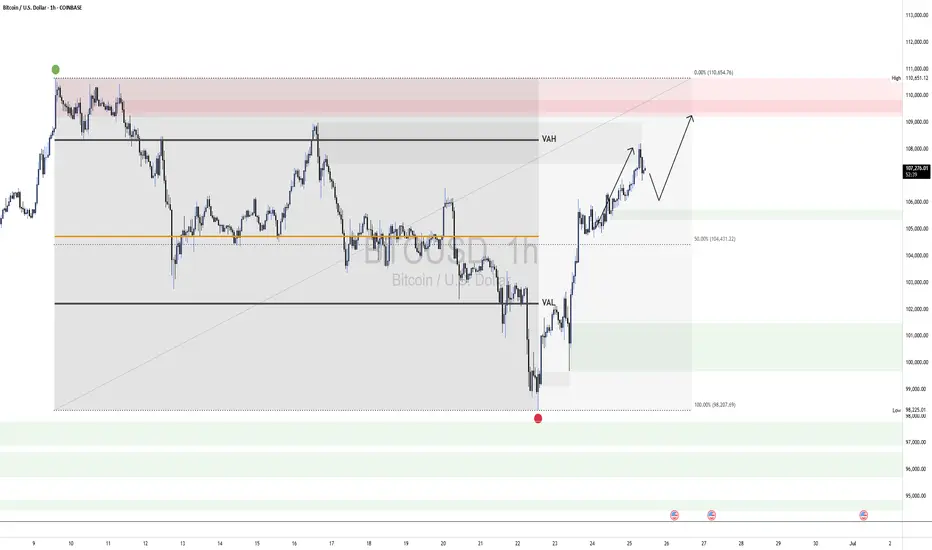
BTCUSDNow that BTCUSD has reached our previous target at 107,848, we are updating our forecast.
The market remains structurally bullish, with the next upside objective at 109,400.
Although we've seen a reaction from a short-term supply zone, a slight pullback or pause is possible. However, due to visible liquidity resting above, there's a strong likelihood that price will extend higher toward 109,400.
At that point, we will closely monitor price action for signs of exhaustion or reversal to evaluate potential short opportunities.
BTC 4-Hour Long Target 115,500Hello fellow Traders.
I am long, only posting my target area.
This Chart is very clean.
I came to the target conclusion area, with some Math, and I have used a Gann Square to monitor a time frame to reach the target area.
Yes, your reading it correctly, seems like it can happen as early as this Friday, and as late as July 22.
PA doesn't necessarily have to stay in the positive area of this Gann Square, and has all the right to swing back up inside positive, to finish it's goal.
The Plan:
The probability to reach the target within the time frame will fade slowly out, far past the Gann Square.
Yes, I am actually guessing where the nearest chance to reach this price level is going to happen "if it will happen" within the green target area, so I may close out my long trade somewhere along the way up. Afterwards scalp the box up and down till it hits the Target Area.
Except price to have an extremely high chance to bounce down from the Target Area, when it hits.
Good Luck !!

BTC next target!!!It's not the new ALL TIME HIGH, it's 97k.
Chart is saying everything in detail.
Let's go!!!

New buying opportunity may emerge for BTCBTC tends to fluctuate in the short term, but as BTC builds a double bottom structure to support the rebound pattern, it is currently inclined to fluctuate upward. Although the upward momentum has weakened after reaching around 106,000, as long as it stays above the 105,300-104,800 area, BTC is still expected to continue to rise and may challenge the 108,000-109,000 area again.
And with the collapse of the gold and oil markets, funds in the two markets may flow into BTC, which is more attractive and the mainstream market of cryptocurrencies. So as BTC retreats in the short term, BTC may have new short-term buying opportunities. Then if BTC retreats to the 105,500-104,500 area and does not fall below this area, we can consider going long on BTC at the right time.

Bitcoin Climbs Above $107K with Overbought Signals in PlayBitcoin closed above the 107,792 resistance after breaking the previous day's high. RSI and Stochastic indicators show overbought conditions, signaling short-term overpricing.
BTC may test the $109,000.00 resistance next, followed by a potential pullback toward $104,618.00, offering a favorable entry point for bulls.
BTCUSD is about to sellFrom the chart, you will see that usdjpy is about sell after a small bull run.
Reasons;
1] Trendline touch strategy
2] Double top pattern
Bitcoin Strategic Risk Framework & Market Structure Assessment.⊢
⟁ BTC/USD – BINANCE – (CHART: 1D) – (Jun 25, 2025).
⟐ Analysis Price: $107,191.94.
⊢
⨀ I. Temporal Axis – Strategic Interval – (1D):
▦ EMA21 – ($105,207.93):
∴ Price has reclaimed EMA21 decisively after testing below;
∴ EMA21 maintains upward slope, indicating reactivation of short-term bullish sentiment;
∴ Dynamic support now resides at ~$105.2K.
✴️ Conclusion: EMA structure favors bullish continuation while price holds above.
⊢
▦ SMA200 – ($96,064.16):
∴ SMA200 remains strongly upward sloped, untouched since March 2024;
∴ Long-term momentum remains firmly bullish;
∴ No contact with SMA200 confirms macro support far below.
✴️ Conclusion: Structural support intact; macro uptrend fully confirmed.
⊢
▦ Ichimoku Cloud – ($103,065.53 / $104,456.43):
∴ Price positioned above Kumo; bullish structure remains intact;
∴ Kijun-sen ($104,456.43) and Tenkan-sen ($103,065.53) both flat, signaling short-term consolidation;
∴ Chikou Span approaches historical resistance zone; Span A and B flattening.
✴️ Conclusion: Bullish trend preserved, but lacking forward thrust; potential stagnation if breakout fails.
⊢
▦ Volume (MA21) – (~129 BTC):
∴ Current volume ~128.73 BTC, slightly under the moving average;
∴ No breakout volume confirmation despite recent price thrust;
∴ Weak volume expansion reduces reliability of short-term breakout.
✴️ Conclusion: Momentum requires validation through volume escalation.
⊢
▦ MACD – (-4.44 / 36.48 / -40.92):
∴ Histogram contracting upward, bearish momentum fading;
∴ MACD Line (-4.44) still below Signal Line (36.48);
∴ No confirmed bullish crossover, but compression phase active.
✴️ Conclusion: Latent bullish reversal potential; not yet validated.
⊢
▦ RSI – (55.95):
∴ RSI reclaimed level above 50, positioning in neutral-bullish zone;
∴ RSI MA at 48.78 confirms momentum shift;
∴ Positive slope suggests rising momentum, but lacks steepness.
✴️ Conclusion: Momentum entering constructive zone, still not impulsive.
⊢
🜎 Strategic Insight – Technical Oracle:
∴ Structure remains technically bullish with constrained momentum;
∴ Indicators are aligned toward continuation, yet breakout conviction is hindered by insufficient volume and pending oscillator confirmation;
∴ Short-term path is upward-biased, conditional on validation.
⊢
∫ II. On-Chain Intelligence – (Source: CryptoQuant):
▦ Exchange Netflow – (All Exchanges):
∴ Netflow remains negative on 7-day average;
∴ Sustained outflows indicate strategic accumulation or self-custody preference;
∴ No evidence of large-scale exchange inflows that signal distribution.
✴️ Conclusion: Net capital migration continues favoring off-exchange security; bullish underlying tone.
⊢
▦ Stablecoin Supply Ratio (SSR):
∴ SSR near 17.5 indicates relatively low stablecoin dominance;
∴ Reduced buying power vs Bitcoin implies cooling short-term demand;
∴ Historically elevated SSR levels precede price consolidations or local tops.
✴️ Conclusion: Stablecoin reserves insufficient for sustained upward pressure; caution warranted.
⊢
▦ Exchange Whale Ratio – (All Exchanges):
∴ Whale Ratio near 0.59 denotes moderate large-holder activity;
∴ Ratio not in critical zone (>0.7), yet above accumulation range (<0.4);
∴ Potential soft distribution behavior if ratio trends upward.
✴️ Conclusion: Mixed signal - no panic, but latent whale presence requires monitoring.
⊢
▦ Miner Reserve:
∴ Miner balances steadily declining over past 30 days;
∴ Consistent outflows suggest controlled selling behavior;
∴ No aggressive miner dumping detected.
✴️ Conclusion: Miner pressure exists but remains tactical and non-destructive.
⊢
▦ Long-Term Holder SOPR (LTH-SOPR):
∴ Metric above 1.0 indicates long-term holders are in profit and realizing gains;
∴ No sharp spike detected, suggesting rational distribution;
∴ Structure consistent with healthy bull cycle mechanics.
✴️ Conclusion: Profit-taking underway in equilibrium; not a signal of panic.
⊢
▦ Funding Rate – (Futures):
∴ Funding mildly positive (~0.002–0.004%), reflecting long positioning bias;
∴ Rates remain low, indicating lack of overcrowded trades;
∴ No sign of speculative overheating in derivatives.
✴️ Conclusion: Derivatives sentiment is constructive, not euphoric; room for further upside exists.
⊢
🜎 Strategic Insight – On-Chain Oracle:
∴ On-chain metrics reflect a stable yet cautious accumulation phase;
∴ Absence of sell pressure, tempered long-term holder realization, and moderate derivative sentiment suggest foundation for continuation, albeit with reduced immediate force;
∴ Confirmation must align with price and volume.
⊢
⧉ III. Contextvs Macro–Geopoliticvs – Interflux Economicvs:
▦ Geopolitical Axis – Middle East Ceasefire:
∴ Ceasefire between Israel and Iran eased global tension, triggering flight from commodities into risk assets;
∴ Brent crude declined over -2.5% following truce reports, reducing inflationary pressure;
∴ However, geopolitical fragility remains - peace is provisional, not structural;
✴️ Conclusion: Tactical relief observed; no systemic safety guaranteed.
⊢
▦ Monetary Policy – US Federal Reserve Outlook:
∴ Jerome Powell signals continued rate hold, citing sticky inflation and fragile global equilibrium;
∴ Futures markets price ~20% chance of July cut, ~60% for September;
∴ Bond yields retreating (2Y at ~3.78%), suggesting easing expectations embedded;
✴️ Conclusion: Macro liquidity conditions marginally favorable to crypto; policy risk remains asymmetric.
⊢
▦ Equities & Global Sentiment – Dow Jones / Nasdaq Futures:
∴ Dow Futures flat (~+0.02%), Nasdaq Futures rise on tech optimism;
∴ Equity markets supported by decline in oil, stabilization in rates, and AI-sector inflows;
∴ No VIX spike – volatility subdued;
✴️ Conclusion: Macro-risk appetite firming up, enhancing crypto’s speculative appeal.
⊢
▦ Derivatives Behavior & Institutional Flow:
∴ Option markets show accumulation of BTC calls at 108K–112K strike zones;
∴ Futures funding positive but low, consistent with healthy long-side conviction;
∴ No structural imbalance detected;
✴️ Conclusion: Derivatives support scenario of moderate bullishness without speculative overreach.
⊢
⌘ Codicillus Silentii – Strategic Note:
∴ Temporal architecture remains bullishly aligned, but lacks velocity – movement is present without ignition;
∴ On-chain metrics reveal quiet distribution among long-term holders, yet without aggressive miner displacement or exchange flooding;
∴ Market tension is suspended in a state of equilibrium – neither contraction nor breakout assert dominion;
∴ The asymmetry of opportunity lies dormant, awaiting conviction in participation and volume.
⊢
𓂀 Stoic-Structural Interpretation:
▦ Structurally Bullish – Tactically Suspended:
∴ Price structure above EMA21 and SMA200 confirms preservation of macro uptrend – foundation remains unbroken;
∴ Miner reserve reduction and stable LTH-SOPR suggest controlled realization, not structural weakness;
∴ However, Ichimoku flattening and low volume expansion indicate stalling momentum, lacking breakout substance.
⊢
▦ Tactical Range Caution:
∴ Whale Ratio mid-levels and SSR elevation highlight proximity to potential resistance exhaustion;
∴ MACD crossover remains unconfirmed; RSI enters constructive zone without strength – reactionary rather than initiative-based;
∴ Until volume and oscillator confirmation emerge above $108.2K, posture remains protective and selective.
⊢
⧉
⚜️ Magister Arcanvm (𝟙⟠) – Vox Primordialis!
𓂀 Wisdom begins in silence. Precision unfolds in strategy.
⧉
⊢

BTC/USDT – 4-Hour Chart AnalysisPattern: Bullish Harmonic Reversal – BAT Pattern
Bitcoin has completed a harmonic Bullish Bat Pattern, suggesting a potential upside reversal from the D point.
Current price: $107,186
The harmonic structure follows ideal ratios:
AB retraces 30.2% of XA
BC extends 118.1% of AB
CD completes near 88.6% of XA – confirming the Bat pattern
Trade Plan:
Many traders have already entered positions.
However, if price retraces to the $104k level, a re-entry opportunity exists with a stop loss around $100k—just below the D-point and strong support zone.
Targeting the yellow upward path, the structure supports a continuation toward new highs, possibly surpassing $115k–$120k, depending on momentum.
RSI (14):
RSI is currently 67.99, approaching overbought but still supportive of bullish continuation.
A recent bullish RSI divergence strengthens the reversal scenario.
Conclusion:
This harmonic Bat pattern suggests a strong bullish structure is forming. As long as price holds above the $100k zone, buyers may continue to dominate, with high probability setups forming for trend continuation.
