BTC Trade Set Up Dec 16 2025I am expecting a continuation of the bearish trend especially if price respects this 4h FVG. The target is demand and lower SSL
Market insights

Btc possible Head and shoulders Looks like a possible head and shoulders forming on the daily time frame,I hope I'm wrong

btc downI think bitcoin its going to do the same like it did once. I dont know why.
I think bitcoin its going to do the same like it did once. I dont know why.
I think bitcoin its going to do the same like it did once. I dont know why.
I think bitcoin its going to do the same like it did once. I dont know why.

BTC/USD Breakdown falling soon consolidation area breakdown🚨 BTCUSD – Sell Setup Alert 🚨
📉 Market Outlook:
BTCUSD is showing signs of bullish trend breakdown, followed by consolidation breakdown. Price has already retested the breakdown zone, and rejection is confirmed.
🔻 Trade Idea:
Pair: BTCUSD
Timeframe: 1H ⏱️
Sell Zone: 89,800 (Breakdown Area)
Technical Target: 🎯 88,200
📊 Technical Structure:
✔️ Bullish structure breakdown
✔️ Consolidation breakdown confirmed
✔️ Retest completed
✔️ Bearish momentum building
🛡️ Risk Management:
Always use proper risk management
Risk only what you can afford to lose
Follow your trading plan strictly
⚠️ Note: This is a technical setup based on price action. Trade responsibly.
👍 Like | 💬 Comment | 📌 Follow | 🔁 Share
#BTCUSD #Bitcoin #ForexTrading #CryptoTrading #PriceAction #TechnicalAnalysis #RiskManagement #1HTimeframe

BTCUSD Range Rejection SetupBitcoin is moving inside a clear range. Price rejected from the upper zone and is showing signs of a move back toward the lower support area.

Bounce in bitcoin for nowThis channel is not providing individualized trading or investment advice, nor is it a banking service, brokerage service, trading service, investment service or money management service

Bitcoin Forecast: Yen Carry Trade Unwind Risks Another Sharp BTCInstrument: BTC/USD
Bias: Bearish (short-term), volatile consolidation
Timeframe: Daily / Weekly
Current price: ~$86,050
⸻
Market Snapshot
Bitcoin remains under pressure after failing to hold the $90,000–$92,000 supply zone. The breakdown triggered a wave of leveraged long liquidations (~$200M), accelerating the move toward the lower end of the recent range.
Despite the sell-off, price action is still contained within the broader $85,000–$94,000 range, suggesting controlled deleveraging rather than panic.
⸻
Key Macro Driver: Yen Carry Trade Unwind
The dominant risk factor is rising expectations of a Bank of Japan rate hike:
• Market pricing implies >90% probability of a BoJ hike
• A stronger JPY forces investors to unwind yen-funded carry trades
• Historically, BoJ hikes have coincided with 20–30% BTC drawdowns
• Pre-emptive risk reduction is already visible across crypto and equities
This macro pressure is reinforced by:
• Weak tech stocks
• Fed rate-cut expectations shifting into 2026
• Thin liquidity conditions amplifying moves
⸻
Flows & Positioning
• $125–200M in BTC long liquidations over 24h
• ~$293M total crypto liquidations
• Market maker Wintermute reportedly sold ~$1.5B BTC for risk rebalancing
• Sentiment deeply bearish: Fear & Greed Index in low 20s (Extreme Fear)
Importantly, spot Bitcoin ETF inflows remain constructive, signaling persistent long-term demand beneath the surface.
⸻
Technical Structure
• Momentum indicators (RSI, MACD) remain weak on daily charts
• Price rejected cleanly from the $90K–$92K resistance band
• Liquidity remains shallow → higher downside sensitivity
⸻
Key Levels to Watch
Resistance:
• 90,000–91,000 (trend stabilization zone)
• 95,000 (short-covering trigger)
Support:
• 88,000 (near-term pivot)
• 85,000 (range support)
• 82,000–77,000 (next downside targets)
• 70,000 (tail-risk scenario if BoJ surprises hawkishly)
⸻
Outlook
• Base case: Continued choppy downside pressure as carry trades unwind
• Bearish extension: Break below $85K opens path to $82K–$77K
• Stabilization scenario: Reclaiming $90K+ could trigger short-covering toward $95K
Macro clarity (BoJ decision, US inflation, Fed guidance) will be decisive.
⸻
Bottom Line
Bitcoin is not collapsing — it is deleveraging in a macro-driven risk-off phase. Until the yen carry trade risk clears, rallies are likely to be sold into. Respect volatility, prioritize risk management, and watch $85K–$90K as the defining range.

BTC - $59,000 INCOMING! BTC did so many bad things this week that I am still a bit confused by all the metrics I am reading. Extremely rare confluence of signals. 1) There should have been a much larger rally from the $79k lows. This was the 1st time down to the 37.5% retracement line. That rally died fast at 1st resistance and has rolled over. A new low seems immediately in the cards in the next week. 2) This now looks like its setting to be a clean 5 waves down, and the current wave, the 5th wave looks like it will extend. Making the next leg longer than the previous 3rd wave. This puts BTC at lower than $59K. 3) We fell so rapidly, and at such a steep decline that all supportive diagonals are all all thousands of dollars down. This is exactly the way that wave 5 extend.

BTC - Do you See... What I see?Charting a decades worth of trades isn't easy. But when in doubt, you must zoom out. Do you see what I see? BTC price has fallen completely out of order. 80k is immanent maybe even 60k. Once the first red line breaks... there be a big earthquake that will scare and shake out most doubters and traders that want to save face. BITSTAMP:BTCUSD Is here to stay, but we might see a while until recovery.

my martingale strategy on BTCthis is the places I am putting buy and sell for BTC at of now, hope I can make some money XD

Daily Analysis Bitcoin: 16/12/25Bitcoin may find support now, along with backup from the fundamental developments.
Prices for support, and resistance, are all mentioned in the video, along with invalidation of bullish bias.

Bitcoin Bulls Need A Rally Soon or Price May Test 80-75k.Bitcoin is looking pretty weak and is at an important spot on my charts. We were tracing out a bear flag and price broke down out of this flag today. We are also sitting below all of my important MA's with all of them curling down. Bulls are clinging on to the last lifeline short term which is a series of higher lows with support at 85k and 83450. I would definitely be leaning short here so selling any rallies up to 87.5k and the 8MA(89483) that fail would be good entries along with a break/hold below 85k to target 83.5, 80k. A hold below 80k is where I would press shorts for 76k, 72k. If you have to be long you could try right here (85880) with a stop below 85k but this is big time counter trend and not advised unless you're gambling for a bottom tick. A safer long is to wait for a look below and fail of 83k, 80k or a reclaim of the 8MA(89483).

BTC hold then moonshotWill be looking to accumulate between the 40-40k with an ETA July - December 26’ which should then rally us to the $200k+ prior to the next halving in 28’

BTC CRUCIAL SUPPORT RESISTANCEBe very careful before any upward trade is taken in BTC. As it looks at a point where it can drag it down to 62k or hold for some time same level and then move up

Bitcoin Repeats a Familiar Pattern - NEXTZone Is Already Defined🔹 MARKET BRIEFING – BTC/USD (1H)
Market State:
– Bitcoin is once again trading inside a repeating range structure, similar to the previous consolidation phases marked (1 → 3).
– Price has just rebounded from the lower demand area and is now holding above short-term support, while still trading below the key moving averages, keeping the broader structure neutral-to-corrective.
Key Technical Levels:
– Demand / Base Zone: 87,800 – 88,600
– Mid-Range Reaction Level: 90,000 – 90,300
– Major Resistance / Supply Zone: 93,000 – 93,500
– The projected move toward zone (4) aligns with prior range highs and unfilled liquidity.
🌍 Macro Context – Why This Remains a Range, Not a Breakout
– Federal Reserve: Policy expectations remain stable with no immediate liquidity expansion signal. This limits impulsive upside in risk assets.
– Liquidity Conditions: The recent downside move cleared leveraged longs, enabling a technical rebound, but macro liquidity is not supportive of trend continuation yet.
– Risk Sentiment: Broader markets continue to show consolidation behavior, reinforcing mean-reversion rather than directional conviction.
Next Move:
– A controlled push toward 90,000–90,300 is likely as part of a corrective recovery.
– Extension toward the 93,000–93,500 resistance zone is possible, but this area is expected to act as a decision point, not an automatic breakout.
– Only acceptance above 93,500 would invalidate the range-based thesis and shift the bias toward trend continuation.
Bottom Line:
– Bitcoin is following a structured, repeating range pattern, not randomness.
– Until macro conditions shift, rallies should be viewed as range extensions into resistance, not confirmed trend reversals.

BTCUSD: Bearish Trend Confirmed with Downside TargetsAs per the updated analysis, BTCUSD has reversed its previous bullish momentum and is now poised for a downtrend toward lower targets. The chart shows a well-defined resistance zone at 91,563, where price has started to recoil and move lower.
🔹 Market State: Bearish Reversal Confirmed
BTCUSD has now entered a consolidation phase below the resistance zone, with price rejecting the higher levels around 91,563.
The market is setting up for a downside continuation with clear price action signals. The move lower has already begun, and targets are positioned around 89,200 (Target 1), 88,000 (Target 2), and 86,386 (Target 3).
🔹 Macro Factors Driving the Decline:
1. Risk-Off Sentiment Prevails
Yesterday's decline can be attributed to the broad market risk-off sentiment. Concerns about global economic uncertainty, geopolitical tensions, and weaker-than-expected economic data are pressuring risk assets like Bitcoin.
2. Strong USD and Profit-Taking
The US dollar’s strength has been a key factor in BTC's retreat. As the dollar rises, investors typically retreat to more secure assets, causing Bitcoin and other risk assets to experience declines.
Profit-taking after Bitcoin's recent surge also contributed to the market's downward movement.
3. Fed Rate Expectations
Fed's hawkish stance (with interest rates possibly staying higher for longer) is placing further pressure on risk assets, making them less attractive to investors. This also increases the capital inflow into USD and dampens demand for Bitcoin.
4. Macro Data Weakness
Poor economic indicators such as reduced job growth or disappointing inflation figures could contribute to the broader market decline. The weak economic data creates more uncertainty, prompting liquidation of higher-risk assets.
🔹 Price Expectations and Targets:
Resistance Zone: 91,563 (Key Rejection Point)
Target 1: 89,200
Target 2: 88,000
Target 3: 86,386
As long as price remains below 91,563, the bearish continuation setup is intact, and the market is expected to decline towards Target 1, then Target 2 and Target 3.

BTC? Free flow?Hi,
So it is what it is.
Liquidation, margin call etc.
Below 70K is a possibility. Will need to see later when previous supports are tested.
Those my 2c
Not a guru
All the best


BTC SELL Scenario One: Bitcoin stalls around the 52,296 level. This scenario represents the weaker probability.
Scenario Two: A decline toward the 24,000 level, which is considered the stronger and more likely scenario.

Bitcoin bullish signal confirmed.Bullish Catalyst Logic: Three-Pronged Support Builds the Foundation for a Rebound
1.Macro Credit Hedge Value Comes to the Fore
An anomalous phenomenon of long-term interest rate hikes emerged after the Fed’s December rate cut. This essentially reflects investors pricing in the "erosion of Federal Reserve independence", which has shaken the credit foundation of the U.S. dollar.
Bitcoin’s fixed total supply and decentralized nature make it a core asset for hedging sovereign credit risks. Historical data shows that during periods of central bank credit deterioration, the substitution correlation between Bitcoin and gold rises to 0.68. Combined with the implicit liquidity easing brought by the Fed’s $40 billion 30-day Treasury bill purchase program, this forms a dual macro support framework of credit hedging + capital backstop.
2. Clear Technical Oversold Rebound Signals
After plummeting 31.5% from its peak of $126,000, Bitcoin’s daily RSI has dropped to 32.8, hovering near the oversold threshold (30). Meanwhile, a hammer candlestick pattern has formed on the 4-hour chart, the MACD green bars are continuously narrowing, and the fast and slow lines show signs of turning upward — all pointing to a gradual exhaustion of downward momentum.
The key support system remains robust:
$83,680 marks the intersection of the 100-week SMA and the macro uptrend line, carrying significant technical significance;
$85,000 served as the rebound low after the recent sharp decline, forming a resonance of psychological support and capital absorption.
Currently, the price is trading outside the Bollinger Bands channel. Historical patterns indicate a greater than 80% probability of a return to the channel after a breakout, signaling strong short-term rebound demand.
3. Capital Flow: Selling Pressure Fades + Bargain-Hunting Signals Emerge
On-chain data reveals that capital inflows from "full-coin holders" into exchanges have hit a cyclical low, indicating a marked weakening of selling pressure. The proportion of holdings by Long-Term Holders (LTH) has climbed to 78.6%, a new high for the year.
Signals of whale cold wallet transfers have appeared in the $84,000-$86,000 range, with over 5,200 BTC withdrawn from exchanges in the past 24 hours — a clear sign of institutional accumulation. Additionally, ETF capital flows have seen marginal improvement: spot ETFs recorded a net inflow of $287 million last week, with BlackRock’s IBIT contributing $214 million, reversing the previous trend of sustained outflows.

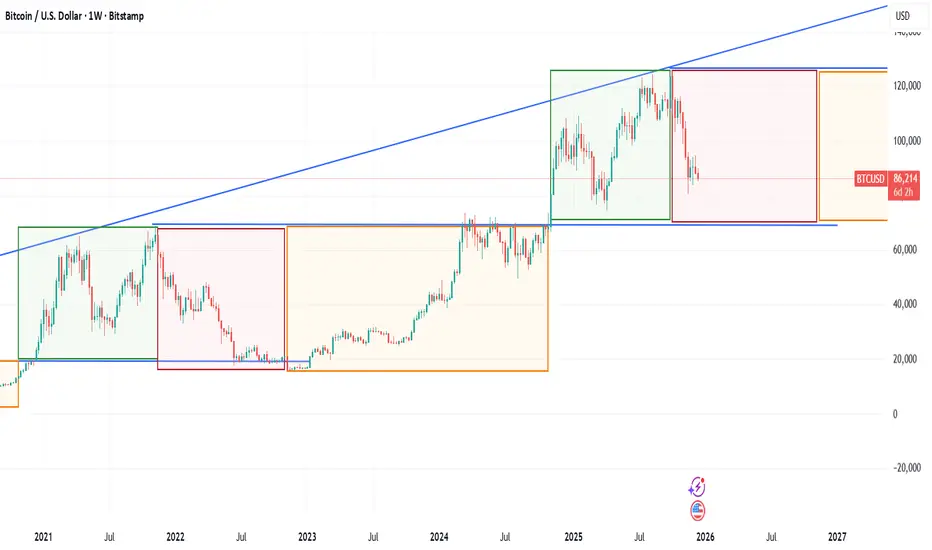
BTC Prediction Weekly chartBTC Prediction Weekly chart, it shows prediction for next cycle until broken is firm.
BTC Recap on some scenario's, and looking forwardHi Traders,
The scenario's I drew:
1. Long (liquidity grab below the range), this one was difficult to get in on te rotation because of the V-shape. You should have placed an aggressive direct play, or have looked on the 1-3 minute timeframe for rotation.
and
2. Short (support becomes resistance) played out wel. This one was good to trade. As a direct play, on the low time frame rotation and even gave a second chance with a double confirmation.
Curious to see if scenario 3. (support level) also will give us a reaction to trade on. Looking for a rotation on the lower timeframes at that level around 85k. But only at the confirmation.
If 85k does not hold. Then 76k will be the first stop and if that does not hold 68,5k. See my HTF analyses earlier on.
Trade what you see, not what you expect..
Good trading to you all.
M.

Bitcoin breaking down from rising wedgeThis bearish continuation pattern suggests further weakness in the near future for bitcoin.
