BTCUSD H4-Keep entering and exiting Follow a Plan #BTCUSD #SMCTRADE BUY BTCUSD TIME FRAME H4 : BTCUSD H4-Keep entering and exiting Follow a Plan #BTCUSD #SMC
BITCOIN trade ideas

Bitcoin Trend AnalysisBITSTAMP:BTCUSD BINANCE:BTCUSDT COINBASE:BTCUSD INDEX:BTCUSD
BTCUSD trend shows multiple bearish indications.
- Monthly RSI bearish divergence. This is the 3rd monthly bearish divergence in the entire BTC history. The previous one was the ATH before the 2022 recession. BTC price dropped 70% in 2022.
- Weekly RSI downtrend.
- Weekly MACD downtrend.
- Weekly bearish momentum red candles and downtrend wicks.
If the history repeats itself and BTC drops 70% like in 2022, it will find its final support around 31,500, but we don't know for sure yet. Before that, a few key levels of support needs to be penetrated. 75,000 is a major support we need to watch for.

BTC Inverse H&S Still on TrackWe have tracked this Inverse head and shoulders since first testing the all times highs. We expected another test of ATH to start the next correction leg down. We are not tracking a trip back to $92,000-$89,000 to set up a major H&S pattern that should initiate our next impulse to $150,000-$180,000 to mark the end of the bull market. Lets see how June 2025 monthly candle closes.

We need to hold the line! I’m not too bearish just yet
Definitely looking for this line to hold.
Still above 100k
Think we will be just fine
One more week left in the month

BTC USDT PLAN I favor a short-term pullback unless BTC can reclaim and close above the $111K–112K zone with strong volume.
If price breaks below $106K and confirms it as resistance, it could accelerate a move toward $100K and below.
Caution is warranted for bulls — this looks more like a distribution phase near the highs than a breakout.

Long term parabola setting up on weeklyJust a reminder to zoom out and observe the weekly trend. Even though on a daily basis it may seem we are grinding sideways, if we look at the weekly the trend is getting steeper and steeper, if this holds up we're not far away from starting a huge parabolic move.

BTC posibility if fundamental favoursBTC posibility if fundamental favours.
This baby has beenrushing downhill for afew days now.
As always, my thoughts are on the chart.
Please trade this RR of 1:1.69 with care

ABC Flag / Support LevelAn ABC flag looks to be playing out. If so, BTC's price should not dip below 100 again, but if it does, there is nothing but air until the 95-96 order block.

The Bears and the Bulls So Bitcoin is consolidating from 101K to 109K, from an uptrend which is probably but not certainly a continuation pattern. BTC is still above the 10 EMA means bullish short-term, confluent with market structure, and above 200 EMA long term bullish. BTC might cycle back up in the flag pattern or break below the 10 EMA, which could possibly (not certainly) send it probably to the 50 EMA in purple and the trendline and a Demand zone. The bulls would love for BTC to close above the flag pattern and resistance and make HH and HL from there; and the bears would love to see rejection and a return back to the Demand levels.

BTC to new ATH, wanna bet?The only objection I have on this trade is 100400 level. If price comes there, I will buy more but for now, I think it will push up from here.
Entry is below 101800 if stoploss is still holding...
TP1 @ 112k
TP2 @ 120k
Enjoy
Follow me as my trades are mainly market orders, so you will see the trades on time and enter on time.
no need riskIt seems that BTC is in decline and taking inspiration from the past, I think the closest place to the averages is the safest place to buy. The safest... then I will look at the charts and evaluate the situation. If it does not look healthy, I will focus on the 2nd target.

BTCUSDT - major support, Cut n Reverse Area??#BTCUSDT... market just r ached at his one of the most expensive area of the week and month
Keep close 101200
That is our ultimate supporting area.
Note: below 101200 we will cut n reverse on confirmation.
Good luck
Trade wisely

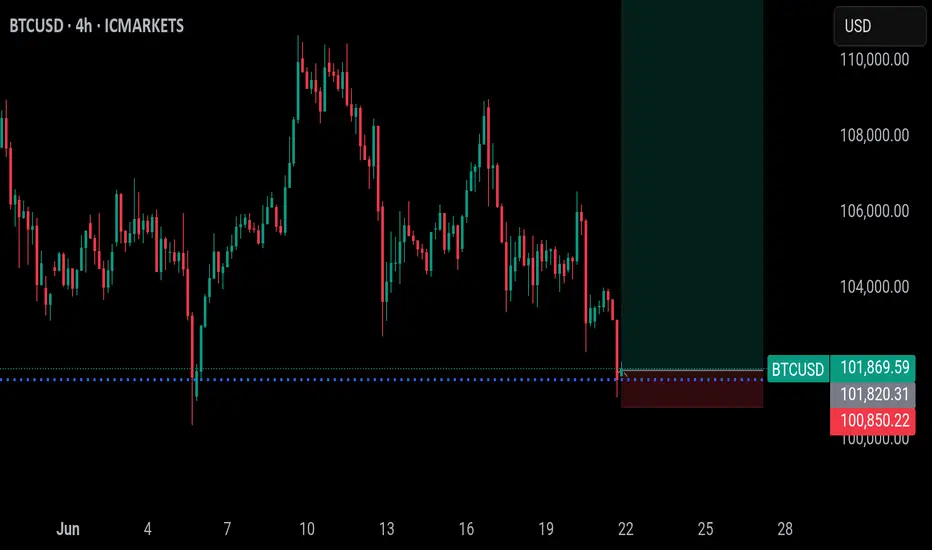
Bitcoin / U.S. Dollar 2-Hour Chart (BTCUSD)2-hour chart displays the recent price movement of Bitcoin (BTC) against the U.S. Dollar (USD), showing a current price of $102,459.21 with a decline of $853.19 (-0.83%) over the period. The chart highlights a significant drop from a peak near $105,898.45, with a shaded area indicating a potential support zone between $101,682.19 and $99,732.49, and a resistance level around $103,000. The timeframe spans from 9:00 to 29:00, with technical indicators and price levels marked for analysis.

Bitcoin Dip Coming Soon1. Historical Example (Left Side of the Chart - around 2021-2022):
"NFT" Label at the Top: The trader has labeled a peak around late 2021 with "NFT." This likely signifies a period of market euphoria or a local top, possibly correlated with a peak in NFT hype.
Failure to Make New Highs / Bearish Structure: After this peak, the price action shows lower highs and lower lows, indicating a downtrend.
Break of Support: The price broke down from a previous support area.
Targeting Previous Demand: The arrow points down towards a shaded maroon box. This box represents a significant area of previous demand/support FVG (roughly $15,000 - $30,000 in this hypothetical chart) where buyers previously stepped in, or where price consolidated before a major move up. The expectation was that price would revisit this significant prior zone.
2. Current/Projected Scenario (Right Side of the Chart - 2025 onwards):
"NFT" Label at the Current Top: Again, an "NFT" label is placed near the recent high (around
105,000 − 105,000− 110,000 in this chart). This suggests the market is again at a euphoric peak or a significant local top.
Potential Double Top / Rejection: The price has made a significant high and seems to be struggling to push further, showing signs of rejection (as indicated by the recent candles with upper wicks and a potential downturn). This could be forming a double top or a lower high relative to the absolute peak.
Two-Stage Short Target:
First Target (Short Arrow): The shorter arrow points down to a horizontal line around the $75,000 - $80,000 level. This is likely a near-term support level, perhaps a previous swing low or an area of recent consolidation. A break below the current highs might lead to a test of this level.
Second, Larger Target (Long Arrow): The longer arrow points down to a much larger shaded maroon box. This box (roughly $30,000 - $40,000 in this chart) represents a significant, longer-term demand/support zone. This zone was a major area of consolidation or previous resistance that turned into support before the most recent leg up to the $100k+ levels.
Rationale for the Deeper Target: If the near-term support (around 75k−75k−80k) fails to hold, the trader expects a more significant correction.

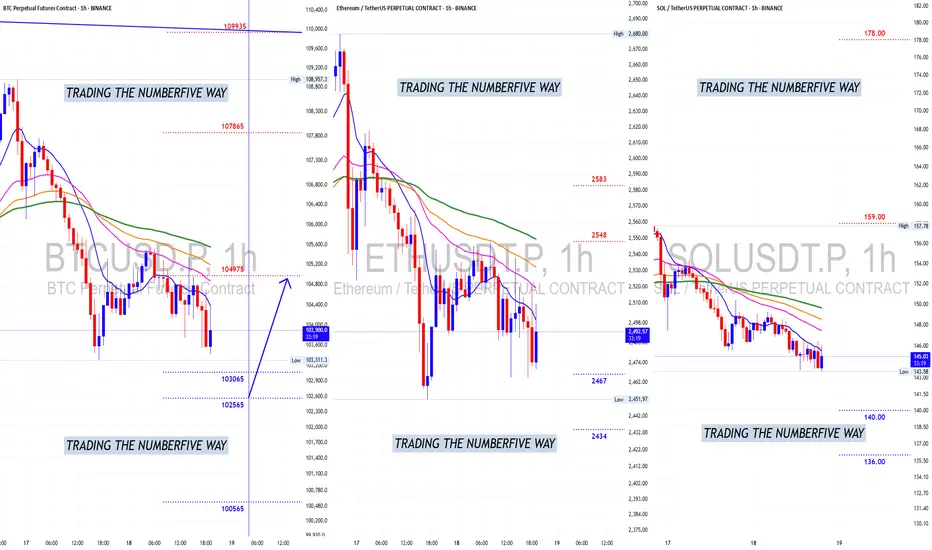
BITCOIN Getting Ready For The 1hr Bounce.Alright ladies and gentlemen, bears 1hr tf party almost completed.
Vertical blue line is where it ends and Bulls take over again, so whatever price drops when it reaches that vertical blue line (if not sooner) that will be it and will start bouncing.
Now, if the bounce starts from a point too low (near $100k ) and doesn't breaks above $107k again then brace for a hard landing next week cause bulls are getting weaker and weaker on every drop and if this pattern continues then we will see numbers below $100k by next week.
It is very important for price to end this week candle above $109k .
Buckle up ladies and gentlemen, we are heading for a rough end of week.
Best areas to enter for next bounce are below $102500 with liquidation point below $100k with low lev recommended. Use lev wisely.
Know the rules of the game....play it right. Have a nice trading day.

Bitcoin vs Global M2: The 90-Day Liquidity LagComparing Bitcoin’s price action to the Global M2 Money Supply with a 90-day offset reveals potential macro-driven trends. As liquidity expands or contracts globally, Bitcoin often reacts with a delay. This chart aims to visualize the relationship between monetary expansion and BTC price movement, helping spot broader cycle shifts and long-term momentum.

Bitcoin Bullish Pennant(D)Bitcoin is forming a bullish pennant on the daily timeframe. A classic continuation pattern following strong upward momentum. A breakout above the resistance trendline could signal the next leg up. Watching closely for volume confirmation and a potential retest before continuation. Bullish bias remains intact as long as support holds.

Bitcoin CME Gap June 21thBitcoin has a CME gap at $103.292 . Historically, these gaps tend to get filled and if it happens again, it could mean a short-term move before continuation.

Altseason AnalysisTo determine whether we're approaching a true Altseason, we're analyzing the macro relationship between Bitcoin Dominance (BTC.D) and Total 2 (the total crypto market cap excluding Bitcoin). This comparison has consistently revealed where capital is flowing and helps signal shifts in market cycles.
Current Market Structure
BTC Dominance: Currently at 64% and testing resistance zone.
A breakdown below 57% could trigger fresh capital rotation into alts.
Total 2: Hovering near 1.2T ; watching for breakout confirmation.
What Triggers an Altseason?
BTC stability or slow upward grind: Altcoins thrive when Bitcoin is stable not crashing, not parabolic.
BTC.D Breakdown: Often the first real signal. Look for confluence with Total 2 breakout.
Capital Rotation: Watch Ethereum and majors big cap — they usually lead before microcaps follow.
BTC.D Breakdown: Often the first real signal. Look for confluence with Total 2 breakout.
$5 Trillion??
Breakout above $1.7T ATH in Total 2 opens the door for exponential price discovery.
Key resistance zones: $2T → $3.5T → $5T
Watch for volume surge + BTC.D breakdown for strong confirmation.
Caution:
Not every BTC.D dip leads to an Altseason fakeouts happen. Confirm with Total 2 strength and sector rotation.

Cycle Last LegThis present cycle is near its end. Pico top will arrive soon, probably by the end of November. BTC is currently ranging (103-109) forming a new base at 106, which is the current point of control. The start of the next and final up leg should start early July, so we have less than 2 weeks to remain patient.
Stand fast. Keep faith. Remain vigilant.

Bitcoin downside all but confirmed, sub 100k next- follow up analysis on this one:
- with the original analysis posted in late May, more than a month later and Bitcoin is still struggling near ATH levels
- with weekly bearish divergence now confirmed, odds of a downside move are very high
- Iran v Israel conflict acting as a strong headwind for all markets, should the USA get involved I expect that effect to increase tenfold
Needs to be said that a pullback to 90 or even the mid 80k region would still constitute a higher low on the very large time-frames. Structurally wise, as long as BTC is above 75k, the macro trend is still one of a bull nature.

Short-Term BTC Short Setup Bitcoin is currently showing signs of completing a corrective wave (4) in a potential Elliott Wave structure. The current rising wedge (ABCDE) pattern suggests a likely short-term breakdown toward the $101,000–$100,000 support zone. This short position aligns with the ongoing short-term bearish momentum (wave 5 expected), but within a broader bullish trend. Long-term outlook remains positive, with the potential for a strong continuation upward once the correction is complete. ;D
