BTCUSD: Is This Consolidation Building the Next Expansion?Bitcoin has transitioned from a strong impulsive selloff into a more compressed and irregular price structure, suggesting the market may be shifting from panic-driven movement into recalibration. Momentum has slowed, but volatility remains present, indicating that participation has not fully exited the market.
This type of price behaviour often appears when short-term direction becomes unclear and liquidity begins to rebalance ahead of a larger decision. Rather than a clean continuation, the structure currently reflects uncertainty, a common precursor to a sharper move once conviction returns.
The coming sessions should provide greater clarity as Bitcoin approaches a point where patience, not prediction, becomes the key advantage.
**Disclosure:** We are part of Trade Nation's Influencer program and receive a monthly fee for using their TradingView charts in our analysis.
Market insights

BTC/USD Liquidity Blueprint – Are You Reading the Flow Right?🎯 BTC/USD: The Great Heist Setup | Swing Trade Blueprint 💰
📊 Market Overview
Asset: BTC/USD (BITCOIN/US DOLLAR)
Market: Cryptocurrency
Trade Type: Swing Trade
Strategy Style: The Thief Method™ (Layered Entry System)
🎨 Technical Setup
📈 Market Structure: BULLISH CONFIRMED
The Simple Moving Average is showing strong accumulation patterns with a healthy pullback structure. Bulls are loading up their bags like thieves preparing for the ultimate vault heist! 🏃♂️💨
Key Technical Indicators:
✅ SMA showing strong bullish accumulation
✅ Pullback phase completed
✅ Higher lows formation intact
✅ Volume supporting upside momentum
🎯 The Heist Plan: Entry Strategy
💎 The Thief Layered Entry System
Instead of going all-in at one price (that's how amateurs get caught! 👮), we're using a professional layered approach with multiple buy limit orders:
Entry Layers:
🔹 Layer 1: $108,000
🔹 Layer 2: $109,000
🔹 Layer 3: $110,000
🔹 Layer 4: $111,000
🔹 Layer 5: $112,000
💡 Pro Tip: You can add more layers or adjust based on your bag size and risk appetite. The beauty of this strategy? You average into position like a pro! 🎭
🛡️ Risk Management
⛔ Stop Loss: $106,000
⚠️ Important Note: Dear Thief OG's (Ladies & Gentlemen),
This is MY stop loss based on MY risk tolerance. You're the captain of your own ship! 🚢 Set your SL according to YOUR risk management rules. Remember: Take profits at your own risk, protect capital like it's your treasure!
🎯 Target Zone: The Great Escape
🚨 Target: $124,000
Why this target?
The "Police Barricade" (strong resistance zone) sits right here with multiple confluence factors:
🔴 Major resistance level
🔴 Overbought conditions expected
🔴 Bull trap zone activated
🔴 Historical rejection area
🏃♂️ Exit Strategy: When we hit this zone, it's time to take your loot and run! Don't get greedy and caught in the trap!
⚠️ Important Note: Dear Thief OG's (Ladies & Gentlemen),
This is MY take profit target. You're free to take profits whenever YOU feel comfortable. Your money, your rules, your timeline! 💰
🔗 Correlated Pairs to Watch
Keep your eyes on these related assets for confirmation:
💱 Major Correlations:
BITSTAMP:ETHUSD - Typically follows BTC momentum; watch for similar accumulation
BINANCE:BTCUSDT - Alternative pairing for liquidity confirmation
TVC:DXY (US Dollar Index) - Inverse correlation; weakness in DXY = strength in BTC
$SPX/SPY (S&P 500) - Risk-on sentiment indicator
GOLD ( OANDA:XAUUSD ) - Alternative store of value; competitive correlation
📍 Key Correlation Points:
When DXY weakens, crypto typically strengthens
Traditional market risk-on flows support Bitcoin upside
ETH/BTC ratio helps confirm alt-season vs BTC dominance
Gold movements indicate macro hedging flows
⚙️ Why The Thief Strategy Works
✨ Dollar-Cost Averaging (DCA) on steroids
✨ Reduces emotional decision-making
✨ Better average entry price
✨ Lower risk per order
✨ Professional money management
Think like a thief planning the perfect heist: multiple entry points, calculated risks, clear escape route! 🎭
🎬 Final Thoughts
This isn't financial advice—it's a strategic blueprint for those who trade with discipline and style! The market is our playground, but only the smart thieves get to keep their loot. 🏆
Remember:
📊 Stick to your plan
🎯 Manage your risk
💰 Take profits systematically
🧠 Trade with logic, not emotion
🎭 Execute like a professional
📣 Support This Analysis
✨ If you find value in my analysis, a 👍 and 🚀 boost is much appreciated — it helps me share more setups with the community!
#Bitcoin #BTCUSD #CryptoTrading #SwingTrade #TradingStrategy #TechnicalAnalysis #CryptoAnalysis #BTC #LayeredEntry #RiskManagement #ThiefStrategy #CryptoSignals #BitcoinAnalysis #PriceAction #TradingSetup #CryptoTA #BTCSetup #SwingTrading
🎯 Stay sharp, trade smart, and may the profits be with you! 🚀

145,000 to 30,000 the Great Resetit explain itself be ready for the next buying opportinity between Juni-Sep.2026 for every know trading market.
April.2026 is a dengerous Zone and the best selling opportinity for all Markets and all Coins

Bitcoin rebound expectedMacro Liquidity: Interest Rate Cut Implemented & QT Terminated, Leading to Easy Capital Conditions
The Federal Reserve has successfully carried out its third interest rate cut of the year as scheduled in December. Although it did not issue additional dovish guidance, the keynote of accommodative policies has been firmly established. The key supporting factors are as follows: ① The Federal Reserve has launched a 30-day plan to purchase $40 billion worth of Treasury bonds, which directly injects short-term liquidity into the market and eases the tension of capital strain. ② The Quantitative Tightening (QT) policy was officially terminated on December 1st, putting an end to the monthly withdrawal of $95 billion in liquidity and laying a fundamental underpinning for risk assets. ③ The US Dollar Index has pulled back to 98.36 and maintained a strong negative correlation with Bitcoin; the weakening of the US dollar has further opened up room for upward movement. Currently, the market has fully absorbed the pressure from "weaker-than-expected policies", and the dividends from loose liquidity are being gradually unleashed.
Bitcoin trading strategy
buy:89000-90000
tp:92000-93000-95000
sl:88000

An old BITCOIN idea played out and now, we could see a recovery
I posted this idea back in early October and, as we see, the bearish W patter played out.
We had had an earlier Bullish W patter ( or Dounle Bottom)
The chances were PA would go either way on the 2nd and the Measured moves are shown with Vertical lines.
As you see, we went to nearly exactly the RED Bearish Measured move this time
And so now, we can expect what ?
The Daily MACD
The Daily MACD Fell Deep into OverSold and has been recovering, is still below Neutral.
Lower timeframes are also below Neutral so the ability to push higher exists
Daily Volume Delta
Volume Deltais an indicator that analyzes intrabar volume and price fluctuations to estimate the difference (delta) between buying and selling pressure within each chart candle
We can see that Selling is reducing since Mid October and that The Green Candles show us that Buying is picking up.
We will very possibly have to wait till we get the inflation figures for the USA later this week, before we get a real move.
There ismore than enough ability to push higher again but a Drop down to the 70K area is also possible..
Remain cautious for now...... Till we get a clear signal.

BTCUSD ARE WE AT A CRITIAL POINT BEFORE WE SEE A DROPwe see on the 4h time line a pendant formation
we also see that we are at the point where the market could make a break below the pendant
we see bearish pressure is huge and bulls are also aiming to keep the support at 88559 from failing
the pendant has a lot of dojis and almost no strong candle movements on the 4h because of the pressure from bought sides
at this level btc has 6 touches clearly showing the strenght of this level
but with caution we can also say it shows how this support level has depleted its power and postions at this level could be more obvious prime for stop hunting
lets trade save ....

BTC Update: Higher Lows Holding, Slow Grind Up – Boring Is GoodBTC continues to look solid here. Over the past several days we’ve seen a steady sequence of higher lows forming, even though price action has been slow, choppy, and not particularly exciting. But that’s exactly what you want in this phase of the market. Boring, controlled chop is how Bitcoin builds structure and absorbs supply before making any larger moves.
The key takeaway: buyers continue stepping in earlier each time, defending levels and maintaining the upward tilt. That’s a constructive sign.
I still think there’s a real possibility we eventually get a deeper liquidity flush down toward that major support level below – markets love to test those zones before committing to bigger trend legs. But the important part is that BTC has held up very well throughout the past week. No breakdown, no loss of structure, and the chop is leaning upward rather than downward.
Surviving the chop is the goal. And right now, Bitcoin is doing just that. Quiet strength.

BTC To 90K-88KAs per
W.D. Gann's Techniques of Analysis we will se BTC Between 90K - 88K
then to 140K

BTCUSD buy ideaBTC dropped aggressively during the NY session but found strong support at 89K, where it showed clear strength and buying interest. The reaction from this level signals that buyers are stepping in with conviction. The buy is already confirmed based on structure and momentum, making this a set-and-forget type of setup.

Bitcoin (BTC/USD) Daily Chart: Downtrend Pressure with Early Sta
Trend: BTC is still trading below a clear descending trendline, confirming a broader bearish structure since the mid-year highs. Lower highs and lower lows remain intact.
Price Action: Current price is around $90,160, consolidating after a sharp sell-off in November. This looks like a pause or base-building phase, not yet a confirmed reversal.
RSI (≈44): RSI is below 50, indicating weak momentum, but it has stabilized above oversold territory. This suggests selling pressure is easing, though bulls are not in control yet.
MACD: MACD remains below the signal line, but histogram contraction hints at bearish momentum slowing. A bullish crossover would be an early reversal signal.
Momentum/Volume Indicator: Negative values persist, showing dominant bearish momentum, but the flattening bars imply reduced downside strength.
Key Levels:
Resistance: $95,000–$100,000 (trendline + prior support)
Support: $85,000, then $78,000
Outlook:
BTC is in a bearish-to-neutral transition zone. A daily close above the descending trendline with RSI reclaiming 50 would favor a trend reversal. Failure to hold $85,000 increases the risk of another leg down toward $78,000.

$BTCUSD ANALYSIS (READ CAPTION) BTC Bulls Take ChargeHi Traders! today is 14 December 2k25 here is my today BITSTAMP:BTCUSD Analysis please read it and send me your ideas in comment section for more BITSTAMP:BTCUSD Analysis
Bitcoin is currently trading within a bullish market structure, supported by higher lows and multiple Breaks of Structure (BOS) on the upside. The price recently reacted strongly from the support area around 88,900, confirming strong buyer interest at this level.
Price continues to respect higher highs and higher lows. After tapping support, price pushed upward, indicating momentum shift in favor of buyers.
As long as price holds above the support area, the bias remains bullish. A clean breakout and strong close above the resistance zone could open the door for further upside continuation.
BULLISH SCENARIO:
PIVOT POINT: ($90000)
TARGET1): ($92500)
SUPPLY): ($93500)
RESISTANCE ZONE: ($95500/$96000)
SUPPORT AREA: ($88900)
Please dont forget like and comment for more $Bitcion latest updates
This Analysis for informational purposes only. trade is own your risk

BTCUSD view!!US-listed spot Bitcoin ETFs saw inflows of $237.44 million this week. Strategy Inc. bought 10,624 Bitcoin for $962.7 million, increasing its total to 660,624 BTC.
1
Grayscale Research has released a report predicting that Bitcoin is expected to break its all-time high in 2026, addressing concerns about a prolonged downturn in the cryptocurrency market.
2
In 2025, Bitcoin experienced significant volatility, fluctuating between approximately $95,000 and reaching an all-time high of $125,000, highlighting its price dynamics during that period

BTCUSD imp price $94000INDEX:BTCUSD
BTC bullish only above 94000.
note: this is education purpose only, please always make your own analysis, thanks.

BTCUSD 12/13/2025It looks as if Price is about to reverse here on the Daily Timeframe, which in fact will establish a Weekly Swing Low (Lower Low) & produce the start of the Weekly Timeframe Bullish Retracement. Let's see what Price does...
_SnipeGoat_
_TheeCandleReadingGURU_
#PriceAction #MarketStructure #TechnicalAnalysis #Bearish #Bullish #Bitcoin #Crypto #BTCUSD #Forex #NakedChartReader #ZEROindicators #PreciseLevels #ProperTiming #PerfectDirection #ScalpingTrader #IntradayTrader #DayTrader #SwingTrader #PositionalTrader #HighLevelTrader #MambaMentality #GodMode #UltraInstinct #LawOfCirculation #TheeBibleStrategy

BTC Corrections Don’t Kill Bull Market. They Power Them1. Primary Trend Structure
Macro trend: Clearly bullish. Price has respected a rising diagonal trendline since the 2022–2023 cycle low. Market structure shows higher highs and higher lows, confirming an intact uptrend.
This is a classic bull market staircase: impulsive advances (green boxes) followed by corrective consolidations (red boxes).
2. Cycle & Time Symmetry Observation
Advancing phases lasting roughly 120–225 days
Corrective phases averaging 80–120 days
Volume tends to expand during upswings and contract during consolidations
This suggests:
Healthy demand-driven rallies
Corrections are time-based rather than price-destructive
Importantly, the current corrective phase (~118 bars) is statistically aligned with prior pullbacks.
3. Current Price Action (Key Focus)
Price is pulling back toward the rising trendline. This is the first meaningful retest after a strong impulsive leg.
Historically, BTC has often reacted positively at this trendline
This zone acts as:
Dynamic support
A decision point between trend continuation vs. deeper correction
4. RSI & Momentum Context
RSI is around 45
This is neutral-to-bullish, not oversold. Momentum has cooled without breaking down
Interpretation:
No bearish divergence visible
RSI reset is consistent with bull market consolidations, not trend reversals
5. Volume Behavior
Declining volume during the pullback
Higher volume during prior upswings
This supports:
Profit-taking, not aggressive distribution
Sellers lack conviction so far
6. Key Levels to Watch
Support
Rising trendline (critical)
Prior consolidation midpoint (green box support area)
Psychological zone near previous cycle high region
Resistance
Recent local highs
Upper range of the last distribution box
Break-and-hold above prior ATH zone would signal continuation
7. Probable Scenarios
Scenario 1: Bullish Continuation (Higher Probability)
Trendline holds
Price forms a base
Next impulsive leg begins → new highs
Scenario 2: Deeper Correction (Lower Probability but Possible)
Daily close below trendline
Retest of prior green box support
On-Chain Confirmation
a) Long-Term Holder (LTH) Behavior
LTH supply remains stable to rising. No evidence of aggressive LTH distribution yet
Interpretation:
Smart money is holding, not exiting.
Exchange Balances
BTC on exchanges continues a structural decline
Indicates:
Reduced sell-side pressure
More cold storage / institutional custody
This supports the idea that pullbacks are liquidity-driven, not supply-driven.
Macro Liquidity Context (Primary Driver)
Global Liquidity (M2 & Financial Conditions)
Bitcoin’s major uptrends historically align with expanding global liquidity, not strictly rate cuts.
Even with policy rates elevated, financial conditions have eased via:
Treasury issuance absorption
Stable banking reserves
Risk-on capital rotation
Implication:
BTC can continue trending higher before rate cuts, as long as liquidity is not contracting aggressively.
ETF & Institutional Flow Impact:
Spot BTC ETFs introduced:
Persistent baseline demand
Structural bid during dips
Even during corrections:
Flows slow, but do not reverse violently
This changes historical cycle dynamics (less violent bear legs)
Risk Signals to Monitor (Invalidation Checklist)
This bullish macro/on-chain thesis weakens if:
Global liquidity contracts sharply
LTH supply begins sustained decline
Exchange inflows spike aggressively
Daily & weekly close below the rising trendline + failure to reclaim
Absent these, pullbacks remain buy-the-dip corrections.

BTC USDHI GUYS,
UPDATE ON CURRENT SITUATION
we have some scalp buys and sells as illustrated in the picture above.
I expect swing sells on (thur, fri) price pattern

Breaking: Bitcoin Might Dip to $70k Support Point The price of Bitcoin is poised to dip to the $70k support to shake off weak hands before picking liquidity up albeit the market is generally bearish.
The $70k support is feasible or nearest support zone for bitcoin to consolidate before going back up. In similar context, as per data from crypto quant the open interest of Bitcoin on all exchanges is down 0.45% losing roughly $29 billion.
This data further solidifies our bearish thesis on $BTC.

Weekly Market Watch | Key Levels & SetupsBitcoin has been moving within a range for about a month, progressing along a trendline inside this range. Each time it touches the support at this trendline, we can see that the buyers’ strength gradually weakens.
I am looking for a short trigger on Bitcoin, and a break of the support line around $89,000 could be a good trigger. Since a sharp drop might follow, a sell-stop can be used. However, one should be cautious of false breakouts. To filter out potential fakes, tools like ATR or volume analysis can be helpful.
Additional note:
It’s important to monitor the range boundaries and any sudden spike in volume, as these can indicate whether the move is likely to continue or reverse. Using multiple confirmations (price action, volume, and ATR) increases the probability of a successful short setup.

BTCUSDthe recent bitcoin published idea is not clear, so this current one still explains the same focast,

BTCUSD ANALYSISThis signal is formed through a structured analytical process that focuses on price efficiency, trend alignment, and liquidity interaction. The setup highlights a point where the market shows clear intent, supported by confirmation across multiple technical factors.
The objective of this signal is to present a clean trading plan with precise execution levels, allowing traders to operate with discipline and consistency. Emphasis is placed on risk control, logical invalidation, and realistic target projection.
📌 Signal Structure
Execution Level (Entry): Defined at a technically validated price zone
Risk Control (SL): Positioned beyond a key structure level to invalidate the setup
Profit Objectives (TP): Derived from liquidity targets, structure highs/lows, and volatility expansion
Analytical Context: Short explanation of market conditions and directional bias
Outcome Scenarios: Expected continuation or failure conditions based on price response
⚠️ Risk Disclosure
This content is provided for educational and analytical purposes only and does not constitute financial advice. Always apply proper risk management and adapt to real-time market changes.

btcusd forecast using elliot wavescurrently the market is on a wave 4 correction that am expecting to touch 98404. but first we need to complete a flat around 88375 before pushing up to 98404. i believe wave 4 will be complete around 98404. then wave 5 will begin down to 71089 which is 50% fib retracement on a weekly chart. NOTE: trading forex can lead to money loss. trade this idea at your own risk

Support is clearly defined + Resistance is within reach.1.Macroeconomic Expectations: Expectation Gap Opportunities Amid Rate Cut Games
The expectation for the Federal Reserve's December rate cut is characterized by "hidden support amid divergences". Although data from the CME FedWatch Tool showed that the probability of a 25BP rate cut dropped to 44.4%, this downward trend has been offset by two key factors. On one hand, Kevin Hassett, a White House official and a front - runner for the next Fed chair, publicly voiced his support for unconventional rate cuts, stating that there is substantial room for sharp interest rate reductions given the current economic data. On the other hand, former President Trump has been exerting constant policy pressure on the Federal Reserve. These two forces combined have prevented the market's expectation for a dovish policy guideline from fading away.
The fundamental support for the Fed's potential easing lies in the weakness of the U.S. economic fundamentals, especially the deteriorating labor market. In November, the ADP employment figure decreased by 32,000, and the number of layoffs soared by 183%. Such obvious signs of a sluggish labor market have provided solid realistic grounds for the Federal Reserve to implement loose monetary policies. It has become a preventive measure for the Fed to cut interest rates to avoid the spillover of the labor market's weakness to consumption and overall economic growth.
Additionally, Bitcoin and the U.S. dollar index maintain a strong negative correlation of -0.72. As the logic of the Fed's easing policy continues to take shape, the U.S. dollar is likely to weaken further. This inherent correlation has reserved sufficient room for Bitcoin's rebound after the dollar weakens. Currently, Bitcoin's price of $90,300 has already partially absorbed the risk of a less - than - expected rate cut. Looking ahead, the repair of the expectation gap, which comes from the possible alignment between the Fed's future policy moves and the market's dovish expectations, will become the core driving force for bullish positions in Bitcoin.
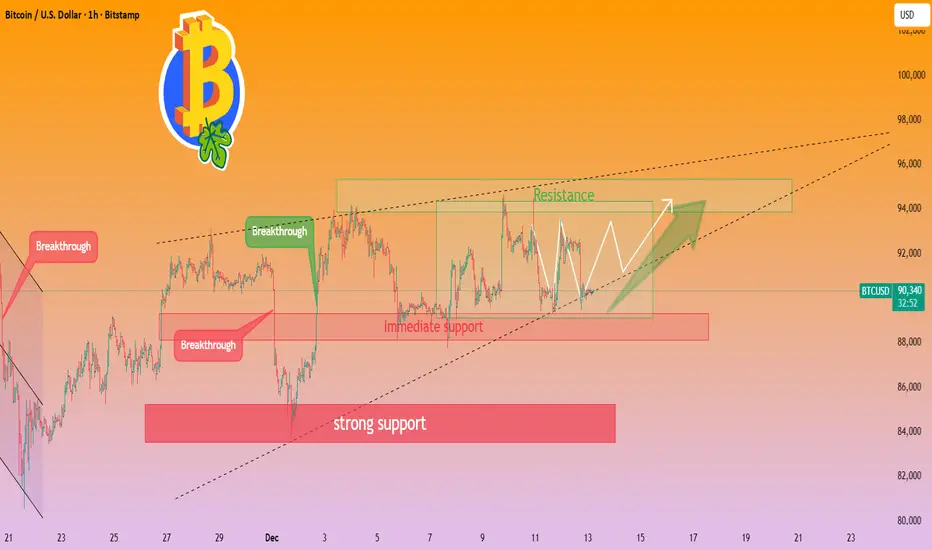
2. Technical Structure: At the End of Range Volatility with a Resilient Support System
Bitcoin's price of $90,300 is positioned at the midpoint of the trading range of $89,300 - $94,200. At this stage, it has formed a three - fold solid technical support system, laying a solid foundation for a potential breakthrough:
Bollinger Band Lower Track Acts as an Immediate Strong Support: The $89,300 level, which corresponds to the lower track of the Bollinger Band, has withstood multiple rounds of market testing without being broken. This fully indicates that there is sufficient capital accumulation at this price level. Whenever the price approaches this range, it can attract bargain - hunting funds, making it a reliable immediate support for Bitcoin.
Psychological and Capital Support Resonate at the Round Number Level: The $90,000 mark is not only a crucial psychological threshold for investors but also overlaps with the previous intensive trading zone. For most market participants, round - number prices often serve as important reference points for trading decisions. The combination of strong psychological recognition and sufficient capital absorption capacity at this level creates a resonant support effect, effectively preventing the price from plummeting sharply.
Indicator Signals Show Fading Downward Momentum: Although the MACD indicator on the daily chart shows a death cross, a bearish signal, the green bars have been continuously narrowing. This suggests that the short - term downward momentum of Bitcoin is gradually weakening. Meanwhile, the RSI indicator on the 4 - hour chart has moved out of the oversold zone. These indicator changes collectively imply that the market's selling pressure is easing, and the probability of a price breakthrough after a period of consolidation is significantly increasing.
In terms of resistance levels, the key resistance is concentrated near the 0.618 Fibonacci retracement level at $94,200. Once Bitcoin successfully breaks through this resistance with sufficient trading volume, it will open up an upward space towards $96,000. Overall, Bitcoin is currently in a layout window featuring clear support and accessible resistance. For investors, it is a suitable time to formulate trading strategies based on the boundary of the volatility range, with long positions built near the support zones and profit - taking set near the key resistance levels.
Bitcoin trading strategy
buy:89000-90000
tp:92000-93000-95000
sl:88000
Improved capital flows + strengthening technical indicatorsCapital Flow: Diminishing Selling Pressure & Institutional Accumulation on Dips
The capital side has shown the characteristic of "structural improvement": ① The open interest of perpetual contracts has dropped by nearly half since October, with excessively crowded trades cleared out, making the market structure healthier. ② On-chain data indicates that institutional wallets have been continuously increasing holdings within the $88,000 - $91,000 price range. Coupled with the supply-side reform where the U.S. strategic reserve freezes 6% of the circulating supply, the tradable chips have contracted. ③ The capital flow of ETFs has seen a marginal recovery. Some institutions have been accumulating positions through OTC channels amid the volatile market. The volume of large orders of 50 coins or more per transaction has increased by 12% month-on-month, and the selling pressure has entered a state of exhaustion.
Policy Dividends: Regulatory Confirmation of Rights & Strategic Reserve Backing
U.S. crypto policies have formed long-term favorable support: The Bitcoin Strategic Reserve Act has incorporated 200,000 BTC into the permanently non-saleable reserve, which has essentially restructured the supply-demand pattern. The coordinated regulation between the federal and state governments has established the world's first multi-level compliance system, reducing institutional concerns about policy risks when entering the market. Although short-term policy dividends have not directly driven price increases, they have provided a "value anchor" for the $90,000 mark, avoiding the risk of sharp declines and forming a margin of safety for long positions.
Bitcoin trading strategy
buy:89000-90000
tp:92000-93000-95000
sl:88000
