BITCOIN BEARISH BIAS RIGHT NOW| SHORT
Hello, Friends!
BITCOIN pair is trading in a local downtrend which know by looking at the previous 1W candle which is red. On the 4H timeframe the pair is going up. The pair is overbought because the price is close to the upper band of the BB indicator. So we are looking to sell the pair with the upper BB line acting as resistance. The next target is 89,196.10 area.
Disclosure: I am part of Trade Nation's Influencer program and receive a monthly fee for using their TradingView charts in my analysis.
✅LIKE AND COMMENT MY IDEAS✅
Market insights

BTCUSD – Support Flip Failure | Major Sell Zone ActivatedBTCUSD – Support Flip Failure & Bearish Liquidity Trap Setup
Price recently broke below the major intraday support zone, confirming weakness after multiple failed attempts to hold the structure. The market is now trading inside a retest phase, where price is likely to pull back toward the previous support (now turned resistance).
The zone between 92,200 – 93,500 is my SELL ZONE, where liquidity is sitting and buyers appear weak. If price taps this area with slow momentum (weak health), I expect sellers to regain control.
After the retest, BTC may continue its bearish leg toward the next major demand zone, highlighted as the TARGET area, aligned with a strong historical support region.

BTC 75-78K BEFORE CHOCHi thought upcoming news only follow the projection. as we know this Q4 is TLT & bonds allocation zone before the fed printing money on Q1. impact in early Q2

BTCUSD BEARISH OR RETEST (READ CAPTION)Hi trader's what do you think about bitcoin usd
BTCUSD is currently showing a bearish retracement structure, suggesting that price may continue to correct downward after failing to hold higher levels.
🔹 Resistance Level: 93,800
This level acts as a strong rejection zone.
If price retests 93,800 and fails to break above, it confirms bearish continuation. Sellers are expected to remain active below this zone.
🔹 Support Level: 90,800
This is the first support level where price may attempt a short-term bounce.
If BTC breaks below 90,800, bearish momentum will likely increase.
🔹 Demand Zone: 89,200
This is the major demand zone where strong buyers may step in.
If price reaches 89,200, a potential bullish reaction can happen, but until then the market remains in a bearish correction phase.
📉 Market Outlook
BTCUSD remains under bearish pressure as long as it stays below 93,800.
Break below 90,800 opens the way toward 89,200 demand, where buyers are expected to show stronger interest.
please don't forget to like comment and follow thank you

Trading Psychology: Inside the Mind of a Successful Trader🔥 Trading Psychology: Inside the Mind of a Successful Trader
⭐ 1. Why Most Traders Fail: The Battle Inside Their Own Mind
The majority of traders spend all their time trying to predict the market:
- “Will it go up or down?”
- “What if I lose this trade?”
- “What if I miss the move?”
This constant anxiety leads to emotional decisions chasing entries, closing profits too early, ignoring stoploss, overtrading…
A professional trader thinks differently:
👉 Once they enter a trade, they accept that the result is out of their control.
👉 Instead of worrying, they focus on improving their strategy and execution.
This shift in mindset separates amateurs from professionals.
⭐ 2. Avoid the Ego Trap: Overconfidence Destroys Traders
Many traders lose because they believe they are “right.”
They fall in love with their bias… and the market humbles them brutally.
A successful trader never assumes they know what the market will do.
They write everything down:
- their entry
- their exit
- their emotions
- the market structure
- what went well
- what failed
This trading journal becomes their mirror the place where REAL improvement happens.
⭐ 3. Learning From Losses: A Superpower Only Pros Have
Most retail traders quit after a few losses.
A professional trader studies those losses like gold.
Markets expose your weaknesses instantly.
A losing streak doesn’t define you — it teaches you:
- Was it a bad setup?
- Was it a psychological mistake?
- Did you violate your plan?
- Was it a normal statistical loss?
A winning trader accepts losses calmly.
Losses are information.
Information becomes experience.
Experience becomes confidence.
⭐ 4. Risk Management: Where Psychology Meets Survival
One of the most dangerous psychological traps is entering a trade even when there is no real opportunity.
Traders do this because:
- They are bored
- They fear missing out
- They want to “make back” losses
- They want to feel active in the market
But a professional trader knows:
👉 Protecting capital ALWAYS comes before making profits.
👉 You trade only when the market gives you a valid opportunity.
👉 You use stoploss not because you expect to lose, but because you respect the market.
Risk management is not technical it’s psychological discipline.
⭐ 5. Successful Traders Don’t Gamble - They Follow a Process
- Most people enter the stock or crypto market with no plan.
- They follow random advice, copy strangers online, or chase someone else’s profits.
This creates inconsistent results and emotional chaos.
A successful trader:
✔️ studies the market
✔️ researches proven strategies
✔️ practices before trading real money
✔️ learns from veteran traders
✔️ builds a personal trading system
✔️ follows that system with discipline
A system turns trading from gambling… into a professional process.
⭐ 6. The Habits That Build a Winning Trading Psychology
Here are the habits every long-term successful trader shares:
✔️ Have a trading plan and follow it strictly
It won’t guarantee profit every time, but it WILL guarantee long-term survival.
✔️ Don’t take shortcuts
Discipline is what separates consistent winners from emotional gamblers.
✔️ Don’t chase profits
The market offers opportunities daily — desperation kills clarity.
✔️ Only trade what you’re willing to lose
You can’t trade with courage if you trade with fear.
✔️ Accept losses without emotional collapse
A single trade does not define your career — your process does.
✔️ Trust your system, not your emotions
Your strategy knows more than your feelings.
🔥 Conclusion: Master Your Mind, Master the Market
To become a successful trader, psychology is everything.
You cannot control the market.
But you can control:
- your reactions
- your discipline
- your mindset
- your decisions
With the right psychology, your trading becomes calmer, more consistent, and more profitable.
Your wins become systematic.
Your losses become lessons.
And your journey becomes sustainable.
A winning psychology is not something you are born with it is something you build through habits, discipline, and time.
Trade like a professional. Think like a professional And your results will follow.

The Next BTC Push Starts Here!🔍 Key Market Structure
• Higher Lows (HL):
Buyers are quietly in control. Each dip into support produces a higher low, showing sustained bullish pressure.
• Lower Highs (LH):
The upper trendline acts as a “lid,” compressing price into a tight wedge.
• Breakout Circle Zone:
The circled area marks the convergence point between rising support and descending resistance — the most likely breakout zone.
• Arc Structure (Curved Supply–Demand Flow):
The lower arc shows strengthening demand, while the upper arc reflects fading sell pressure.
📈 Bullish Scenario – Breakout Continuation
BTC is likely to break the triangle → retest → expand upward into key targets.
ENTRY ZONE:
👉 Near the breakout area (92,300 – 92,600)
TAKE PROFIT TARGETS:
🎯 TP1: 93,374
🎯 TP2: 94,105
🎯 TP3: Higher expansion if resistance is cleared
STOP LOSS:
❌ Below 92,001
(A break below invalidates the compression-based setup)
⚠️ Bearish Invalidation
The bullish scenario becomes invalid if price:
• Breaks and closes below 92,001
• Loses the recent higher-low structure inside the triangle
Patience creates precision — hold your discipline and strike only when the breakout confirms.

Why Bitcoin Endures While 90% of Altcoins Are Born to… Die Over more than five years of observing the crypto market, one clear pattern stands out: Bitcoin survives every cycle, while most altcoins only last a few storms before vanishing. This is not a subjective impression but a reality that any serious investor must understand. Bitcoin and altcoins differ in origin, value, and market strength, and these differences are what allow BTC to endure while most altcoins fade away early.
Bitcoin was created with the mission of becoming “digital gold.” It has a fixed supply of 21 million, operates in a decentralized manner, is not controlled by any single organization, and is widely accepted as a global asset. In contrast, around 90% of altcoins are launched primarily to raise capital, for marketing purposes, or to chase technological trends. Bitcoin exists because of real value; altcoins exist on temporary expectations. When these expectations fade, altcoins die, while trust in BTC grows, allowing Bitcoin to continue evolving and remain a cornerstone of the market.
Another distinction lies in cycles. Bitcoin follows a four-year halving cycle, moving through stages of accumulation, boom, correction, and re-accumulation. BTC consistently surpasses previous highs thanks to its stable cycle and long-term capital, which ensures enduring vitality. Altcoins, however, often experience a short life cycle: launch, hype, pump, dump, and eventual oblivion. Most altcoins stop at the final stage and never return to previous peaks, while Bitcoin always finds a way to reach new highs, demonstrating superior resilience.
Capital backing is also a decisive factor. Bitcoin is accumulated by ETFs, major banks, financial institutions, certain countries like El Salvador, and large corporations such as MicroStrategy. This represents long-term, sustainable capital capable of withstanding market fluctuations. Altcoins, on the other hand, rely mainly on short-term traders, retail FOMO, or social media marketing, making their prices highly volatile when capital exits. Thanks to stable institutional flows, Bitcoin is continuously accumulated and is rarely at risk of “dying” in any cycle.
Token structure creates another clear difference. Altcoins often undermine their own value through tokenomics: early unlocks, large team allocations, high inflation, and weak real demand. Bitcoin is entirely different: fixed supply, no one can mint more, and halving reduces supply over time. This increasing scarcity acts as a shield for its value, explaining why Bitcoin endures over time.
The biggest distinction also lies in the role of each type of currency. Bitcoin serves as the standard and backbone of the market; altcoins are merely “experimental products.” When BTC rises, altcoins revive; when BTC moves sideways, altcoins pump along with the flow; when BTC drops sharply, altcoins crash the hardest. This is a crucial reason for investors to understand that Bitcoin is a real asset, whereas altcoins are interchangeable products that can fail at any time.
Smart investing starts with understanding this difference. Bitcoin survives because of trust, economic structure, and real value, while altcoins exist on expectations, marketing, and short-term capital. To thrive long-term in the crypto market, you should treat Bitcoin as a foundational, enduring pillar and view altcoins as short-term, high-risk opportunities. Once you grasp this rule, you will avoid being swept into “moonshot” projects or holding altcoins that never return to previous highs, and instead invest with strategic vision rather than emotion.

BTCUSD – 30M Distribution Retest | Bearish Continuation SetupBITSTAMP:BTCUSD
BTC is currently oscillating inside a tight consolidation after a strong recovery rally. Failure to break and hold above 94,234 would open room for a corrective move toward resting liquidity below 89,055 and 86,150. A deeper sweep into 83,900 remains possible if momentum weakens further.
Key Scenarios
📈 Bullish Case – Break & Hold Above 94,234
🎯 Targets → 95,500 / 96,800+
Invalid if price closes back inside the range.
📉 Bearish Continuation – Preferred Swing Scenario
Rejects 94,234 & falls below range mid-line:
🎯 Target 1 → 89,055
🎯 Target 2 → 86,150
🎯 Extended Target → 83,900 liquidity pocket
Current Levels to Watch
Resistance 🔴 94,234
Support 🟢 89,055
Break below → 86,150 → 83,900
⚠️ Disclaimer: This is educational market analysis, not financial advice.

BTCUSD (1H) – Distribution Under Supply + Breakdown SetupBITSTAMP:BTCUSD
If price loses 91,868 support, bearish continuation could accelerate into the liquidity pocket below. First major reaction expected near 86,531, while a deeper sell-side target sits toward 80,524 if liquidity flush extends.
Key Scenarios
📉 Bearish Case (Primary Setup)
Break + retest below 91,868 →
🎯 Target 1: 86,531
🎯 Target 2: 80,524 (deep liquidity sweep)
📈 Invalidation / Bullish Flip
Sustained close above 94,200 = failed distribution → further upside.
Current Levels to Watch
Resistance 🔴: 93,500–94,200
Support 🟢: 91,868 (break = sell continuation)
Main target: 86,500 → extension 80,524
⚠️ Disclaimer: This is a market study only, not financial advice.

BTC/USD – 30m | Range Break + Retest → Bearish Continuation SetuBITSTAMP:BTCUSD
As long as price remains below 93.927, bearish pressure holds weight. A clean rejection from this zone may push price toward deeper support as liquidity sits lower near 90.952, with an extended downside target if momentum accelerates.
Key Scenarios
📉 Bearish Continuation Setup (Primary Bias)
Rejection below 93.90–93.20 →
🎯 Target 1: 90.952
🎯 Target 2 (Final Target): ≈ 83.858
📈 Bullish Invalidation
Sustained break & close above 93.927 shifts sentiment bullish again.
Current Levels to Watch
Resistance 🔴: 93.927
Support 🟢: 90.952 → 83.858
⚠️ Disclaimer: For educational purposes only — not financial advice.

BTCUSD 30m — Trend Continuation Sell Setup | Smart Money FlowBITSTAMP:BTCUSD
After a strong liquidity grab at 93,900, price distributed inside the range and then broke structure to the downside.
BTC formed a lower high and respected the bearish trendline, confirming sellers in full control.
Market is now retesting the 89,800 – 90,200 flip zone which aligns with bearish continuation.
🔻 Bearish Case (Primary Setup)
Entry Zone: 89,800 – 90,200
🎯 Target 1: 88,261
🎯 Target 2: 83,880 (Sell-side Liquidity wipe)
❌ Invalidation: Break above 91,800 (range re-entry)
Market Structure Notes:
Liquidity swept at range high
Break of demand → resistance flip
Trendline guiding continuation lower
⚠️ Disclaimer: Educational analysis only — not financial advice

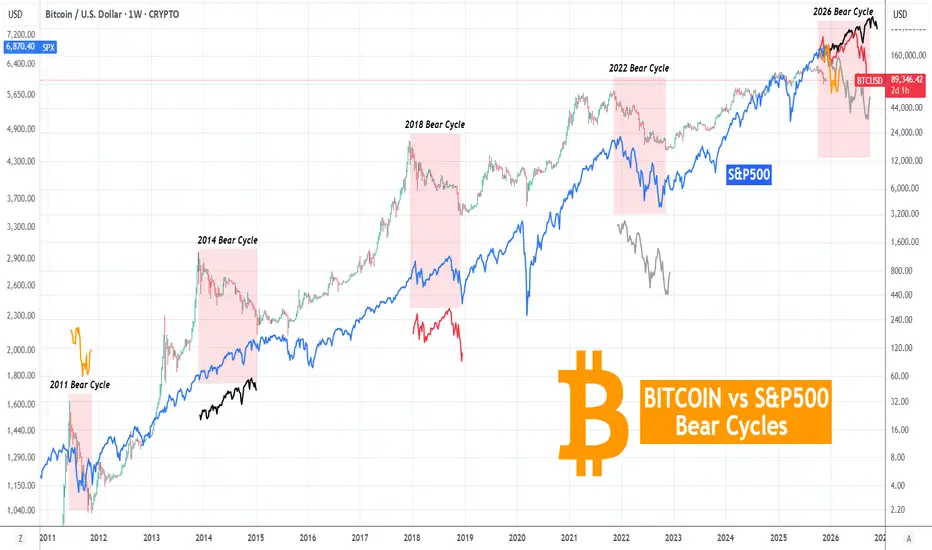
BITCOIN vs S&P500 Is the Bear Cycle correlation a myth?Bitcoin (BTCUSD) has entered a new Bear Cycle while the stock markets remain near their All Time Highs (ATH). The general notion is that when BTC starts a Cycle (either Bull or Bear), the stock market, which on this particular analysis is the S&P500 (blue trend-line) follows suit. But how much truth is in it?
Here we see those Bear Cycles since 2011. As you can see in 2011 and 2022 both BTC and the S&P500 dropped around the same time. In 2018 even though both started falling, the S&P500 recovered shortly after, even made new ATH but dropped again remaining volatile. On the other hand in 2014, the S&P500 kept rising, even though BTC was in a Bear Cycle.
As a result, the above notion isn't 100% accurate, not entirely a 'myth' but for sure not a certainty. We even plotted all previous S&P500 sequences during BTC's Bear Cycle, on today's Cycle and as you can see the worst case scenario based on that is a 2022 type correction (grey fractal), which would bring the index back to the April 2025 lows. Bitcoin will most likely have a typical Bear Cycle, especially with the last two (2022 and 2018) being almost identical.
So do you think the Bear Cycle correlation is a myth or not? Feel free to let us know in the comments section below!
---
** Please LIKE 👍, FOLLOW ✅, SHARE 🙌 and COMMENT ✍ if you enjoy this idea! Also share your ideas and charts in the comments section below! This is best way to keep it relevant, support us, keep the content here free and allow the idea to reach as many people as possible. **
---
💸💸💸💸💸💸
👇 👇 👇 👇 👇 👇
Bitcoin long term roadmapI expect bitcoin to climb a little bit along the bear flag all the way up to the fib level+ order block + upper side of the bear flag, where I expect big sellers to step in. From that point on the ultimate bottom will be below 70000 where I initiate long term dollar cost averaging sequence into the next bull cycle

BTCUSD AnalysisAs you can see... Bitcoin is looking for some liquidity... a bit manipulated but still following its casual cycle <3.

in an ideal world Bullish three rising valleys forming. Third valley is not confirmed yet, but if it bottoms out then great things will happen after the breakout.
🎅
🎅
🎅

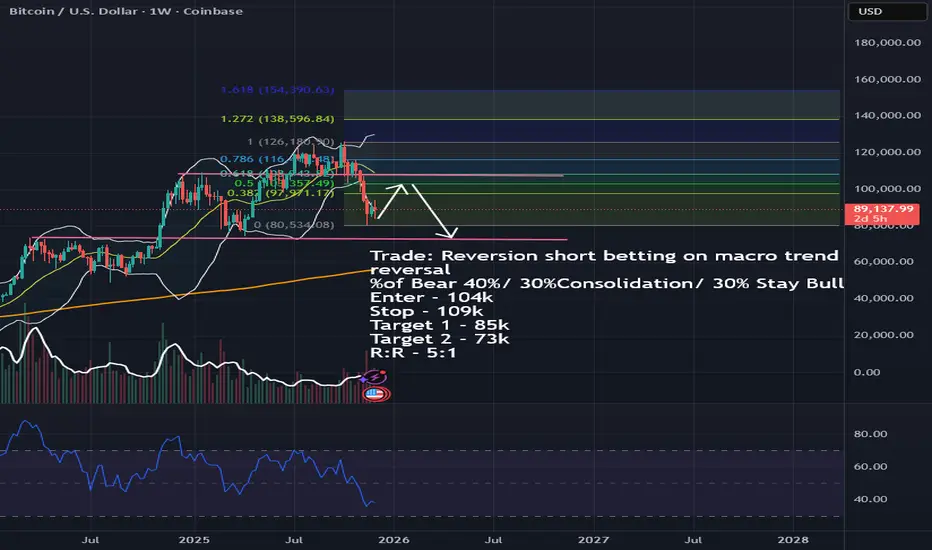
Market Indecision. Looking at Reversion Short. Hi All, its been awhile, but i am back!
Party looks like its over and could be a good time to bet on the reversal. What's going to happen is probably some consolidation into mean reversion here. It appears that sellers are exhausted on the short term and there are no panic spikes, theres alot of indecision in the market and its apparent with the dwindling volume. This looks like the housing market lol jk anyways-
Signs of trend reversal
• Confirmed MFI + RSI bearish divergence
• Price failing to hold above the 20-w MA
• Test of the 200-W MA
• Momentum rolling over with no panic volume
• Key support approaching ($82k–$85k zone)
I would position for a downside continuation, but NOT chase a short at current levels.
The correct play is a reversion short on a failed bounce.
Going for this
• Entry: 104,000
• Stop: 109,000 (risk = 5,000 per BTC)
• Target 1: 85,000 (reward = 19,000)
• Target 2: 73,000 (reward = 31,000)
• Size: 1 BTC
• You sell 50% at T1 and 50% at T2
Risk to reward to should be just about 5-1
Reward - $25k, Risk 5k
Kyle's checklist
Pattern - Rising Wedge breaking down into a distribution top
Candlesticks - Looks bear, top exhaustion
Trend - Signs of downside reversal
Harmonics - Nothing
Structure - Distribution
Indicators - Bearish divergence, MACD rolling over, stochastic failing at overbought
Now we're going to use CHATGPT to absorb my analysis, and put a model on all the categories i reviewed and implement a score. Heres what comes back
Scoring Scale
+2 = Strong bullish
+1 = Mild bullish
0 = Neutral / no signal
–1 = Mild bearish
–2 = Strong bearish
Weighting Model
Each family contributes differently to predictive strength.
Weights reflect information value in macro BTC cycles.
Category Weight (%)
Classical Patterns 10%
Candlestick / Price Action 10%
Trend / Volatility Systems 15%
Harmonic Patterns 5%
Market Structure (SMC/ICT) 15%
Volume-Based Patterns 15%
Indicator-Based Patterns 15%
Quant & Statistical Patterns 10%
Algorithmic / Regime Patterns 5%
Total 100%
Total Weighted Score
Sum all weighted scores:
–0.15
–0.15
–0.15
0
–0.30
–0.30
–0.30
–0.10
–0.075
——————————————
= –1.525 total score
Final Weighted Probability Summary
Outcome Probability Reason
Bullish Continuation 10–15% Too many higher-timeframe divergences + volume weakness
Neutral Consolidation 25–30% Possible if support holds, but structure still bearish
Bearish Breakdown 55–65% Confluence across 7/9 pattern families points down
Me VS ChatGPT
Agree - its probably going to go down
Disagree - i think its going to consolidate first and go sideways a bit before going down
BTC/USD – Potential Long Setup (15m)🚨 BTC/USD – Potential Long Setup (15m)
Buy Zone: $87,300 – $87,600
Entry: Aggressively now or on retest of 87.4k–87.5k
Target 1: $89,000
Target 2: $90,000
Target 3: $91,600+ (previous highs)
Stop Loss: $86,800 (below the recent swing low)
Reason: Strong bounce forming from the rising trendline + higher-timeframe support zone. Bullish divergence on RSI and volume spike on the reversal candle.
Risk: 1–2% of capital
R:R = 1:3+
#BTC #Bitcoin #BTCUSD #CryptoTrading #CryptoSignal #SwingTrade #Altseason2025
⚠️ Not financial advice – Trade at your own risk. Always do your own research and manage risk properly.
Feel free to copy-paste or adjust the targets/SL to your exact plan! Good luck if you're entering.

BTCUSDT WILL GO UP AGAIN !Btc will go up and we have lowerlow and higher height as you see on 4h
From now see btc first on 92k and breck it !

BTCUSD: Trading at Deep DiscountBTCUSD is trading inside a clear monthly discount zone, but the question is whether buyers can generate enough volume commitment to sustain a move higher. On the chart, price remains positioned in discount while the Dollar sits at its own discount levels, a combination that typically creates two-sided volatility rather than clean continuation.
Next week’s news flow increases the probability of liquidation-based rotation before the true directional leg. This is where traders often misread traps as signals, and where discipline matters more than conviction.
From a CORE5 lens, today’s read is driven by three pillars:
MSM — Market Structure Mapping: Monthly structure shows 90% discount with unresolved imbalance under the lows.
VFA — Volume Flow Analytics: No clear participation shift yet; buyers need real flow behind the move.
PEM — Precision Execution Modeling: Every trade here requires ultra-precise entries and fast stop protection.
Despite the attractive location, the imbalance under the monthly lows forces every setup to be analyzed twice. Stops must move to breakeven quickly. This is not a place for relaxed risk.
As of Friday evening, BTCUSD sits in a structurally strong buy zone, but confirmation depends entirely on volume entering the tape. Without that, the rotation remains potential rather than validated.
The daily range is defined by:
Low: 83,800
High: 94,181 (first target if volume confirms rotation)
Weekend probability is limited unless Sunday produces a clear volume spike.
The Core Message
BTCUSD is positioned in a high-value discount zone, but only volume can confirm the next rotation.
83,800 defines the structural low; 94,181 is the first clean upside objective if participation enters.
Trade the behavior, not the story.
— CORE5DAN
Institutional Logic. Modern Technology. Real Freedom.
BTC TO 60K PREDICTION this is just my prediction for btc
we had a choch on the weekly and failure to close above our previous weekly high and we broke through previous monthly low with heavy momentum and we are in weekly premium and have a fvg that needs to be filled before going higher and we also have an order block below with lines up with my monthly short term ema(blue line) and usually price likes to come to an order block when a fvg gets filled so yea btc to 60k

Bitcoin short: Wave 4 completed on Daily TimeFrameIn this video, I spent some time to talk about how sometimes Elliott Waves rules might confused and even seem broken, but we will need to adjust timeframe and understand the characteristics of the instrument in order to properly analyze the chart.
The stop for this idea is $94,300 and the take profit is $74,000.
Good luck!

BTC/USD drops 3.5% - key levels to watchJust when everything look calm again, cryptos have taken a beating again today and consequently US indices have come off earlier highs. Bitcoin hit resistance around $94K, which was a prior support level, and today it has broken below interim support around $91K, trigger stops from dip buyers. As before, key support comes in at $85.3K, but if that fails to hold this time, then $80K could be the next targets. on the upside, $91K is the most important level for the next days or two, and if that level is reclaimed then $94K is the next reference point to watch.
By Fawad Razaqzada, market analyst with FOREX.com

Final Impulse to $140K, But RSI Divergence Warns of Cycle Top1. Market Structure and Price Action Analysis
Trendline Support and The "Big W" Formation The chart displays a classic Ascending Broadening Wedge or Channel structure. The most critical immediate feature is the price reaction at the lower white diagonal trendline (labeled "weekly trendline").
Weekly Support: Bitcoin has successfully tested this long-term ascending support line. The recent drawdown of approximately 16.18% (as noted on the chart) served to flush out leverage and test the strength of this trend floor.
The "Big W" (4H/Daily): While the provided chart is on the Weekly timeframe, the formation of a "Big W" (Double Bottom) on the 4-hour and Daily timeframes at this specific support level is highly significant.
Implication: A Double Bottom on these intermediate timeframes acts as a Reversal Confirmation. It indicates that sellers have exhausted their momentum at the trendline support and buyers are stepping in aggressively.
Execution: The completion of this "W" pattern validates the bounce shown by the dashed white projection lines, providing the necessary momentum to launch the price toward the next resistance levels.
2. Technical Indicator Analysis
MACD (Moving Average Convergence Divergence)
Current State: The MACD histogram (circled in yellow) is currently showing red bars, indicating that the recent momentum has been bearish during the pullback to the trendline.
Future Outlook: For the bullish scenario to play out, the histogram must begin to recede (lighten in color) and flip to green as the price moves up. A bullish cross on the MACD signal lines on the weekly timeframe would act as a lagging confirmation of the move toward the new high.
RSI (Relative Strength Index) and Bearish Divergence
The Setup: The chart highlights a distinct Bearish Divergence using red trendlines. While the price of Bitcoin has been making Higher Highs (trending upward), the RSI has been making Lower Highs.
Interpretation: This discrepancy signals that the underlying bullish momentum is weakening. The bulls are pushing the price higher, but with less strength than before. This is often a precursor to a volatility expansion or a trend reversal.
3. The Path to $140,000: The Final Impulse
The projection logic suggests that the support at the daily/weekly trendline will hold. Driven by the "Big W" reversal, the price is expected to initiate a final impulse wave.
Target: The upward trajectory is aiming for the upper boundary of the channel or the extended resistance line. Based on the angle of ascent, this places the target price in the region of $140,000.
Market Psychology: This move is often characterized by "euphoria," where price action becomes parabolic to touch the upper resistance, drawing in retail liquidity.
4. The Bear Market Trigger: Uninvalidated Divergence
The most critical aspect of this analysis is the relationship between the projected new high ($140k) and the Weekly RSI.
The Scenario If Bitcoin rallies to $140,000, it will be setting a massive New All-Time High. However, we must watch the RSI level at that moment.
The Danger Zone
Invalidation (Bullish Case): To cancel the bearish threat, the RSI must break above the descending red trendline shown in the oscillator window. This would mean momentum has reset and supports the higher price.
Confirmation of Bear Market (Bearish Case): If price hits $140,000 but the RSI stays below the red trendline (making yet another Lower High), this creates an Extended Bearish Divergence on the Weekly/Monthly scale.
Conclusion An uninvalidated divergence at $140,000 would imply that the "tank is empty." Historically, multi-year bearish divergences on high timeframes are the technical triggers for macro trend reversals.
Result: This specific setup would likely mark the "Cycle Top."
Aftermath: Following the touch of resistance at $140k with weak RSI, the probability of a violent rejection increases drastically. This would likely trigger a significant correction that breaks the long-term support trendline, officially confirming the start of a prolonged Bear Market.
If you found this analysis insightful and my technical approach valuable, please hit the follow button to support my work and stay updated with similar comprehensive market analysis across all asset classes. Your support helps me continue delivering quality technical insights! 📊🚀
Want analysis on any other asset? Just mention it in the comments and I'll post it for you! 💬📈
