BTC PERPETUAL TRADE ,Sold From $106,800BTC PERPETUAL TRADE
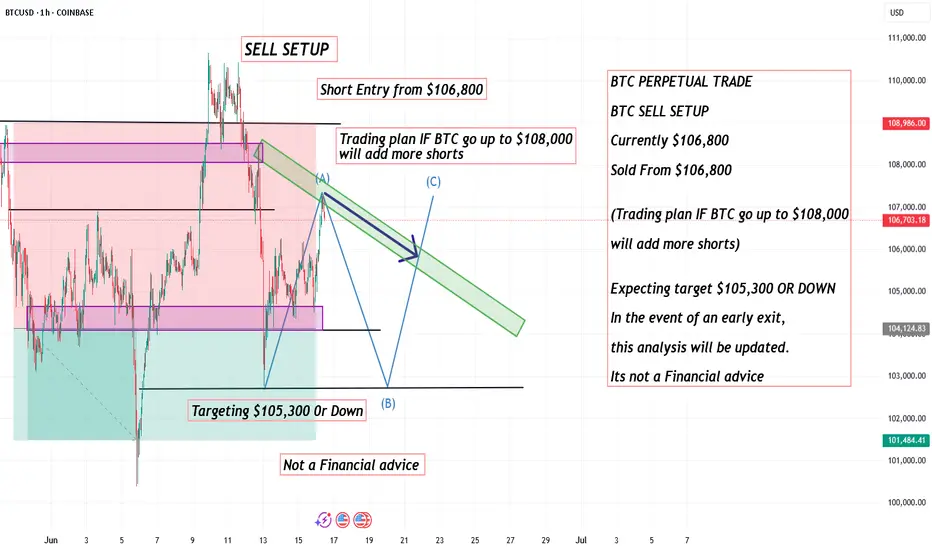
BTC SELL SETUP
Currently $106,800
Sold From $106,800
(Trading plan IF BTC go up to $108,000
will add more shorts)
Expecting target $105,300 OR DOWN
In the event of an early exit,
this analysis will be updated.
Its not a Financial advice
BITCOIN trade ideas
$BTC Holding But Still Bearish Bias Due to War Risk
Bitcoin is trading around $106K, but fear from escalating US–Iran–Israel tensions is keeping the market cautious.
🔸 Key Support Zone: $99,763 – $103,112
As long as BTC stays above this area, it's safe. But if broken, expect a move toward $90,209.
🔸 Upside Target: $110K (Paused)
Breakout chances remain low unless global tensions ease.
🔸 Risk Level: $99K
A daily close below this flips the chart fully bearish.
🔸 Action Plan:
We're still in a short bias zone due to war fears. Hedge remains active. Stay light, stay alert — volatility can spike fast.

BTCUSD LONGBTC has recently broken its last lower timeframe High, shifting market structure and indicating Buyers are currently in control. This break opened up a clear Demand Zone below, a small base or last bearish candle before the rise, which is a key area where unfulfilled buy orders may be resting.
Entry:
I’m looking to buy from this Demand Zone on the pullback, adding to go long when price enters this area. This lets me enter at a discount price while trading in direction of the newly established upward momentum.
Target:
The first Target Profit (TP) is set at the next supply Zone above, where selling pressure might emerge.
Stop Loss:
To control risk, the Stop Loss (SL) is placed just below the demand Zone.
If price drops below this area, it would invalidate the demand’s ability to hold, signalling a potential reversal.
✅ Summary:
• Market has shifted to bullish after breaking last high.
• Demand Zone below is a key area to watch for buying opportunities.
• Buy upon retracement into Demand, with Stop Loss below and Target at supply above.

$BTC Post-Market Update - 6/16Hello Fellow Gamblers,
Bitcoin did a beautiful move towards our confirmation level, but we are now facing with a possible rejection.
As you can see in the chart, i have 2 paths that are possible for us to see happening.
- We need the 1hr 20EMA hold support for a continuation up, a break of the 20EMA support will take price towards 106k level.
- A break of 106 level will validate the bearish scenario.
- If 106k level holds, we could see come quick accumulation to recharge for a stronger breakout.
- Level's to watch: 110.5k, 108.4k, 106.6k, 104.3k, 101.0k

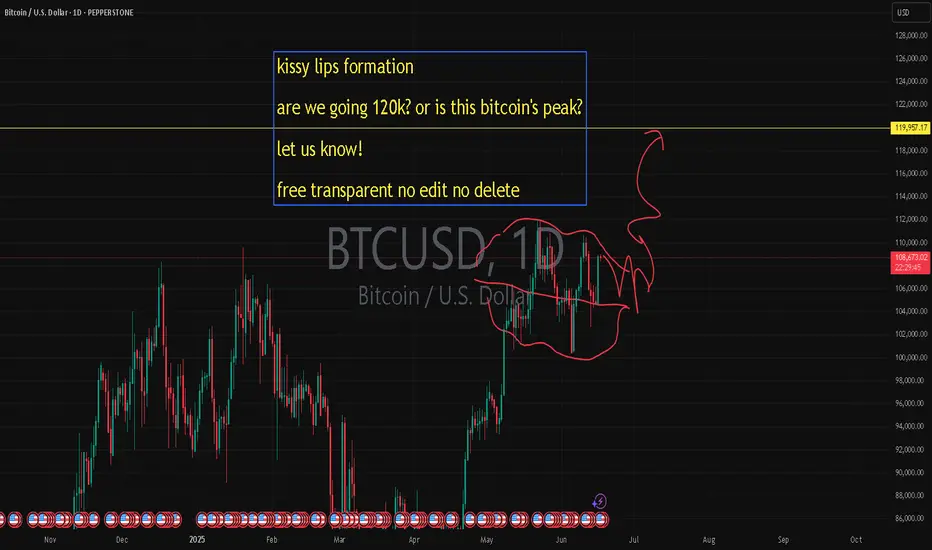
kissy lips formation are we going 120k? or is this btc's peak?kissy lips formation
are we going 120k? or is this bitcoin's peak?
let us know!
free transparent no edit no delete
🐉We value full transparency. All wins and fails fully publicized, zero edit, zero delete, zero fakes.🐉
🐉Check out our socials for some nice insights.🐉
information created and published doesn't constitute investment advice!
NOT financial advice
BTC UPDATEstill bulish in btc
waiting to inv THE D.BISI
gona be a good opportunity to add more trades
already have 1/1 RR in my first trade ( previous post )
gonna hold this to 1/2 RR
and the new trade to the ATH

Markets closed Expect buyers from yesterday too cash put on their entry’s and create a uptrend buying low and selling high for this week stay on the look out for trend changes

Bitcoin/USD 2-Hour Price ChartChart showing Bitcoin's 2-hour price movement against USD, currently at $106,647.03 (+0.96%), with a recovery trend from $105,000 and key levels at $109,000.92 and $104,544.34.

Bitcoin 4-year cycles - The party is getting startedPeople say this cycle is different. But so far, when you zoom out, things are following the general trends.
- The white vertical lines represents exactly 4 years from the first cycle peak
- The blue measurements represents exactly 399 days after the white vertical lines
The trend (so far) is clear. Bitcoin has a cycle peak every 4 years, and has a cycle bottom 399 days later
If this trend was to follow this cycle:
1. Bitcoin to peak on the week of 24th November 2025
2. Bitcoin to bottom on the week of 28th December 2026
Let me know what you think!

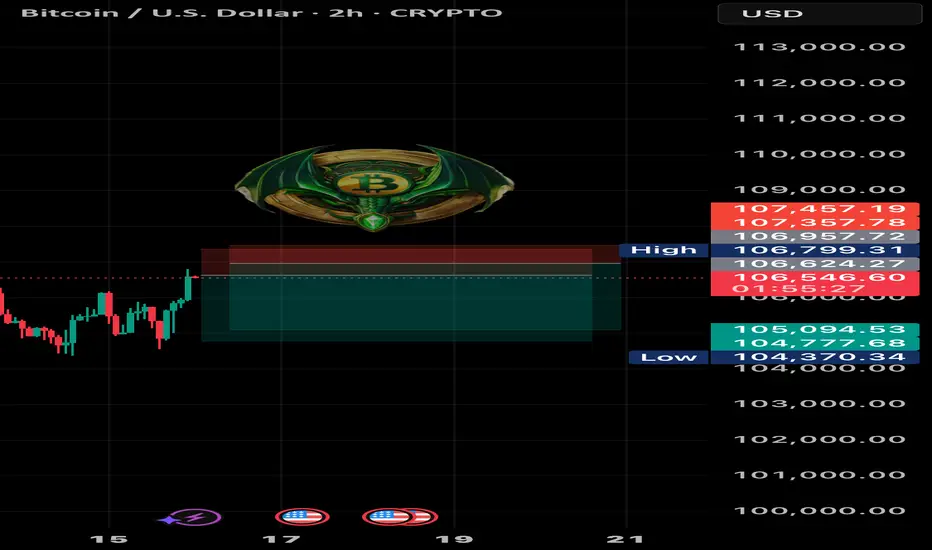
BTC SHORT TP:105,000 16-06-2025Back from a quick break and we’re jumping straight into action 😎
Short and sweet setup — we’re looking for a fast move down.
Entry: 106,500 – 107,000
Target: 104,800 – 105,100
RR: 3.0 average
Timeframe: 2H
Duration: 20–24 hours
Context: Quick and clean short after a small vacation break — let’s stack more green.
📌 Use a tight stop or adjust based on your strategy.
If the move doesn’t play out within the time range, the setup is invalid.
We don’t use indicators, we’re not out here drawing lines or cute little shapes — I just give you a clean trade.
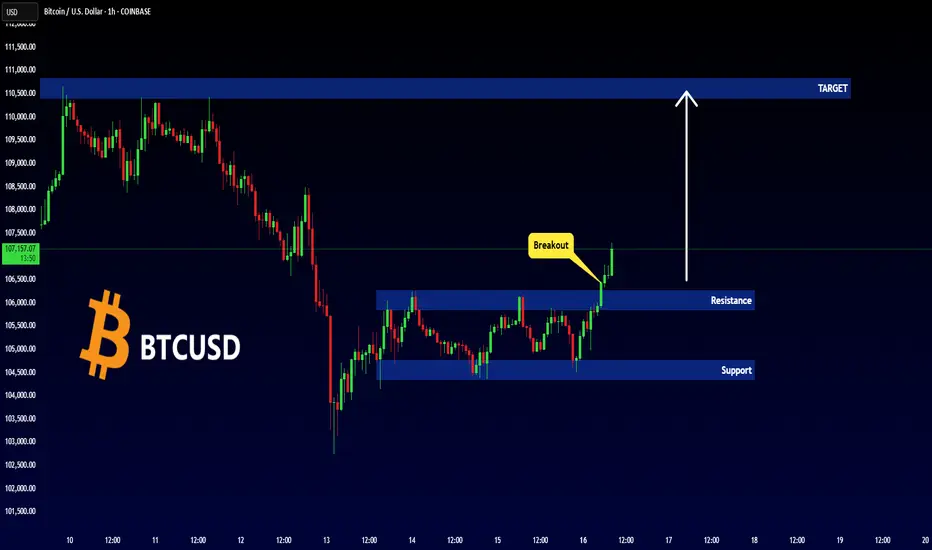
BITCOIN - Important Breakout !Hello Traders !
The Bitcoin price formed a rectangle pattern.
Currently, The resistance level is broken !
So, I expect a bullish move🚀
_____________
TARGET: 110400.00🎯
BTC to $100k?BTC retraced up to the 0.618 fib level in a 3 wave B. Soon it could resume the wave down to ~$100k. What do you think?

Bitcoin potential short tradeThe world is unstable and the crypto market is consolidating, I don’t expect a break out to all time high or new lows soon. Just a ranging market for now.
Entry: $109,700
Stop-loss: $110,919
Take-profit: 102,500
Let’s see this probability 70% chance of playing out ✔️

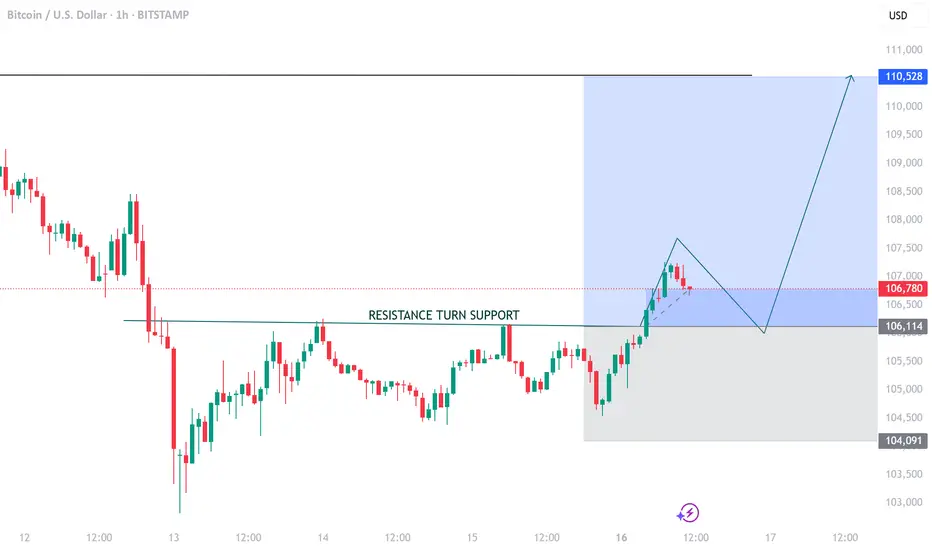
BTCUSD TRADE IDEABTCUSD is trading above a resistance turned support zone, a retest on that level will validate where the pair is heading, in my opinion i expect a buy signal once i see a reaction on that level. My TP is 110.528, Good luck and have a great trading week.
BTC/USDI've been calling for a crash for a while.
The closer to the top you are, the more hatred that you'll get for calling one.
It's a difficult position being contrary to the crowd. I think that's why Peter denied Jesus.
In any case, positive sentiment must end and as overdue as it is, I'm expecting a bang, after a final wave of FOMO.

Macromics Group: Market Trends Overview (June 2025)Global Economic Landscape: What Has Changed?
June 2025 marks significant shifts in the global economy. After several years of instability caused by the pandemic, inflation, and geopolitical tensions, markets are gradually stabilizing. However, new challenges are emerging: rising risks in Asia, digital transformation in Europe, and strategy shifts in the U.S.
China and India continue to show strong growth rates—5.8% and 6.5% respectively. Europe, by contrast, is lagging behind due to slow recovery and persistent inflation. The U.S. maintains a steady course driven by consumer spending and innovation, reporting 2.1% GDP growth.
Macromics Group continues to deliver in-depth analytics and strategies for clients seeking to understand and capitalize on these changes. We analyze trends across more than 120 industries, helping companies adapt and thrive.
Macroeconomics and Monetary Policy: A Shift Toward Stabilization
Financial regulators have begun cautiously lowering interest rates after the peaks of 2024. The U.S. Federal Reserve has dropped its rate to 4.5%, while the ECB has reduced its rate to 3.75%. This is made possible by a decline in inflation: 2.7% in the U.S. and 3.1% in the EU.
Meanwhile, developing nations like Turkey and Argentina are still grappling with high inflation. These countries risk falling behind the global recovery unless decisive steps are taken.
Overall, the global course is toward soft stabilization: interest rates remain high but steady. This creates favorable conditions for investment and long-term planning.
Financial Markets: From Caution to Moderate Optimism
Stock markets in June 2025 show mixed performance. U.S. indexes such as the S&P 500 and Nasdaq hit new highs, thanks to the booming tech sector. Stocks of companies involved in AI, quantum computing, and cybersecurity are particularly strong.
European markets are less active but relatively stable. Growth is limited by high costs, demographic issues, and the transition to ESG standards. In Russia and CIS countries, markets are under pressure due to sanctions, currency restrictions, and reduced investment.
On the currency front, the U.S. dollar and Chinese yuan dominate. The ruble is volatile, the euro is stable, and the yen is strengthening as a safe haven asset.
Technology: The Engine of New Markets
The main trend in 2025 is AI and automation. Companies are deploying neural networks in logistics, marketing, finance, and HR to cut costs and boost efficiency. Demand for AI professionals and developers is surging.
5G infrastructure has matured in most developed countries, unlocking new potential in IoT, telemedicine, and remote work. At the same time, quantum computing is advancing rapidly, with commercial solutions expected by 2026.
Macromics Group invests in next-generation analytical platforms, enabling clients to access real-time insights and forecast trends before they go mainstream.
Energy and Sustainability: ESG and the “Green” Shift
Energy markets have stabilized after the turbulence of 2024. Oil prices remain between $70–$85 per barrel—comfortable for both producers and consumers. Meanwhile, renewable energy—solar, wind, and hydrogen—is seeing record investment.
Corporations are increasingly reporting according to ESG standards. It’s not just a trend, but a new business reality. Investors demand transparency, consumers prefer socially responsible brands, and regulators impose mandatory reporting.
Macromics Group supports clients in transitioning to sustainable models by developing ESG strategies, assessing risks, and offering financial solutions.
Conclusion: Outlook for the Second Half of 2025
The first half of 2025 showed that markets are learning to operate in a new reality. The global economy is no longer chasing rapid growth, but adapting to volatility. Key focus areas are technology, sustainability, and smart resource management.
For businesses, this means quick adaptation, innovative thinking, and reliance on data-driven decisions. In this context, Macromics Group serves not just as an analyst but as a strategic partner.
Our recommendation: act proactively. In times of uncertainty, those who plan years ahead and use quality data will win.

Automated Trading with Pine ScriptIn the digital age, trading is gradually shifting from manual analysis to automated solutions. A key player in this process is Pine Script — a programming language developed for the TradingView platform, enabling users to create custom indicators, strategies, and automated signals. Its simplicity and powerful capabilities have made it especially popular among retail traders.
What is Pine Script?
Pine Script is a language developed by the TradingView team specifically for financial market analysis. Unlike general-purpose languages like Python or C++, Pine Script is designed for tasks related to technical analysis and trading automation.
It is used for:
Creating custom indicators;
Writing trading strategies;
Visualizing data on charts;
Setting up trading alerts (notifications).
Why Automate Trading?
Automated trading eliminates the human factor, which is crucial in volatile markets. Key advantages include:
Speed of reaction — the algorithm reacts instantly to signals.
Discipline — automated strategies do not succumb to emotions.
Scalability — one strategy can be applied to dozens of instruments.
Historical analysis — the ability to test ideas on past data (backtesting).
Structure of a Pine Script
Every script starts with a version declaration and the type of tool being created:
pinescript
Copy
Edit
//@version=5
indicator("Sample Indicator", overlay=true)
@version=5 — Pine Script version.
indicator(...) — indicates that the script is an indicator.
overlay=true — places graphics over the price chart.
For strategies, the strategy keyword is used:
pinescript
Copy
Edit
strategy("My Strategy", overlay=true)
Example of a Simple Automated Strategy
Let’s build a script that generates buy and sell signals based on the crossover of two moving averages:
pinescript
Copy
Edit
//@version=5
strategy("MA Strategy", overlay=true)
fastMA = ta.sma(close, 9)
slowMA = ta.sma(close, 21)
longCondition = ta.crossover(fastMA, slowMA)
shortCondition = ta.crossunder(fastMA, slowMA)
if longCondition
strategy.entry("Buy", strategy.long)
if shortCondition
strategy.entry("Sell", strategy.short)
plot(fastMA, color=color.green)
plot(slowMA, color=color.red)
This code:
Opens a long position when the fast MA crosses above the slow MA.
Opens a short position when the fast MA crosses below the slow MA.
Strategy Backtesting
TradingView automatically runs a backtest on historical data. In the Strategy Tester tab, users get:
total number of trades;
average profit;
win rate;
maximum drawdown;
risk/reward ratio.
This is a vital tool to evaluate the effectiveness of a strategy before deploying it in live trading.
Adding Stop Loss and Take Profit
To manage risk, strategies can include loss and profit limits:
pinescript
Copy
Edit
strategy.entry("Buy", strategy.long)
strategy.exit("Exit Buy", from_entry="Buy", stop=100, limit=200)
stop=100 — stop loss at 100 points.
limit=200 — take profit at 200 points.
This enhances both automation and risk control in the trading process.
Setting Up Alerts
While Pine Script cannot place real trades by itself, it can generate alert signals, which can be linked to external systems or brokers.
pinescript
Copy
Edit
alertcondition(longCondition, title="Buy Signal", message="Buy signal")
alertcondition(shortCondition, title="Sell Signal", message="Sell signal")
After adding these conditions to the chart, users can set up alerts that arrive via email, mobile notifications, or webhooks—useful for integration with bots or APIs.
Automated Trading via API
For full automation (from signal to trade execution), Pine Script is often used in conjunction with other technologies:
Webhook — TradingView sends an HTTP request when an alert triggers.
Server or bot — receives and processes the request, then sends an order to the broker.
Broker’s API — executes the order (open, close, modify positions).
Examples of brokers with API access: Binance, Bybit, Interactive Brokers, Alpaca, MetaTrader (via third-party bridges).
Tips for Writing Trading Strategies
Start simple. Use just 1–2 indicators.
Avoid overfitting. Don’t tailor your strategy too closely to past data.
Test on different timeframes. Ensure strategy stability.
Account for fees and slippage. Especially important on lower timeframes.
Add filters. For example, trend direction, volume, or volatility conditions.
Pine Script Limitations
While powerful and beginner-friendly, Pine Script has some limitations:
No tick-by-tick data access. Scripts execute on bar close.
Resource limits. Limits on script length and processing power.
No direct trade execution. Only possible via external integration or supported brokers.
Conclusion
Pine Script is an excellent tool for traders who want to automate their trading ideas. It allows you to create, test, and visualize strategies—even with minimal programming knowledge. While it’s not a full-fledged programming language, its capabilities are more than sufficient for most retail trading needs. With Pine Script, traders can improve efficiency, consistency, and reduce the emotional impact of trading decisions.

Gold $4,000 - BTC $120,000Gold at $4,000 an ounce and Bitcoin at $120,000
It may take time or there may be a temporary price correction, but reaching this price is on the way for these two assets.
Sasha Charkhchian

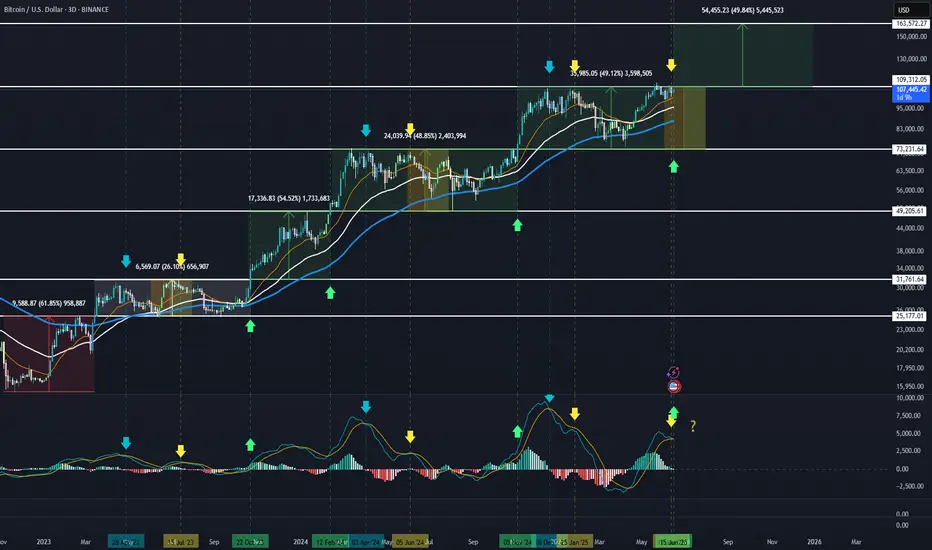
BTC climbs the stairsFrom the bear market lows(red) we entered into consolidation phase(white) in 2023 and in october 2023 the bull market was ignited(green). Since then BTC has climbed these ~50% steps up and right now we are at the verge of entering the last 50% step up of this bull phase taking us up to 160k. Are we going to see the last step up on upcoming months or are we going to see a rejection and keep consolidating inside the current box?
If we compare the previous two steps up(green arrow) to the current situation, the set up is a little bit different now than before. Previously, BTC has practically blasted through the box resistance without hesitation but now we have spent more time just underneath the box resistance with two failed attemps(3D) of breaking the resistance. Also, what concerns me, is the fact that during this cycle the summer months june-july(marked inside the box) has not been strong for BTC and we have witnessed MACD forming bearish divergences during these months due to a rejection from the highs towards the bottom of the box. This very thing is happening again and if confirmed, no new ATHs for this summer. Of course, a solid strong candle close above the resistance clarifies the future and set us on our way to 160k.
Bitcoin Consolidates Near Highs — Bullish Wedge Signals StrengthHolding Strong Amid Uncertainty:
Despite rising geopolitical tensions, Bitcoin remains resilient, trading near recent highs. This stability reflects strong institutional confidence and sustained accumulation by long-term holders.
Bullish Technical Setup:
The ongoing consolidation between $100,000 and $110,000 is forming a wedge pattern—a classic bullish continuation structure. This suggests the market is coiling for its next major move.
Key Levels to Watch:
Immediate Resistance: $112,500
Support Zone: Holding above $100,000 keeps the bullish case intact
Measured Move Target: $130,000–$135,000
Outlook:
This tight consolidation signals a healthy pause in a strong uptrend, positioning Bitcoin for a potential breakout and continuation higher. All signs point to the bulls remaining firmly in control.
#Bitcoin #BTC #TechnicalAnalysis #BullishWedge #CryptoMarket #InstitutionalBuying #PriceAction #Geopolitics #SupportAndResistance #BullRun

CHECK BTCUSD SIGNAL READ CAPTAINbtcusd sell now ✅
entry point (107.650) (107.450)
TAKE PROFIT 1: (106.800)
TAKE PROFIT 2: (105.800)
LAST TARGET (105.000)
STOP LOSS (108.400)

₿itcoin: Continuing B WaveBitcoin has recently reclaimed the key $106,000 level. Under our primary scenario, we anticipate continued increases into the blue Target Zone between $117,553 and $130,891 – where green wave B is expected to conclude. From that corrective peak, we project a significant move lower in wave C, which should ultimately pull prices into the lower blue Target Zone between $62,395 and $51,323. This range is expected to mark the completion of orange wave a. We then foresee a brief corrective rally before wave (ii) completes its broader correction with a final sell-off.
📈 Over 190 precise analyses, clear entry points, and defined Target Zones - that's what we do.

#4162025 | BTCUSD Supply Zone 1:10BTCUSD Supply Zone Appears in D1 Time Frame Looking Price Action for Long Term Sell
Risk and Reward Ratio is 1:10
After 50 pips Profit Set SL Entry Level
"DISCLAIMER" Trading & investing business is "Very Profitable" as well as risky, so any trading or investment decision should be made after Consultation with Certified & Regulated Investment Advisors, by Carefully Considering your Financial Situation.
