BTC Still bullish BTC Buy Setup , entry
• Daily turned bullish
• H4 bullish – new HH, pullback to low 89K and H1 turn bullish above 90500k
• Looking for break above 93K once H1 turns bullish
• Trail toward 100K
Market insights

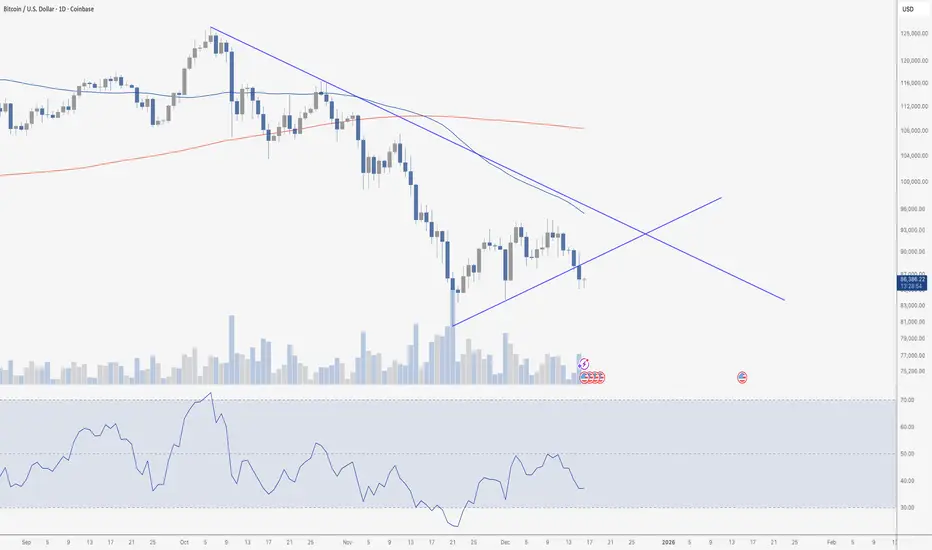
Bitcoin Breaking Down?Bitcoin lost ascending support on yesterday’s candle, giving a bit more evidence that the asset is not yet ready for renewed bullishness.
On the flip side, volume is non existent (bears want to see high volume on a breakdown), price still appears to be sideways, and any lower candle closes will likely form significant bullish divergence.
No matter how I look at the charts, I just see boring, choppy price action.
BTC Update: Higher Lows Holding, Slow Grind Up – Boring Is GoodBTC continues to look solid here. Over the past several days we’ve seen a steady sequence of higher lows forming, even though price action has been slow, choppy, and not particularly exciting. But that’s exactly what you want in this phase of the market. Boring, controlled chop is how Bitcoin builds structure and absorbs supply before making any larger moves.
The key takeaway: buyers continue stepping in earlier each time, defending levels and maintaining the upward tilt. That’s a constructive sign.
I still think there’s a real possibility we eventually get a deeper liquidity flush down toward that major support level below – markets love to test those zones before committing to bigger trend legs. But the important part is that BTC has held up very well throughout the past week. No breakdown, no loss of structure, and the chop is leaning upward rather than downward.
Surviving the chop is the goal. And right now, Bitcoin is doing just that. Quiet strength.

Bitcoin / USD ... BTCUSD / (BTC - USD)Bitcoin forcasting Target price shown, it will move up to 131600$ - 132000$ during Medium term period until next year 2026 ( April - May ).
5th wave is shown a pattern of Ending Diagonal / Ascending Broadening Wedge.
Today Liquidity pools had been implemented to start Accumulation before moving up next period time.
I Expecting positive news helps it to reach that level.
All companies in US market will move up at least double price from now and could be more depending on its Stock Maker and Liquidity.
Highly recommended for Buying from existing level now.

Bitcoin .... BTCUSD ... BITCOIN/DOLLAR ..The Key level 💯 88500$, if it Breaks up , W shape/Double Bottom pattern will be implemented .
Target price almost 93520$ initially, and could be much more.
W2 comes in Triple Combo / Triple Three Combination manner.
Who will win Bulls or Bears 🐻.... let's see 👀.

Elite | BTCUSD | 2H – Descending Structure Into Major DemandBITSTAMP:BTCUSD
After failing to hold above 92K–94K, BTC continued respecting the descending trendline, showing controlled sell pressure rather than panic. The current reaction at demand suggests sell-side liquidity has been tapped, but structure has not yet flipped bullish. Any upside move without a structural reclaim remains corrective until proven otherwise.
Key Scenarios
✅ Bullish Reversal / Expansion 🚀
Conditions (MANDATORY):
Strong 2H hold above 85,000
Break and acceptance above 88,500
Trendline breakout with follow-through
🎯 Target 1: 90,500
🎯 Target 2: 93,500
🎯 Target 3: 96,400 (major liquidity)
❌ Bearish Continuation 📉
Conditions:
2H close below 84,500
🎯 Downside Target 1: 82,800
🎯 Downside Target 2: 81,000
Current Levels to Watch
Resistance 🔴: 88,500 – 90,500 – 96,400
Support 🟢: 85,200 – 84,500 – 82,800
⚠️ Disclaimer: This analysis is for educational purposes only. It is not financial advice

BITCOIN 107,000 COMING SOONHello Team here we are once more wanting to tell you guys that BITCOIN will be bouncing back up to 107,000 and perhaps more our strategy has said so, which we are very fortunate to have. guys please allocate and DCA into bitcoin as it continues to bleed, but just know that deep down we are actually BULLISH ASF.

Bitcoin: can $90K sustain pressure?In a week of Feds rate decision, increased investors nervousness was also reflected on a crypto market in terms of higher volatility. BTC tried for one more time to reach the $95K resistance, however, the majority of trades ended around the $90K support. Broader crypto prices showed mixed performance with selective rebounds, as markets balanced macro uncertainty and investor positioning. Some analysts lifted views on Bitcoin miner stocks after recent price weakness.
The high-low trading range of BTC during the week was between $94,5K and $89,3K. The RSI tried to reach the 50 level, however, closing the week at 48. It indicates that the market is still not ready to turn toward the overbought market side. The MA50 further diverges from MA200, indicating that no cross will occur in the near term period.
Overall sentiment remains cautious but attentive to macro cues that continue to influence BTC price direction. Investors are still concerned regarding the course of US macro developments in 2026, in which sense, are still not ready to take higher positions in risk assets. BTC tried to move higher, but the energy was exhausted even before the price reached $95K. On the other hand, there is continuous selling pressure, which barely holds BTC at $90K. If the price finally breaks the $90K, the next level to watch will be the $85K level, with some probability for the $80K level. At the same time, BTC might revert to the higher grounds, however, it is unclear at this moment what the catalyst for such action could be.

BTCUSD; Heikin Ashi Trade IdeaLast time we had big divergence on MACD and weekly TF, we had big correction...

This is my work aint it great peopleSo theres a cry face because its going down :( And happy face for no reason AND ARROWSSSSSSSSS

BTC / LONG / 17.12.25BTC, LONG, 17.12.25
Reasons for entry:
1H imbalance inversion
BTC/ETH SMT divergence
Retracement of the bearish move exceeds 30%
Local bullish order flow

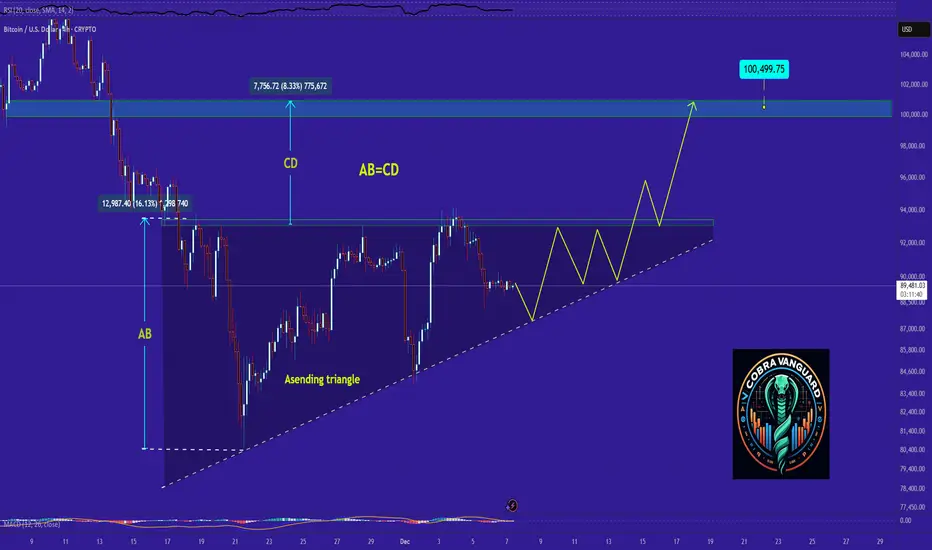
I think the only one Liking my post is me!The price on the 4h timeframe is within an ascending triangle, which can be promising. If the price breaks this pattern with bullish candles, it could easily rise by the distance of AB=CD.
BTC at support Likely wil rise againBTCUSD is trading in a channel pateern and Prce has reached the support and price may pullup from here to higher price .let us see how it plays out.

Elise | BTCUSD | 30M – Range Expansion SetupBITSTAMP:BTCUSD
After rejecting from the 93,500 resistance area, BTCUSD experienced a strong impulsive drop, sweeping sell-side liquidity before stabilizing at a key support level. The current structure shows consolidation above support, suggesting short-term accumulation. Buyers are active, but price still trades below major resistance, meaning confirmation is required.
This is a reaction-based trade, not a trend trade.
Key Scenarios
✅ Bullish Case 🚀
Condition: Hold above 86,200–85,100
🎯 Target 1: 88,800
🎯 Target 2: 90,000
🎯 Target 3: 92,000–93,500 resistance zone
❌ Bearish Case 📉
Condition: Breakdown & close below 85,000
🎯 Downside Target 1: 83,800
🎯 Downside Target 2: 82,000
Current Levels to Watch
Resistance 🔴: 90,000 – 93,500
Support 🟢: 86,200 – 85,100
⚠️ Disclaimer: This analysis is for educational purposes only. It is not financial advice

BTCUSD 15-Minute Chart – Symmetrical Triangle Consolidation withAnalysis:
Market Structure: After a sharp bearish impulse (strong sell-off), BTC entered a consolidation phase, forming a symmetrical triangle. This indicates balance between buyers and sellers after high volatility.
Trend Context: The impulse move before the triangle was downward, but price has stabilized and volatility is compressing — often a precursor to a strong breakout.
Pattern Details:
Lower highs and higher lows are clearly converging.
Price is currently near the apex, where breakout probability increases.
Bias:
The drawn plan suggests a bullish breakout scenario.
Entry is placed slightly above triangle resistance to avoid false breakouts.
Trade Plan (as illustrated):
Entry: On confirmed breakout above the triangle resistance
Target: Measured move projection upward (roughly equal to the triangle’s height)
Stop Loss (SL): Below triangle support to invalidate the setup
Risk–Reward:
Favorable R:R, as the stop is tight relative to the projected upside.
Confirmation to Watch:
Strong bullish candle close above resistance
Increase in volume on breakout
Failure signal if price breaks down instead and closes below support
Conclusion:
BTCUSD is coiling inside a symmetrical triangle after a high-momentum drop. The setup favors a volatility expansion trade, with a bullish breakout being the planned direction — but confirmation is essential. A downside breakout would invalidate the bullish bias and shift momentum back to sellers.

MASTERING RISK MANAGEMENT: THE SURVIVAL SYSTEM FOR TRADERSRisk management is not just a safety net; it is the specific system used to control losses and protect your trading capital. Without a strict risk plan, even a highly profitable strategy will eventually fail. A few bad trades should never have the power to wipe out your account.
WHY IT IS CRUCIAL
Markets are inherently unpredictable. No matter how good the analysis is, probabilities dictate that losses will occur. Risk management:
1. Protects against emotional trading (fear and greed).
2. Ensures long-term survival so you can stay in the game long enough to be profitable.
3. Stabilizes your equity curve, avoiding massive drawdowns.
OUR CORE RISK RULES
1. PER TRADE RISK LIMIT
Never risk more than 0.7% to 2% of your total account balance on a single trade. This ensures that a losing streak does not destroy your capital.
Example:
If you have a $10,000 account, your maximum risk per trade should be between $70 and $200.
2. DAILY LOSS LIMIT
Do not open too many positions simultaneously. You must have a hard stop for the day. Your total daily loss limit should be a maximum of 15% of your portfolio. If you hit this limit, stop trading immediately for the day to prevent emotional revenge trading.
KEY TOOLS FOR RISK CONTROL
Use a Risk Calculator to automate your position sizing. Do not guess your lot size.
Stop Loss (SL): An order that automatically exits a losing trade at a specific price. This is your insurance policy. Never trade without it.
Take Profit (TP): An order that locks in gains at predefined levels.
Risk-to-Reward Ratio (RRR):
Always aim for 1:2 or better. This means if you are risking 50 pips/5%, your target should be at least 100 pips/10%. With a 1:2 ratio, you can be wrong 50% of the time and still be profitable.
ADVANCED TACTIC: MOVING STOP-LOSS TO ENTRY (BREAK-EVEN)
Moving the Stop-Loss to the Entry price is a technique used to eliminate risk exposure in an active trade. It involves adjusting your stop loss level to the exact price where you entered the market.
Why do this?
If the trade reverses against you after moving to entry, you lose $0. You have eliminated the risk while keeping the potential for profit open.
ADVANCED TACTIC: CLOSING PART OF A TRADE (PARTIALS)
You do not have to close 100% of a trade at once. Closing a portion (partial closing) is vital for managing psychology and banking revenue.
By taking profits on 50% or 75% of a position, you lock in gains immediately. You can then leave the remaining portion of the trade running to catch a larger trend with zero stress, as you have already banked profit.
COMING UP NEXT
In the next article, we will be diving into Types of Traders & Their Risk Management Styles
Disclaimer: This content is for educational purposes only and does not constitute financial advice. Trading involves significant risk.
- Tuffy (Team Mubite)
#RiskManagement #CapitalProtection #TradingSurvival #RiskReward

BTCUSD|Bearish Below 88K as CPI and Quantum Talk Shape SentimentBTCUSD | Short Technical Overview
Bitcoin is trading around the 88,000 pivot line, showing continued weakness below the major resistance zone at 95,449–100,873. The structure remains bearish as long as price stays under this pivot, with a potential move toward 84,000 and then the deeper 76,600 support zone highlighted on your chart.
Today’s U.S. CPI will be a major volatility driver.
A higher-than-expected CPI reading would strengthen the USD and typically pressure Bitcoin downward, supporting the bearish structure already visible on the chart.
Beyond short-term volatility, a new narrative is emerging: a growing group of Bitcoin advocates and crypto fund managers is pushing for faster adoption of quantum-resistant signatures. They warn that even the perception of a future quantum threat could create market risk long before quantum attacks become technologically feasible. This could influence long-term sentiment and development priorities across the ecosystem.
Key Levels:
Pivot: 88,000
Resistance: 95,449 → 100,873
Support: 84,000 → 76,600
Bias: Bearish below pivot; CPI adds downside risk.

BTCUSD-Watchlist Review & Entry TriggersOn Bitcoin, the two entry triggers we reviewed this week both hit their targets. The price is now approaching the 80–82K zone, and we expect this move to continue.
However, we should keep in mind that Tuesday is packed with important news, which could invalidate technical scenarios. Risk management is crucial in these conditions.
Additional note:
During major news events, sharp and fake moves are very common. It’s safer to reduce position size or wait for confirmation candles after the news to better manage risk.

Bitcoin Imminent 2D Death Cross🔴The Bitcoin 2-day chart is approaching a death cross in the coming days.
While volatility has remained relatively stagnant since price retested the Weekly 100 EMA (around 85k🎯) in late November, it may spike as the death cross forms. The key support level to watch is a break below that W100 EMA, which would likely target the April lows of 77k-74k🎯.
🔵The next major resistance upon finding support is the Weekly 21 EMA, currently in the 100k-103k🎯 zone (In confluence with the 2D death cross zone)
🔵In summary, the overall structure remains bearish, though a corrective move upward is possible before any sustained downtrend resumes in the coming months.
Disclaimer: This is a hypothetical framework for educational purposes only and does not constitute financial advice. It is not a guaranteed predictor of future market performance. Always conduct your own research and understand the risks involved before making any investment decisions.

THE PSYCHOLOGY OF TRADING: WHY MOST TRADERS LOSE?You have probably heard that most people who attempt trading end up losing money. There’s a
good reason for this, and the reason is primarily that most people think about trading in the
wrong light.
Most people come into the markets with unrealistic expectations, such as thinking they are
going to quit their jobs after a month of trading or thinking they are going to turn $1,000 into
$100,000 in a few months. These unrealistic expectations work to foster an account-destroying
trading mindset because traders feel too much pressure or “need” to make money.
When you begin trading with this pressure, you inevitably end up trading emotionally—which is
the fastest way to lose your money.
To be specific, let’s break down the 4 Main Emotional Factors that destroy portfolios: FOMO,
Fear, Revenge, and Greed.
__________________________________________________________________________________
1. FOMO (Fear of Missing Out)
FOMO is an emotional state experienced by almost everyone. For traders, it is accelerated by
feelings of jealousy, envy, and impatience. The depth of these emotions is intensified by the
fast-acting environment of the Crypto and Forex markets.
How to Avoid FOMO:
● Develop a Routine: Trading is often a singular, lonesome pursuit. Eliminate distractions
and focus on identifying key market spots to tune out external chatter. Avoid social
media outlets and ungrateful attitudes.
● Be Present Minded, Future Thinking: Just because a trade is lost does not mean the
following transactions will follow suit. There are always more trading opportunities. Stay
present-minded yet have your scope set upon the future goals of your trading.
● Employ a Trading Plan: No plan is perfect, but a well-developed plan covers most
eventualities, helping you invest with lower risk exposure and more consistency.
Establish short-term, medium, and long-term trading goals.
● Take Joy from Trading: FOMO stems from insecurity and greed. Once a trader grasps
this truth, they can cast out this reckless state and trade with maximum potential.
__________________________________________________________________________________
2. GREED (The Account Destroyer)
There’s an old saying regarding markets: “Bulls make money, bears make money, and pigs
get slaughtered.”
This means if you are a "greedy pig" in the markets, you are almost certainly going to lose.
Greed acts as a trader’s kryptonite. When the desire for wealth clouds logic, traders make fatal
mistakes such as:
● Not taking profits because they think a trade will go on forever.
● Adding to a position simply because the market moved slightly in their favor (without
logical price action reasons).
● Using excessive leverage to maximize potential gains.
● Doubling down on losing trades (The Martingale Strategy).
Advice for Avoiding Greed:
Think of greed as the counterpart to discipline. Traders who are well-poised and consistent are
less likely to fall victim to greed. It is critical that every trader consistently follow trading plans;
otherwise, the likelihood of slipping into destructive habits is far greater.
__________________________________________________________________________________
3. FEAR
Fear often arises after a trader hits a series of losing trades or suffers a loss larger than what
they are emotionally capable of absorbing.
When fear takes over, you hesitate. You might see a perfect setup that aligns with your strategy, but you freeze because you are afraid of losing again. Or, you might cut a winning trade too early because you are terrified the market will turn against you. Fear paralyzes your ability to execute your edge.
__________________________________________________________________________________
4. REVENGE TRADING
Revenge trading is a natural emotional response when a trader suffers a significant loss. The
idea is to recover the money immediately. The thinking is: "If I put on another trade right now, I can win it back."
Usually, this "expected" winning trade turns into a losing trade—often bigger than the first one.
5 Effective Ways to Fight Revenge Trading:
1. Step Back Temporarily: Take a day or two off. If you must be in the markets, trade
incredibly small, but the best course is to walk away.
2. Make a Self-Assessment: Once you are emotion-free, analyze what led to the loss.
Was it a bad strategy, or bad execution?
3. Assess Market Conditions: Is the market too volatile? Are there no solid trends?
Sometimes the best trade is no trade.
4. Assess Your Strategy: Check your entry and exit criteria. Did you actually see a setup,
or did you force a trade out of anger?
5. Make Necessary Adjustments: Note the feedback, learn the lesson, and mentally
"throw" the bad trade away. Affirm to yourself: "That is how I will do it next time."
__________________________________________________________________________________
SUMMARY
Trading is simple, but it is not easy. The charts are the easy part; managing your own mind is
where the real work begins. Identify these four emotions— FOMO, Fear, Greed, and
Revenge —and suppress them the moment they arise.
Are you controlling your emotions, or are they controlling your portfolio? Let me know in
the comments below.
__________________________________________________________________________________
Disclaimer: This content is for educational purposes only. Trading involves significant risk.

Bitcoin ... BTCUSD .. Bitcoin being in Handle side of Cup and Handle pattern as whole.
By breaking up 88160$ , it will move towards 91118$ , expecting to go more higher up to 94K.
In short term period we can reach above 100K .
Good Luck all .

Bitcoin (BTCUSD) – 4H TimeframeBitcoin (BTCUSD) – 4H Timeframe
🔎 Market Structure
Primary structure: Bullish, supported by the red ascending trendline (higher lows still intact).
Secondary structure: Bearish correction under the green descending channel.
We are currently sitting right on the decision zone — no-man’s land where amateurs flip coins and pros wait.
📉 What Price Is Doing (Very Important)
BTC rejected from 92,700 → clear supply.
Price is now below the mid-range resistance (90,898) and struggling to reclaim it.
The latest candles show weak bounces, not impulsive buying — that’s corrective behavior.
This tells us:
The market is deciding whether this is just a pullback or the start of a deeper bearish leg.
⚠️ Key Levels That Control Everything
92,718 → Major resistance / trend continuation trigger
90,898 → Pivot battlefield (acceptance = bullish attempt)
88,228 → First downside reaction zone
86,772 → Bearish expansion target if structure fails
🧠 Scenario Breakdown (No Emotions)
🟦 Bullish Scenario (Only IF confirmed)
Hold above 88,228
Break and 4H close above 90,898
Then continuation toward 92,718 and channel top
👉 That’s your blue path — valid only with confirmation.
🟨 Bearish Scenario (More likely for now)
Failure to reclaim 90,898
4H close below 88,228
Opens the door toward 86,772 and possibly lower channel support
👉 That’s your yellow path — structure-based, not hope-based.
📌 Bottom Line
Bias right now: Bearish corrective pressure
Trend is NOT broken yet, but it’s being tested hard
No rushing trades — let the 4H candle do the talking
Old rule still wins:
“Trends don’t die quietly — they warn you first.”
BTC is warning, not confirming.
Sit tight, trade smart, and let price earn your risk.
— Avo.Trades 🚀

BTCUSD SELL SETUPPOSSIBLE SELL SETUP BTCUSD
SL ABOVE SUPPLY ZONE
TP 1 BELOW DEMAND ZONE
TP 2 OPEN USE PROPER RISK MANAGEMENT
FOLLOW YOUR TRADING PLAN !!!!
SIMPLE BTCUSD TRADING PLAN
1️⃣ Timeframe
15m or 1H only
2️⃣ Indicators
200 EMA → trend
50 EMA → entry
RSI (14) → confirmation
3️⃣ BUY RULES
✅ Price above 200 EMA
✅ Pullback to 50 EMA
✅ RSI above 50
✅ Bullish candle
➡️ Then BUY
4️⃣ SELL RULES
✅ Price below 200 EMA
✅ Pullback to 50 EMA
✅ RSI below 50
✅ Bearish candle
➡️ Then SELL
5️⃣ Risk Rules
Risk 1% per trade
Always use Stop Loss
Target = 2× Stop Loss (1:2)
6️⃣ Management
At 1:1, move stop to breakeven
Do nothing else
7️⃣ Golden Rules
❌ No stop loss = no trade
❌ No emotions
❌ No overtrading
ONE LINE RULE
If all rules aren’t met → NO TRADE
