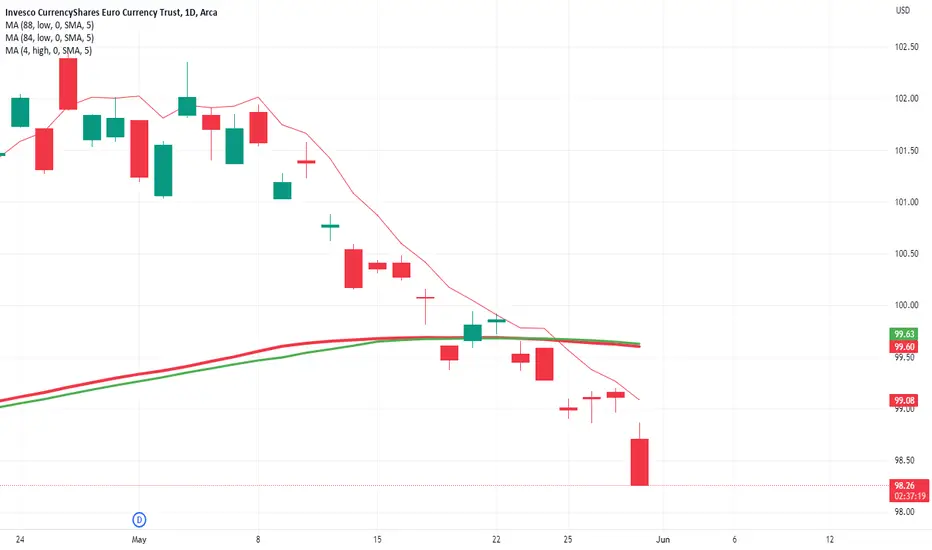
FXE fixing to rally?3 concentric containment MAs. Are we done with this lengthy and parabolic slide? Today felt like a bottom of sorts to me.
Key stats
About INVESCO CURRENCYSHARES EURO TRUST
Home page
Inception date
Dec 9, 2005
Structure
Grantor Trust
Dividend treatment
Distributes
Distribution tax treatment
Ordinary income
Income tax type
Ordinary Income
Max ST capital gains rate
39.60%
Max LT capital gains rate
39.60%
Distributor
Invesco Distributors, Inc.
FXE allows investors to access the euro with holdings of physical euros in a deposit account. This simple structure allows the fund to closely track the euro/US dollar spot exchange rate. Still, it is worth noting that: 1) distributions and share sales of FXE are always taxed as ordinary income, so increase in holding cost should be expected, and 2) the fund's physical deposits of euros are uninsured, so it carries the default risk of its depository, JPMorgan. Additionally, another thing to note on FXE is that it doesn't deliver the overnight lending rate like its benchmark does.
Classification
Symbol
Geography
Eurozone
What's in the fund
Exposure type
Cash
Bonds, Cash & Other100.00%
Cash100.00%
Miscellaneous−0.00%
Top 10 holdings

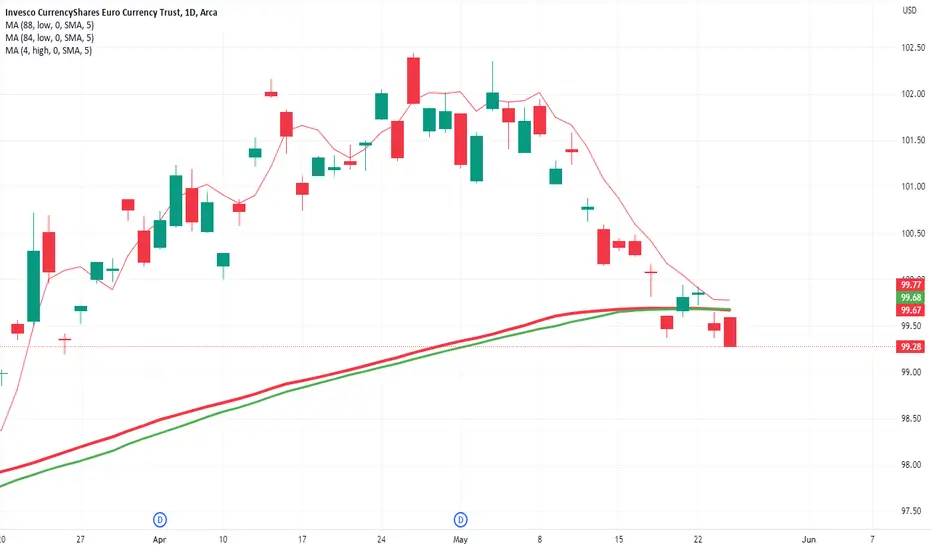
FXE - fixing to rally?Progressively tighter containment MAs portend possible imminent rally. Possibly brief but May be explosive.

FXEAlmost a 3:1 containment under the 4 day MA of highs. I’m definitely a buyer if it breaks that MA. Tempting now but would wait for 3.5:1 to do preemptively.

FXE - a one day relief rallyNot uncommon. This happens. Important not to get married to a trade or position. After a compression ratio of about 4:1, not surprised to see a pop. The real potential reversal is the zero slope MA just above recent price action. Potentially explosive if violated.

FXEWas that the exhaustion move? Everyone who wanted to sell is done? I'd look for at least a decent retracement. Prompted by the Friday number?
BITO, FXE, GLD, TLTThe markets BITO, FXE, GLD, TLT are all under extreme downleg compressions. A resolution or resolution failure could cause an extreme reaction in any or all of these markets. If there is a marked retracement in any of these markets an out of the money call position could offer an exceptional oppor

FXE - waiting on the reaction swingThe long term zero slope pivot MA and the containment MA together warning of imminent and perhaps significant if not lengthy rally. I am in preemptively and also have some dry powder if/once triggered.

FXE - what will trigger the upside move?Not sure I've seen too many better upside pivot setups. I'm already long preemptively with tight stops. The real juice is just above with zero slope MA and containment MA now also roughly zero slope.
Monthly Stochastic Bullish Divergence FXE Monthly Stochastic (14,3,3) Bullish Divergence FXE
Long FXE
T/P @ 120
S/L @ 95.86


See all ideas
Summarizing what the indicators are suggesting.
Oscillators
Neutral
SellBuy
Strong sellStrong buy
Strong sellSellNeutralBuyStrong buy
Oscillators
Neutral
SellBuy
Strong sellStrong buy
Strong sellSellNeutralBuyStrong buy
Summary
Neutral
SellBuy
Strong sellStrong buy
Strong sellSellNeutralBuyStrong buy
Summary
Neutral
SellBuy
Strong sellStrong buy
Strong sellSellNeutralBuyStrong buy
Summary
Neutral
SellBuy
Strong sellStrong buy
Strong sellSellNeutralBuyStrong buy
Moving Averages
Neutral
SellBuy
Strong sellStrong buy
Strong sellSellNeutralBuyStrong buy
Moving Averages
Neutral
SellBuy
Strong sellStrong buy
Strong sellSellNeutralBuyStrong buy
Displays a symbol's price movements over previous years to identify recurring trends.
Related funds
Frequently Asked Questions
An exchange-traded fund (ETF) is a collection of assets (stocks, bonds, commodities, etc.) that track an underlying index and can be bought on an exchange like individual stocks.
FXE trades at 2,025.00 MXN today, its price has risen 1.25% in the past 24 hours. Track more dynamics on FXE price chart.
FXE net asset value is 2,031.87 today — it's fallen 3.07% over the past month. NAV represents the total value of the fund's assets less liabilities and serves as a gauge of the fund's performance.
FXE assets under management is 10.09 B MXN. AUM is an important metric as it reflects the fund's size and can serve as a gauge of how successful the fund is in attracting investors, which, in its turn, can influence decision-making.
FXE price has fallen by −2.92% over the last month, and its yearly performance shows a 21.31% increase. See more dynamics on FXE price chart.
NAV returns, another gauge of an ETF dynamics, have risen by −3.07% over the last month, have fallen by −3.07% over the last month, showed a 3.67% increase in three-month performance and has increased by 23.76% in a year.
NAV returns, another gauge of an ETF dynamics, have risen by −3.07% over the last month, have fallen by −3.07% over the last month, showed a 3.67% increase in three-month performance and has increased by 23.76% in a year.
FXE fund flows account for 6.58 B MXN (1 year). Many traders use this metric to get insight into investors' sentiment and evaluate whether it's time to buy or sell the fund.
Since ETFs work like an individual stock, they can be bought and sold on exchanges (e.g. NASDAQ, NYSE, EURONEXT). As it happens with stocks, you need to select a brokerage to access trading. Explore our list of available brokers to find the one to help execute your strategies. Don't forget to do your research before getting to trading. Explore ETFs metrics in our ETF screener to find a reliable opportunity.
FXE invests in cash. See more details in our Analysis section.
FXE expense ratio is 0.40%. It's an important metric for helping traders understand the fund's operating costs relative to assets and how expensive it would be to hold the fund.
No, FXE isn't leveraged, meaning it doesn't use borrowings or financial derivatives to magnify the performance of the underlying assets or index it follows.
In some ways, ETFs are safe investments, but in a broader sense, they're not safer than any other asset, so it's crucial to analyze a fund before investing. But if your research gives a vague answer, you can always refer to technical analysis.
Today, FXE technical analysis shows the buy rating and its 1-week rating is buy. Since market conditions are prone to changes, it's worth looking a bit further into the future — according to the 1-month rating FXE shows the buy signal. See more of FXE technicals for a more comprehensive analysis.
Today, FXE technical analysis shows the buy rating and its 1-week rating is buy. Since market conditions are prone to changes, it's worth looking a bit further into the future — according to the 1-month rating FXE shows the buy signal. See more of FXE technicals for a more comprehensive analysis.
Yes, FXE pays dividends to its holders with the dividend yield of 1.69%.
FXE trades at a premium (0.34%).
Premium/discount to NAV expresses the difference between the ETF’s price and its NAV value. A positive percentage indicates a premium, meaning the ETF trades at a higher price than the calculated NAV. Conversely, a negative percentage indicates a discount, suggesting the ETF trades at a lower price than NAV.
Premium/discount to NAV expresses the difference between the ETF’s price and its NAV value. A positive percentage indicates a premium, meaning the ETF trades at a higher price than the calculated NAV. Conversely, a negative percentage indicates a discount, suggesting the ETF trades at a lower price than NAV.
FXE shares are issued by Invesco Ltd.
FXE follows the USD/EUR Exchange Rate. ETFs usually track some benchmark seeking to replicate its performance and guide asset selection and objectives.
The fund started trading on Dec 9, 2005.
The fund's management style is passive, meaning it's aiming to replicate the performance of the underlying index by holding assets in the same proportions as the index. The goal is to match the index's returns.